

DivergencesDivergenceWhen price makes a new extreme but a momentum indicator (RSI, MACD, etc.) does not — a sign that the move is losing internal force even though it's still going.Click for full definition → PRO
An RSIRelative Strength IndexA 0-to-100 momentum oscillator measuring the size of recent up-bars versus down-bars. Above 70 is hot, below 30 is cold, near 50 is neutral.Click for full definition →-driven scanner that auto-prints the four classic divergenceDivergenceWhen price makes a new extreme but a momentum indicator (RSI, MACD, etc.) does not — a sign that the move is losing internal force even though it's still going.Click for full definition → types on every fractal pivotPivot High / Pivot LowA bar that is higher (or lower) than a defined number of bars on both sides. Confirmed only after the right-hand bars print without breaking it.Click for full definition →, then frames the chart with reversal bands so you know whether the warning is firing inside a normal pullbackPullback (Retracement)A short, counter-trend move within an established trend — buyers (or sellers) momentarily losing ground before the trend resumes. Often the lowest-risk place to enter the trend.Click for full definition → or at a real exhaustion edge.
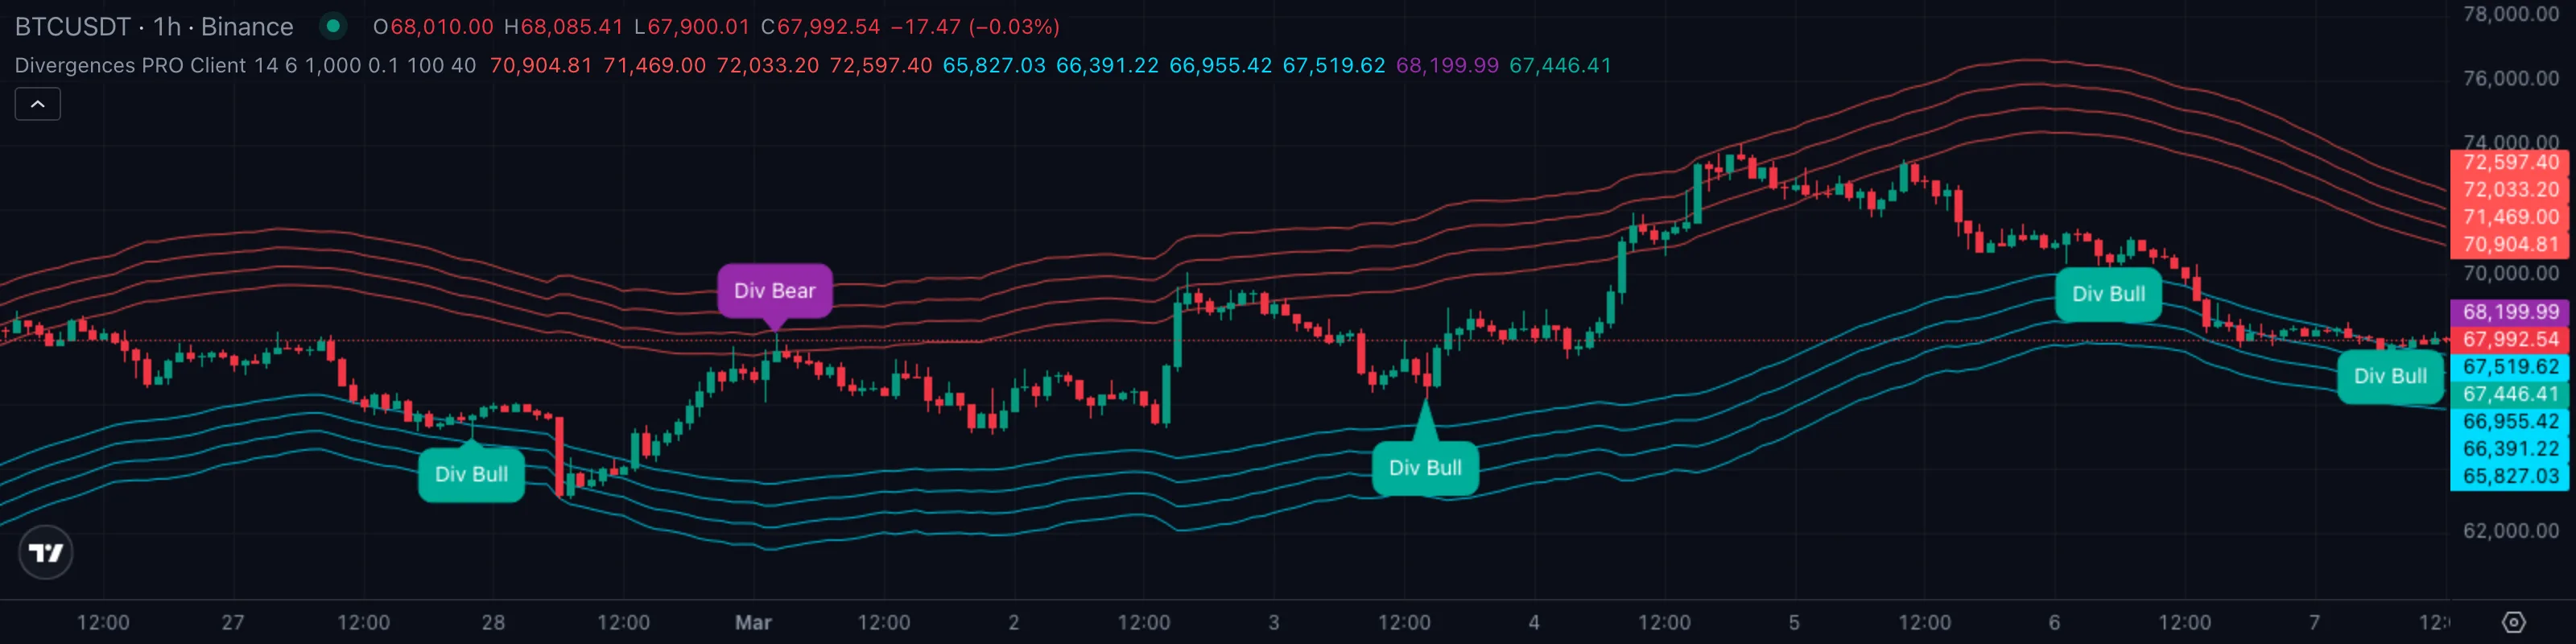
1. What This Indicator Watches For
Most retail traders learn divergenceDivergenceWhen price makes a new extreme but a momentum indicator (RSI, MACD, etc.) does not — a sign that the move is losing internal force even though it's still going.Click for full definition → the hard way. They draw two lines on price, two more on RSIRelative Strength IndexA 0-to-100 momentum oscillator measuring the size of recent up-bars versus down-bars. Above 70 is hot, below 30 is cold, near 50 is neutral.Click for full definition →, decide the slopes disagree, and short the next bar — only to watch the trend grind another 5 % higher because price was nowhere near an actual exhaustion zone. The signal was real. The location was wrong.
There are two separate things you actually need to know in front of any chart that's making a fresh extreme:
- Is momentum quietly fading even though price is still pushing, so the move is running on fumes rather than fresh fuel?
- And if it is, is price even at a meaningful zone yet — somewhere a reversal could realistically pivotPivot High / Pivot LowA bar that is higher (or lower) than a defined number of bars on both sides. Confirmed only after the right-hand bars print without breaking it.Click for full definition → from — or is it still in the middle of nowhere?
DivergencesDivergenceWhen price makes a new extreme but a momentum indicator (RSI, MACD, etc.) does not — a sign that the move is losing internal force even though it's still going.Click for full definition → PRO is built to answer both at a glance. It scans every five-bar pivotPivot High / Pivot LowA bar that is higher (or lower) than a defined number of bars on both sides. Confirmed only after the right-hand bars print without breaking it.Click for full definition → for the four classic divergenceDivergenceWhen price makes a new extreme but a momentum indicator (RSI, MACD, etc.) does not — a sign that the move is losing internal force even though it's still going.Click for full definition → types (regular bullish, regular bearish, hidden bullish, hidden bearish), drops a coloured callout exactly where each one fires, and surrounds price with a four-tier reversal envelope so the divergenceDivergenceWhen price makes a new extreme but a momentum indicator (RSI, MACD, etc.) does not — a sign that the move is losing internal force even though it's still going.Click for full definition →'s location is as readable as the divergenceDivergenceWhen price makes a new extreme but a momentum indicator (RSI, MACD, etc.) does not — a sign that the move is losing internal force even though it's still going.Click for full definition → itself. A regular bearish callout printing on the outermost upper band is a different trade from one printing right at the basis line — same warning, very different odds.
2. How It Works Under the Hood
Two engines run side by side and both contribute to the read:
- The divergenceDivergenceWhen price makes a new extreme but a momentum indicator (RSI, MACD, etc.) does not — a sign that the move is losing internal force even though it's still going.Click for full definition → scanner. The indicator computes RSIRelative Strength IndexA 0-to-100 momentum oscillator measuring the size of recent up-bars versus down-bars. Above 70 is hot, below 30 is cold, near 50 is neutral.Click for full definition → on the bar's high for top scans and RSIRelative Strength IndexA 0-to-100 momentum oscillator measuring the size of recent up-bars versus down-bars. Above 70 is hot, below 30 is cold, near 50 is neutral.Click for full definition → on the bar's low for bottom scans (deliberately not on close — splitting the source improves pivotPivot High / Pivot LowA bar that is higher (or lower) than a defined number of bars on both sides. Confirmed only after the right-hand bars print without breaking it.Click for full definition → accuracy). On each RSIRelative Strength IndexA 0-to-100 momentum oscillator measuring the size of recent up-bars versus down-bars. Above 70 is hot, below 30 is cold, near 50 is neutral.Click for full definition → series it watches a rolling five-bar window and waits for a fractal — a centre bar whose RSIRelative Strength IndexA 0-to-100 momentum oscillator measuring the size of recent up-bars versus down-bars. Above 70 is hot, below 30 is cold, near 50 is neutral.Click for full definition → is higher (or lower) than the two bars on each side of it. Every confirmed fractal is then compared against the previous fractal of the same kind to decide what type of divergenceDivergenceWhen price makes a new extreme but a momentum indicator (RSI, MACD, etc.) does not — a sign that the move is losing internal force even though it's still going.Click for full definition →, if any, just printed.
- The reversal bands. Around price, the indicator draws an SMASimple Moving AverageThe plain arithmetic mean of the last N closing prices. Reacts slower than an EMA of the same length because every bar in the window has equal weight.Click for full definition → basis with eight ATRAverage True RangeA measure of typical bar-to-bar volatility. ATR rises when bars get bigger; many indicators use it as a noise floor — they only fire when a move clears a multiple of ATR.Click for full definition →-scaled rails layered outward — four upper red rails at three, four, five, and six ATRAverage True RangeA measure of typical bar-to-bar volatility. ATR rises when bars get bigger; many indicators use it as a noise floor — they only fire when a move clears a multiple of ATR.Click for full definition → above the basis, and four lower cyan rails at the same multiples below. The outer rails are deliberately wide. They mark the zones where price has historically run out of room before snapping back, not garden-variety pullbackPullback (Retracement)A short, counter-trend move within an established trend — buyers (or sellers) momentarily losing ground before the trend resumes. Often the lowest-risk place to enter the trend.Click for full definition → territory.
How the scanner picks a divergenceDivergenceWhen price makes a new extreme but a momentum indicator (RSI, MACD, etc.) does not — a sign that the move is losing internal force even though it's still going.Click for full definition → type. Every confirmed fractal, the indicator asks two simple questions:
- Did price make a new extreme compared with the previous fractal of the same type? A higher high than the last top, or a lower low than the last bottom, is the price half of every regular setup. The opposite — a lower high than the last top, or a higher low than the last bottom — is the price half of every hidden setup.
- Did RSIRelative Strength IndexA 0-to-100 momentum oscillator measuring the size of recent up-bars versus down-bars. Above 70 is hot, below 30 is cold, near 50 is neutral.Click for full definition → agree or disagree with that price move? When price stretches further but RSIRelative Strength IndexA 0-to-100 momentum oscillator measuring the size of recent up-bars versus down-bars. Above 70 is hot, below 30 is cold, near 50 is neutral.Click for full definition → does not, the move is internally weakening. When price pulls back but RSIRelative Strength IndexA 0-to-100 momentum oscillator measuring the size of recent up-bars versus down-bars. Above 70 is hot, below 30 is cold, near 50 is neutral.Click for full definition → does not, the trend is still loaded underneath.
The four combinations cover every divergenceDivergenceWhen price makes a new extreme but a momentum indicator (RSI, MACD, etc.) does not — a sign that the move is losing internal force even though it's still going.Click for full definition → the indicator can possibly print:
| What you're seeing | Callout | Plain English |
|---|---|---|
| Price prints a higher high, RSIRelative Strength IndexA 0-to-100 momentum oscillator measuring the size of recent up-bars versus down-bars. Above 70 is hot, below 30 is cold, near 50 is neutral.Click for full definition → prints a lower high | 🔴 Regular Bearish | Up move running out of fuel near a top |
| Price prints a lower low, RSIRelative Strength IndexA 0-to-100 momentum oscillator measuring the size of recent up-bars versus down-bars. Above 70 is hot, below 30 is cold, near 50 is neutral.Click for full definition → prints a higher low | 🟢 Regular Bullish | Down move running out of fuel near a bottom |
| Price prints a lower high, RSIRelative Strength IndexA 0-to-100 momentum oscillator measuring the size of recent up-bars versus down-bars. Above 70 is hot, below 30 is cold, near 50 is neutral.Click for full definition → prints a higher high | 🟡 Hidden Bearish | Trend is down, this counter-bounce is weaker than the last |
| Price prints a higher low, RSIRelative Strength IndexA 0-to-100 momentum oscillator measuring the size of recent up-bars versus down-bars. Above 70 is hot, below 30 is cold, near 50 is neutral.Click for full definition → prints a lower low | 🟡 Hidden Bullish | Trend is up, this pullbackPullback (Retracement)A short, counter-trend move within an established trend — buyers (or sellers) momentarily losing ground before the trend resumes. Often the lowest-risk place to enter the trend.Click for full definition → is shallower than the last |
Regular divergencesDivergenceWhen price makes a new extreme but a momentum indicator (RSI, MACD, etc.) does not — a sign that the move is losing internal force even though it's still going.Click for full definition → are reversal warnings. Hidden divergencesDivergenceWhen price makes a new extreme but a momentum indicator (RSI, MACD, etc.) does not — a sign that the move is losing internal force even though it's still going.Click for full definition → are continuation cues — they fire inside an existing trend and tell you the pullbackPullback (Retracement)A short, counter-trend move within an established trend — buyers (or sellers) momentarily losing ground before the trend resumes. Often the lowest-risk place to enter the trend.Click for full definition → you're looking at is the safest re-entry the trend will give you for a while. Out of the box the indicator only shows regular divergencesDivergenceWhen price makes a new extreme but a momentum indicator (RSI, MACD, etc.) does not — a sign that the move is losing internal force even though it's still going.Click for full definition → because they're the loudest signal. Flip the Hidden toggle on once you're comfortable reading both at once.
3. What You See on the Chart
| Element | Looks like | Means |
|---|---|---|
| Outer upper bands | Four thin red rails stacked above price | Reversal zones at three, four, five, and six ATRAverage True RangeA measure of typical bar-to-bar volatility. ATR rises when bars get bigger; many indicators use it as a noise floor — they only fire when a move clears a multiple of ATR.Click for full definition → above the SMASimple Moving AverageThe plain arithmetic mean of the last N closing prices. Reacts slower than an EMA of the same length because every bar in the window has equal weight.Click for full definition → basis |
| Outer lower bands | Four thin cyan rails stacked below price | Reversal zones at three, four, five, and six ATRAverage True RangeA measure of typical bar-to-bar volatility. ATR rises when bars get bigger; many indicators use it as a noise floor — they only fire when a move clears a multiple of ATR.Click for full definition → below the SMASimple Moving AverageThe plain arithmetic mean of the last N closing prices. Reacts slower than an EMA of the same length because every bar in the window has equal weight.Click for full definition → basis |
| Regular Bearish callout | Purple bubble above a swing highSwing High and Swing LowThe most recent confirmed pivot in either direction. Swing highs cap rallies until broken; swing lows support pullbacks until broken.Click for full definition →, tail pointing down | A higher price high paired with a lower RSIRelative Strength IndexA 0-to-100 momentum oscillator measuring the size of recent up-bars versus down-bars. Above 70 is hot, below 30 is cold, near 50 is neutral.Click for full definition → high |
| Regular Bullish callout | Teal bubble below a swing lowSwing High and Swing LowThe most recent confirmed pivot in either direction. Swing highs cap rallies until broken; swing lows support pullbacks until broken.Click for full definition →, tail pointing up | A lower price low paired with a higher RSIRelative Strength IndexA 0-to-100 momentum oscillator measuring the size of recent up-bars versus down-bars. Above 70 is hot, below 30 is cold, near 50 is neutral.Click for full definition → low |
| Hidden Bearish callout | Purple bubble labelled "Hidden Bear" above a lower swing highSwing High and Swing LowThe most recent confirmed pivot in either direction. Swing highs cap rallies until broken; swing lows support pullbacks until broken.Click for full definition → | A trend-down continuation cue — bounce is losing steam |
| Hidden Bullish callout | Teal bubble labelled "Hidden Bull" below a higher swing lowSwing High and Swing LowThe most recent confirmed pivot in either direction. Swing highs cap rallies until broken; swing lows support pullbacks until broken.Click for full definition → | A trend-up continuation cue — pullbackPullback (Retracement)A short, counter-trend move within an established trend — buyers (or sellers) momentarily losing ground before the trend resumes. Often the lowest-risk place to enter the trend.Click for full definition → is losing steam |
| Right-axis bear price tag | A purple price tag on the price scale | The exact high of the most recent regular bearish pivotPivot High / Pivot LowA bar that is higher (or lower) than a defined number of bars on both sides. Confirmed only after the right-hand bars print without breaking it.Click for full definition →, latched on the right edge |
| Right-axis bull price tag | A teal price tag on the price scale | The exact low of the most recent regular bullish pivotPivot High / Pivot LowA bar that is higher (or lower) than a defined number of bars on both sides. Confirmed only after the right-hand bars print without breaking it.Click for full definition →, latched on the right edge |
Default colour scheme: purple for everything bearish, teal for everything bullish, red for the upper reversal rails, cyan for the lower rails. Read the colour first to know the side, then look at where on the band stack the callout printed to know how seriously to take it.
4. Reading It in 3 Patterns
Pattern A — Regular bearish at the top
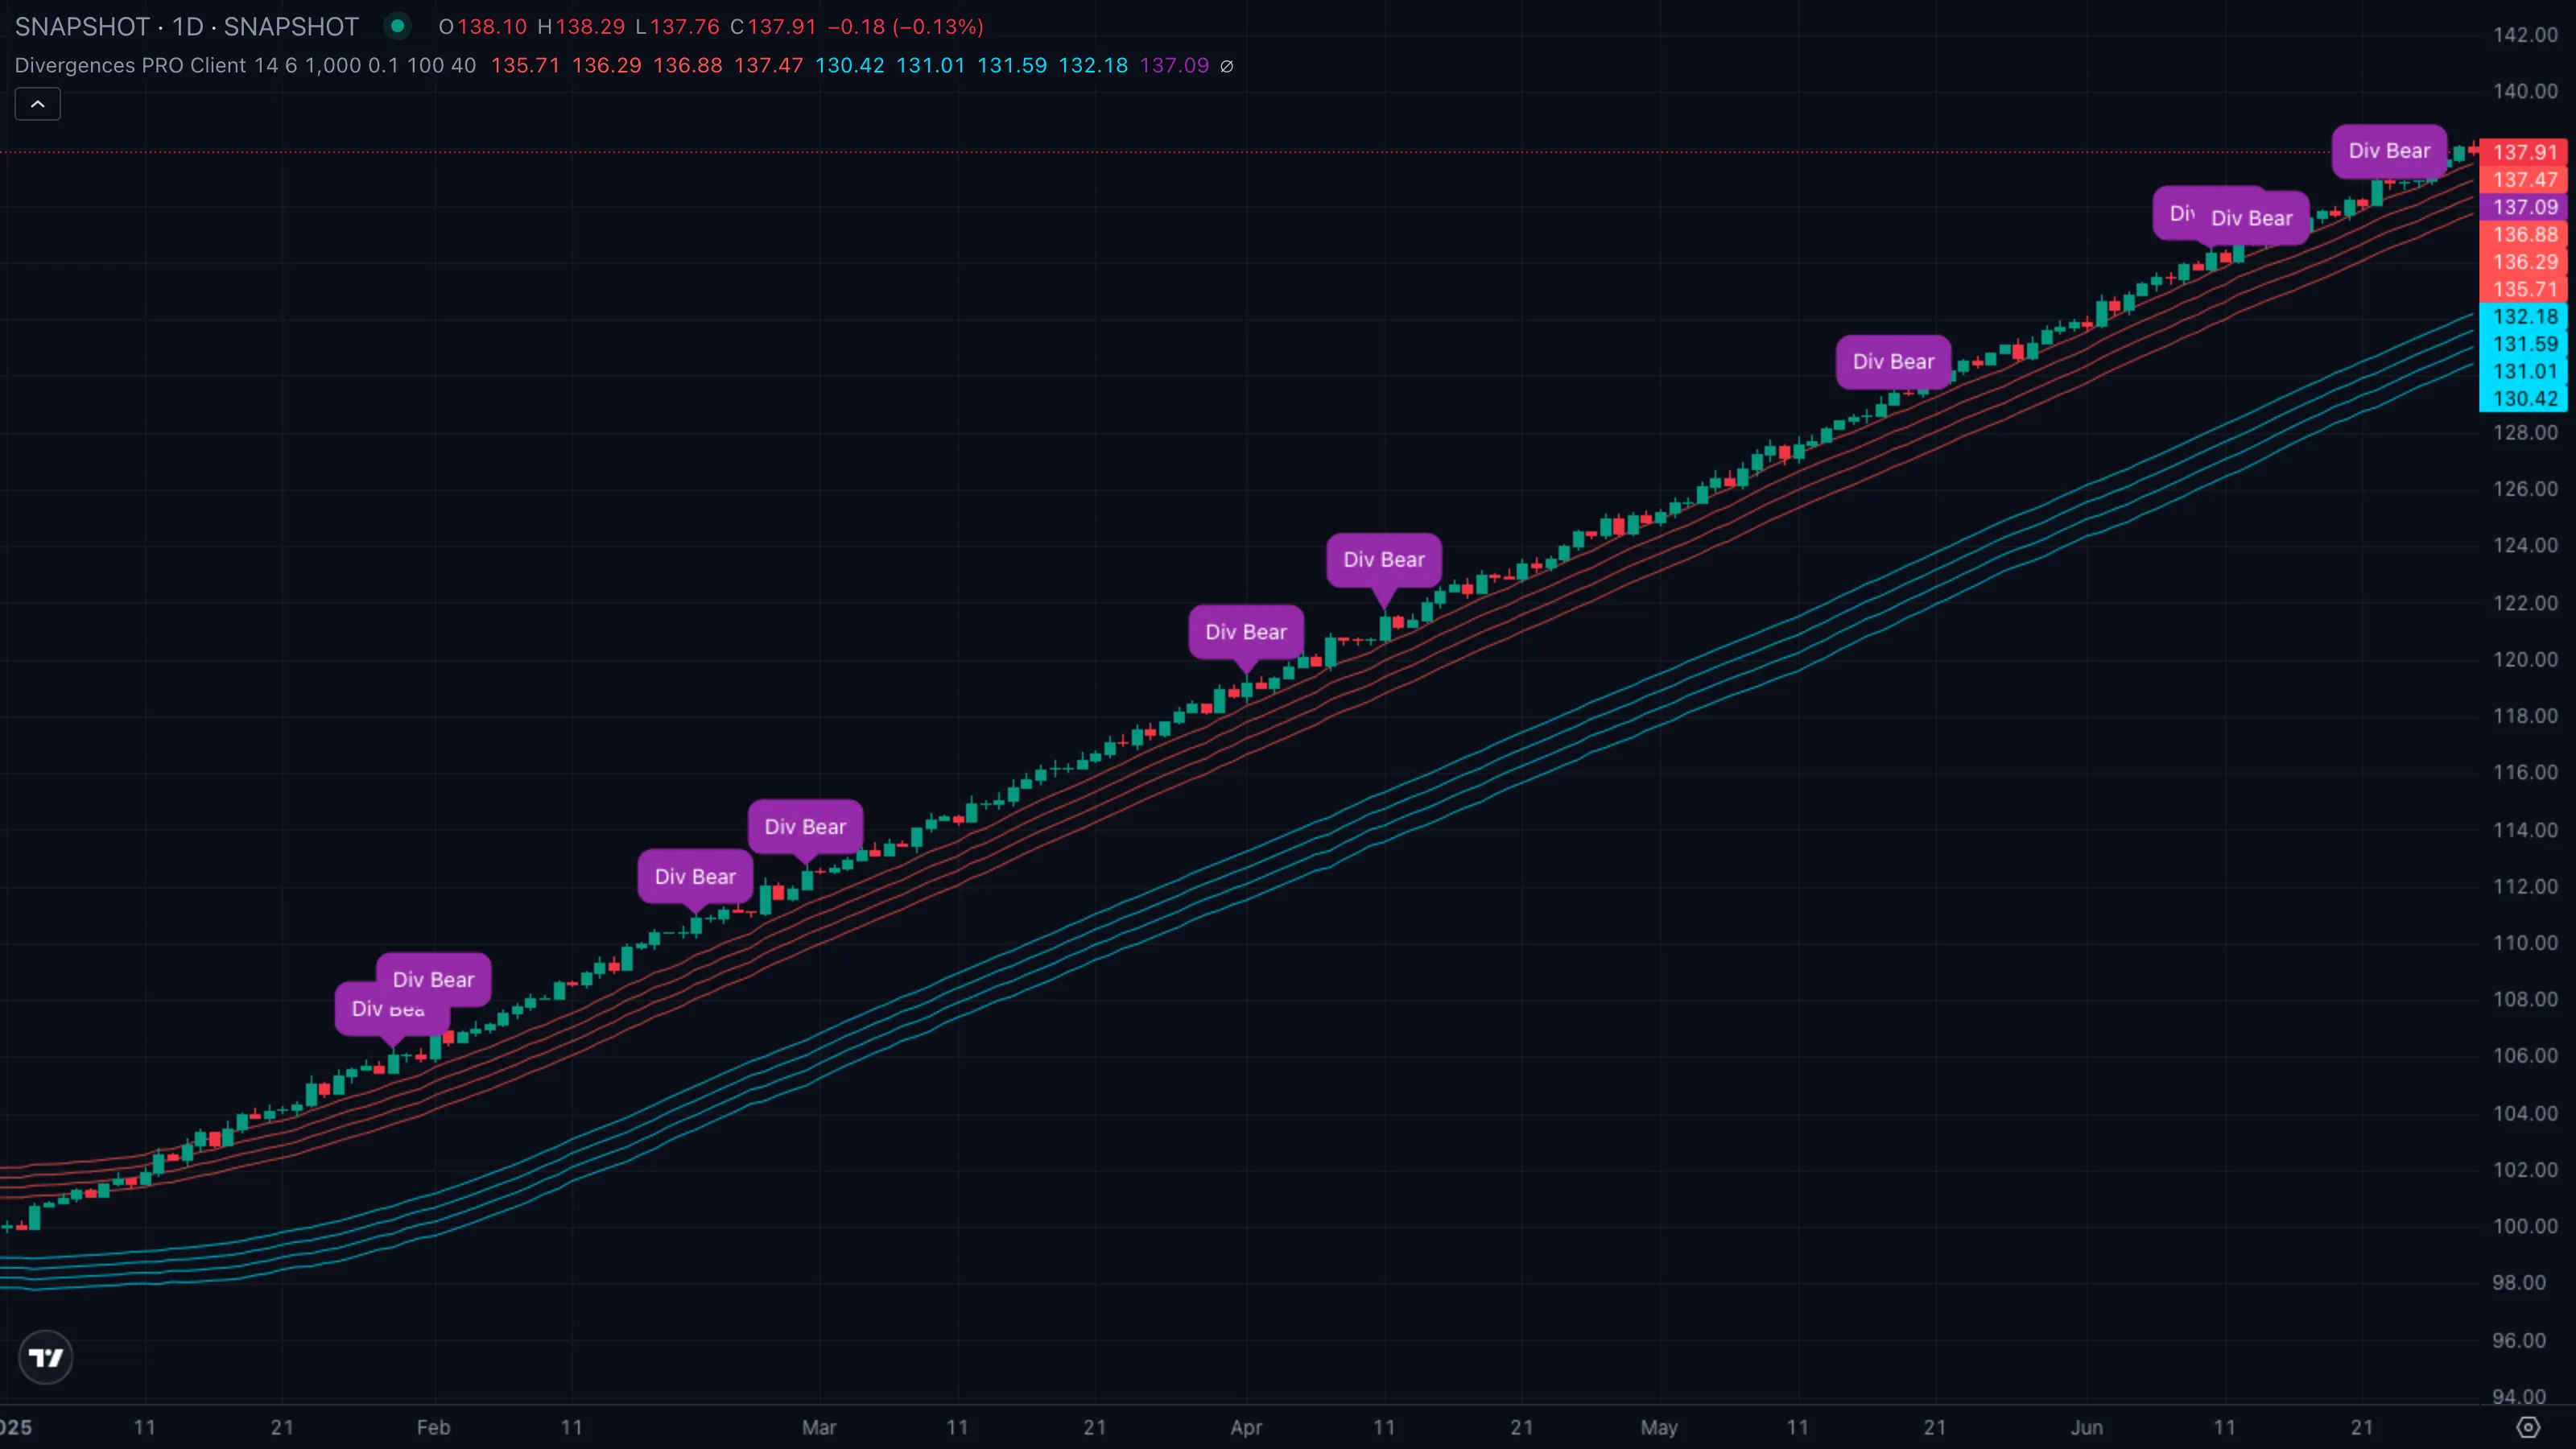
| What you see | ① Price stretches up to tag the third or fourth upper red band ② a purple Div Bear callout prints at the higher swing highSwing High and Swing LowThe most recent confirmed pivot in either direction. Swing highs cap rallies until broken; swing lows support pullbacks until broken.Click for full definition → ③ the right-axis purple tag updates to that high. |
| What it means | The push made a new price high but RSIRelative Strength IndexA 0-to-100 momentum oscillator measuring the size of recent up-bars versus down-bars. Above 70 is hot, below 30 is cold, near 50 is neutral.Click for full definition → didn't — buyers are committing less force at a higher level, and they're doing it in a zone where price has historically run out of room. Both the warning and the location agree. |
| What to do | Lean short, but don't market-sell the callout bar. Wait for a structureMarket StructureThe pattern of swing highs and lows price prints as it moves. Healthy uptrends print higher highs and higher lows; healthy downtrends print the mirror.Click for full definition → break — a close back inside the inner band, or the next swing lowSwing High and Swing LowThe most recent confirmed pivot in either direction. Swing highs cap rallies until broken; swing lows support pullbacks until broken.Click for full definition → taking out the prior one — before sizing in. The callout is the alert, the structureMarket StructureThe pattern of swing highs and lows price prints as it moves. Healthy uptrends print higher highs and higher lows; healthy downtrends print the mirror.Click for full definition → break is the trade. |
Pattern B — Regular bullish at the bottom
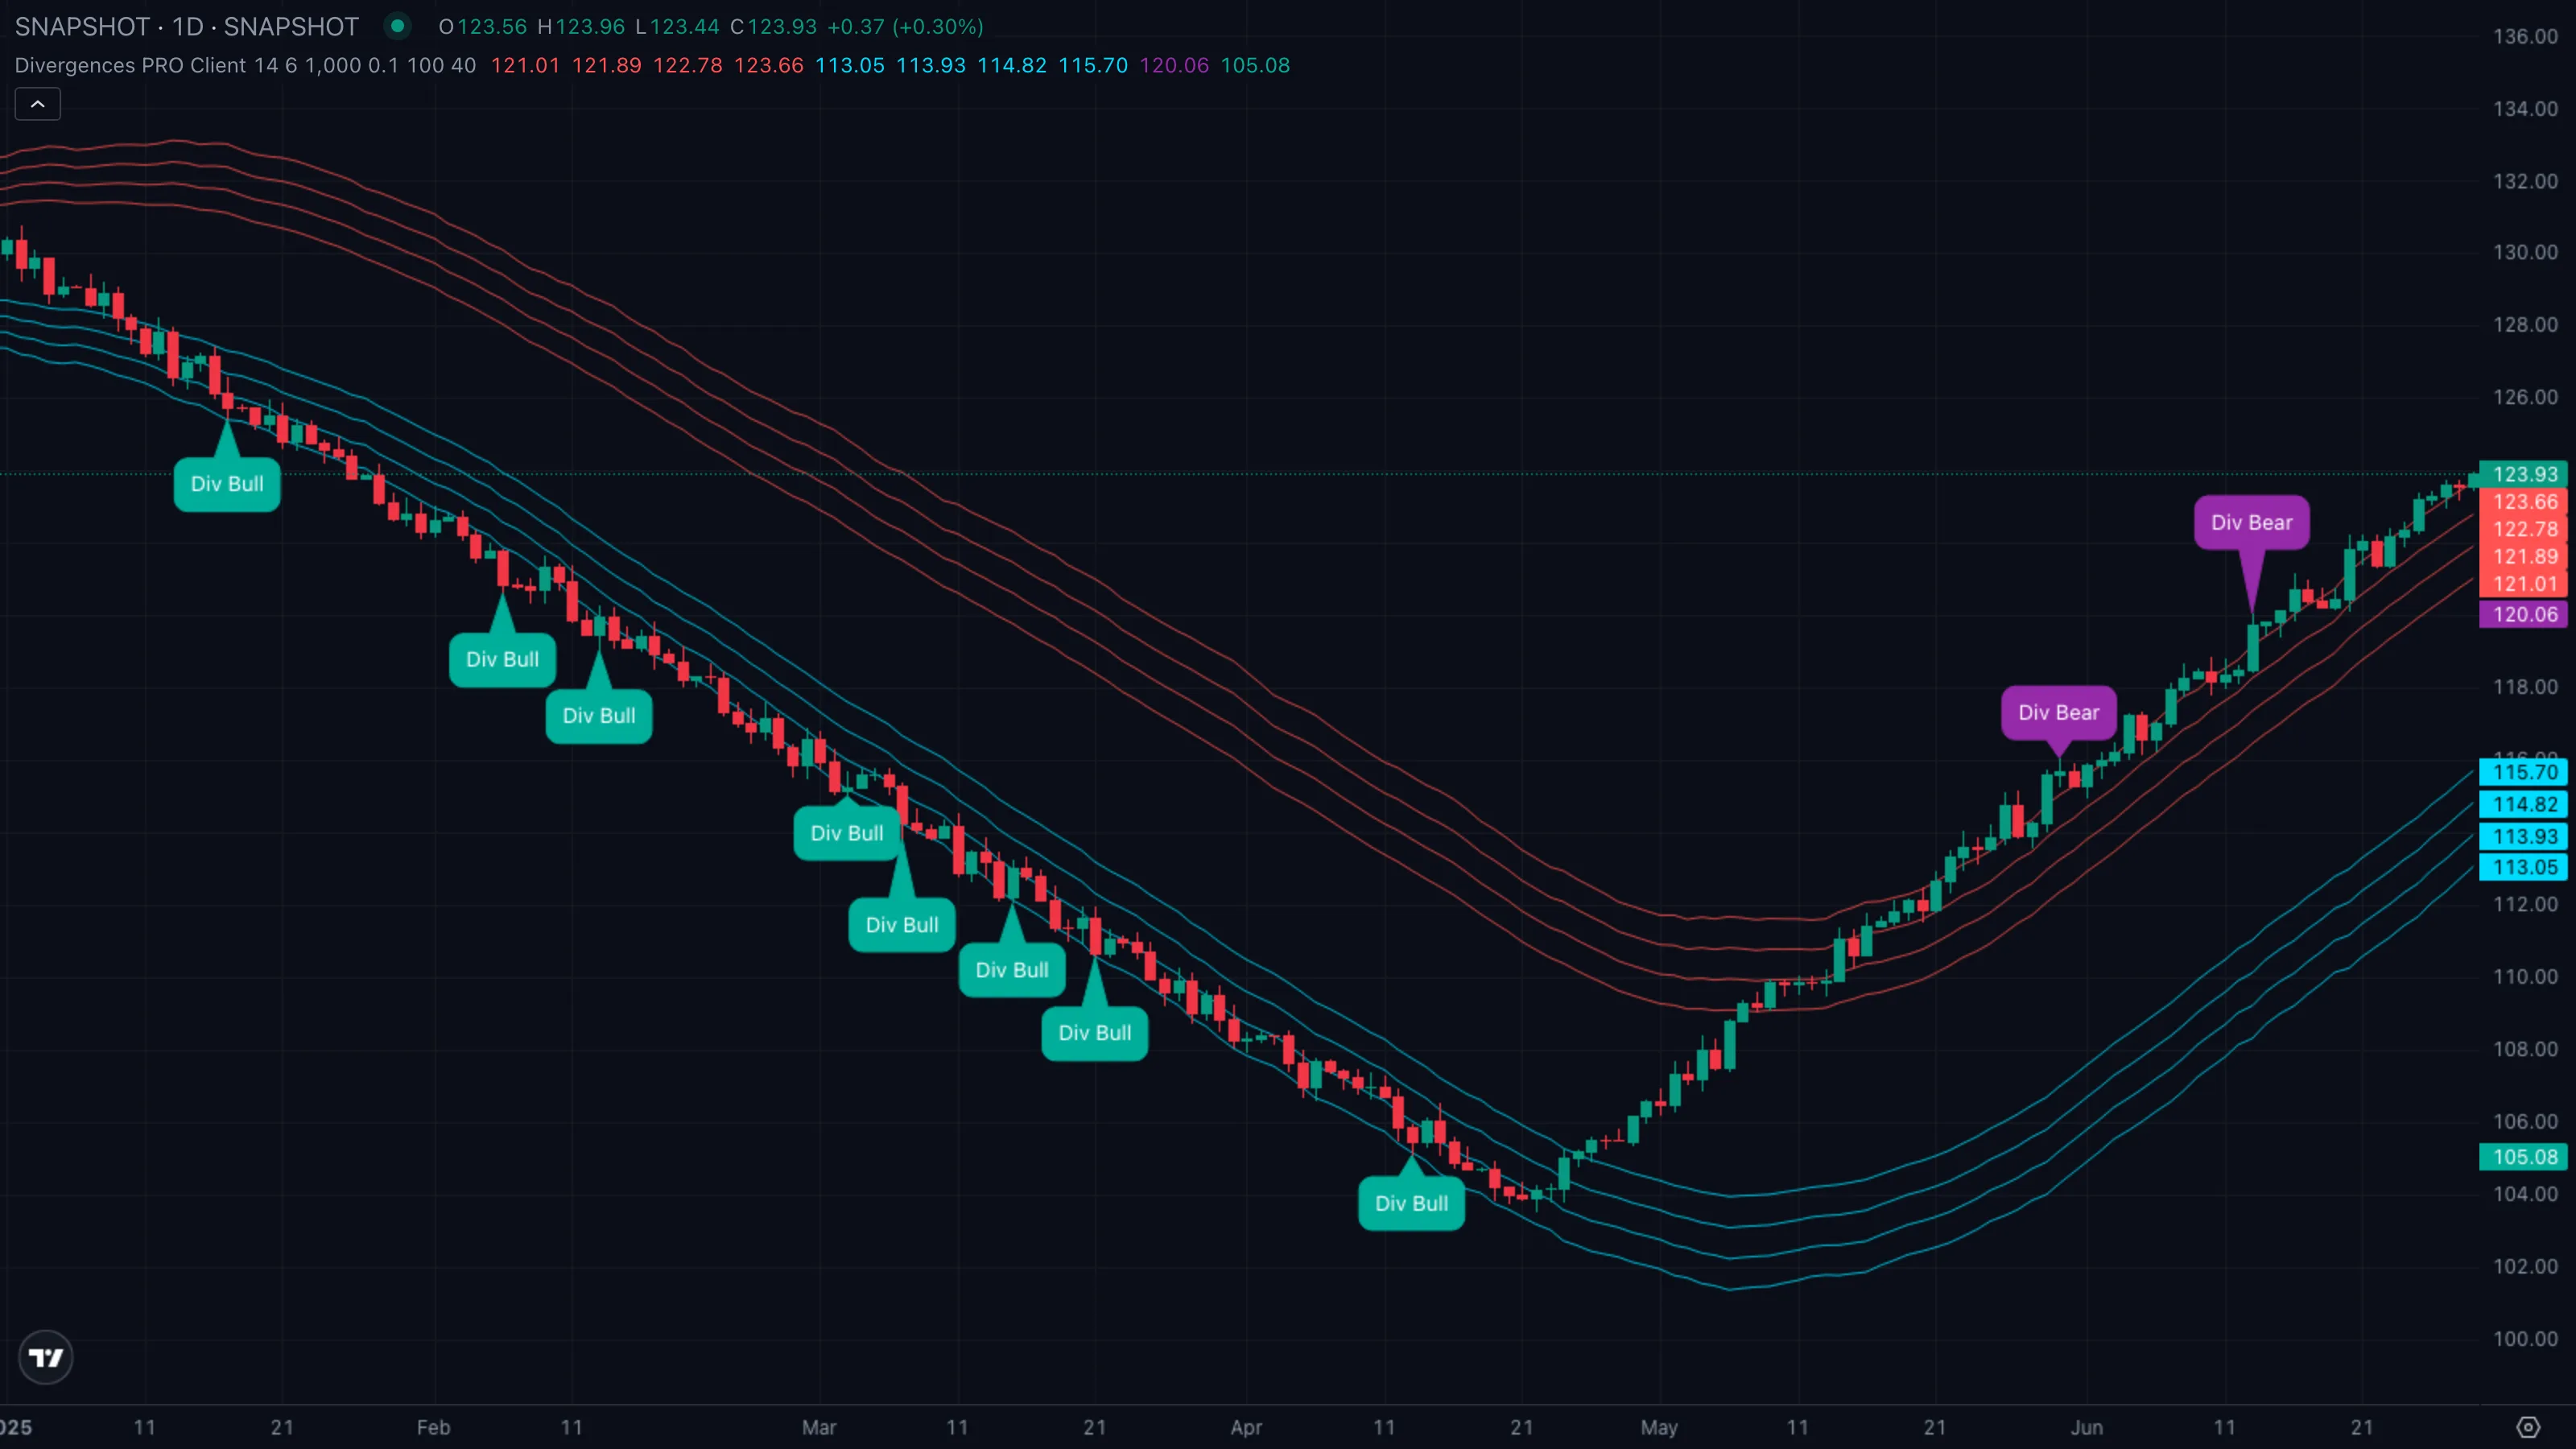
| What you see | ① Price flushes down into the lower cyan rails ② a teal Div Bull callout prints at the lower swing lowSwing High and Swing LowThe most recent confirmed pivot in either direction. Swing highs cap rallies until broken; swing lows support pullbacks until broken.Click for full definition → ③ the right-axis teal tag latches onto that low. |
| What it means | Sellers pushed price further but RSIRelative Strength IndexA 0-to-100 momentum oscillator measuring the size of recent up-bars versus down-bars. Above 70 is hot, below 30 is cold, near 50 is neutral.Click for full definition → refused to follow them — the second leg down is happening on weaker internals than the first. When that fires inside the outer lower bands, the indicator is calling for a probable bounce, not just a pause. |
| What to do | Bias long once price reclaims the inner basis line. Use the callout's price low as the invalidation — if price closes through it on volume, the divergenceDivergenceWhen price makes a new extreme but a momentum indicator (RSI, MACD, etc.) does not — a sign that the move is losing internal force even though it's still going.Click for full definition → has failed and the down move is real. |
Pattern C — Hidden bullish in a trend continuation
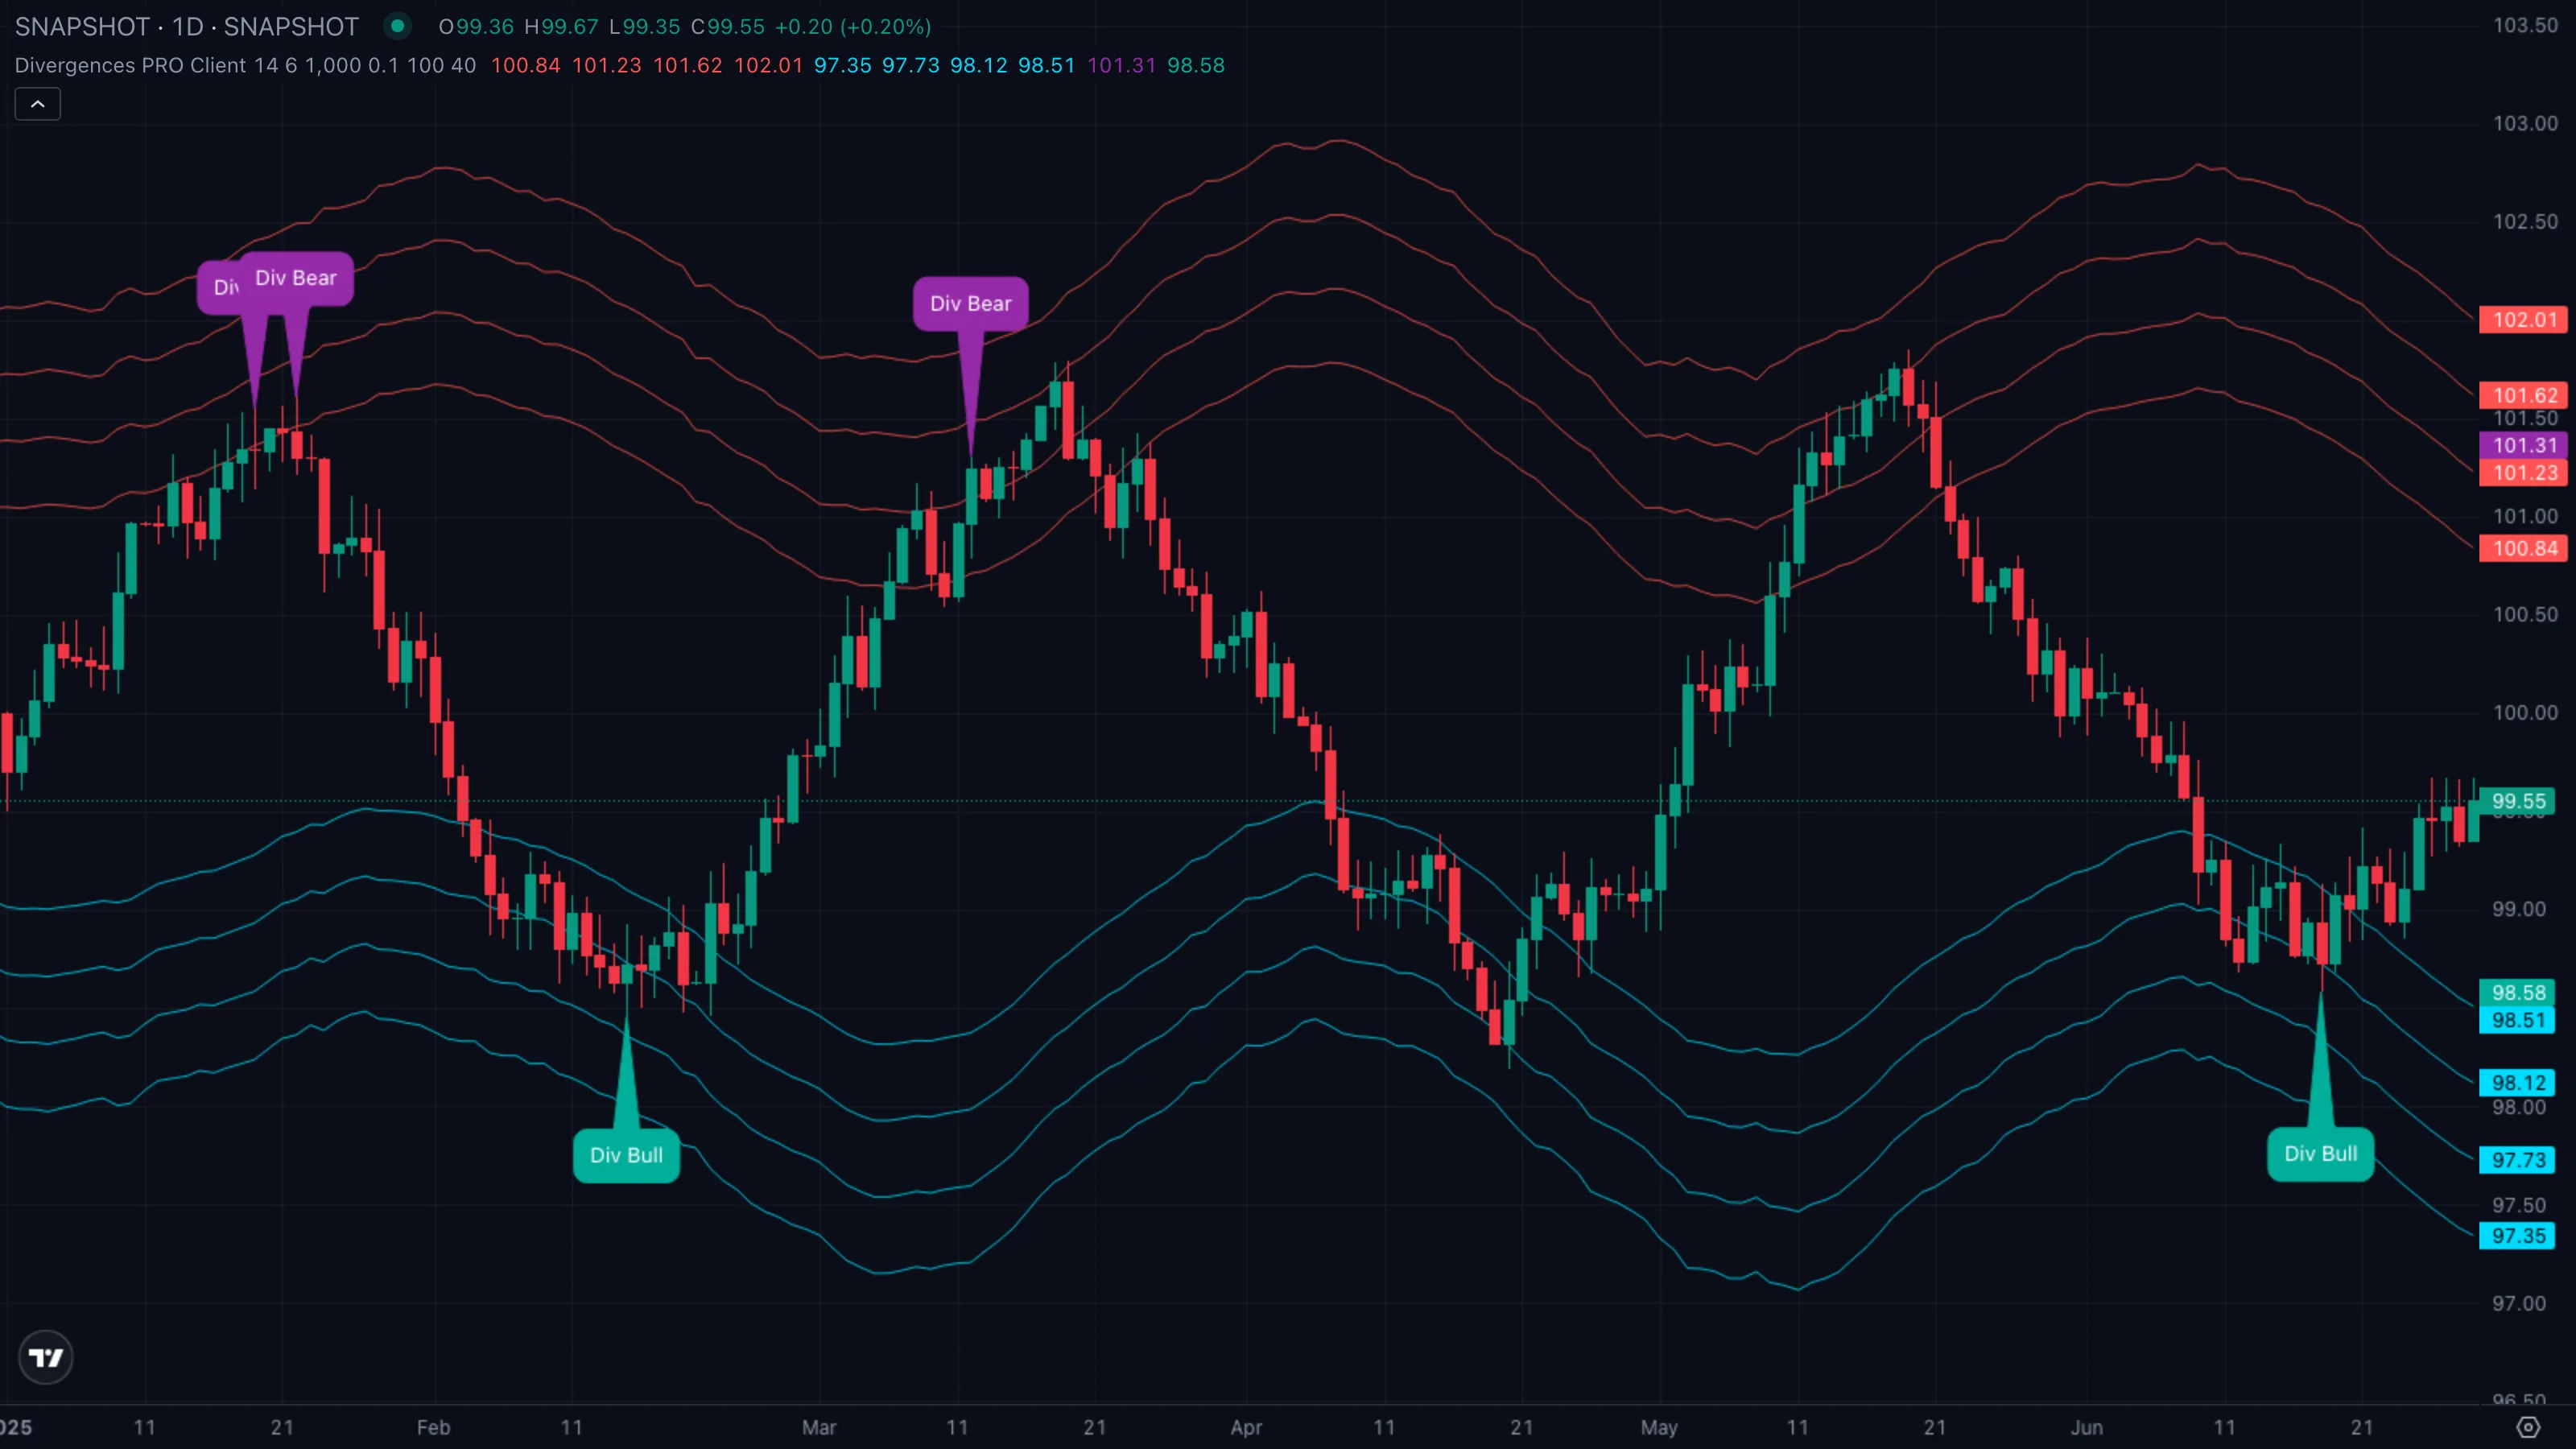
| What you see | ① Price is in a clear uptrend with a recent higher swing lowSwing High and Swing LowThe most recent confirmed pivot in either direction. Swing highs cap rallies until broken; swing lows support pullbacks until broken.Click for full definition → ② a teal Hidden Bull callout prints at that higher low even though RSIRelative Strength IndexA 0-to-100 momentum oscillator measuring the size of recent up-bars versus down-bars. Above 70 is hot, below 30 is cold, near 50 is neutral.Click for full definition → made a lower low ③ the reversal bands are tilting up, not stretched. |
| What it means | The pullbackPullback (Retracement)A short, counter-trend move within an established trend — buyers (or sellers) momentarily losing ground before the trend resumes. Often the lowest-risk place to enter the trend.Click for full definition → shook out enough longs to push RSIRelative Strength IndexA 0-to-100 momentum oscillator measuring the size of recent up-bars versus down-bars. Above 70 is hot, below 30 is cold, near 50 is neutral.Click for full definition → to a fresh low, but price refused to follow it down. That mismatch is the textbook signature of a trend-continuation pullbackPullback (Retracement)A short, counter-trend move within an established trend — buyers (or sellers) momentarily losing ground before the trend resumes. Often the lowest-risk place to enter the trend.Click for full definition → — the dip looks scarier in momentum than it does in price, which is exactly when the trend resumes. |
| What to do | Buy the recovery, not the callout bar. The cleanest entry is the first close back above the prior pullbackPullback (Retracement)A short, counter-trend move within an established trend — buyers (or sellers) momentarily losing ground before the trend resumes. Often the lowest-risk place to enter the trend.Click for full definition →'s high, with a stop just under the hidden-bull pivotPivot High / Pivot LowA bar that is higher (or lower) than a defined number of bars on both sides. Confirmed only after the right-hand bars print without breaking it.Click for full definition →. Hidden divergencesDivergenceWhen price makes a new extreme but a momentum indicator (RSI, MACD, etc.) does not — a sign that the move is losing internal force even though it's still going.Click for full definition → pay best in the middle of an existing trend, not at extremes. |
5. Trade Walkthrough
| Symbol | BTCUSDT |
|---|---|
| Timeframe | 1H |
| Venue | Binance |
| Window | 10 Mar to 22 Mar 2026 |
| Pattern | A — regular bearish at the top |
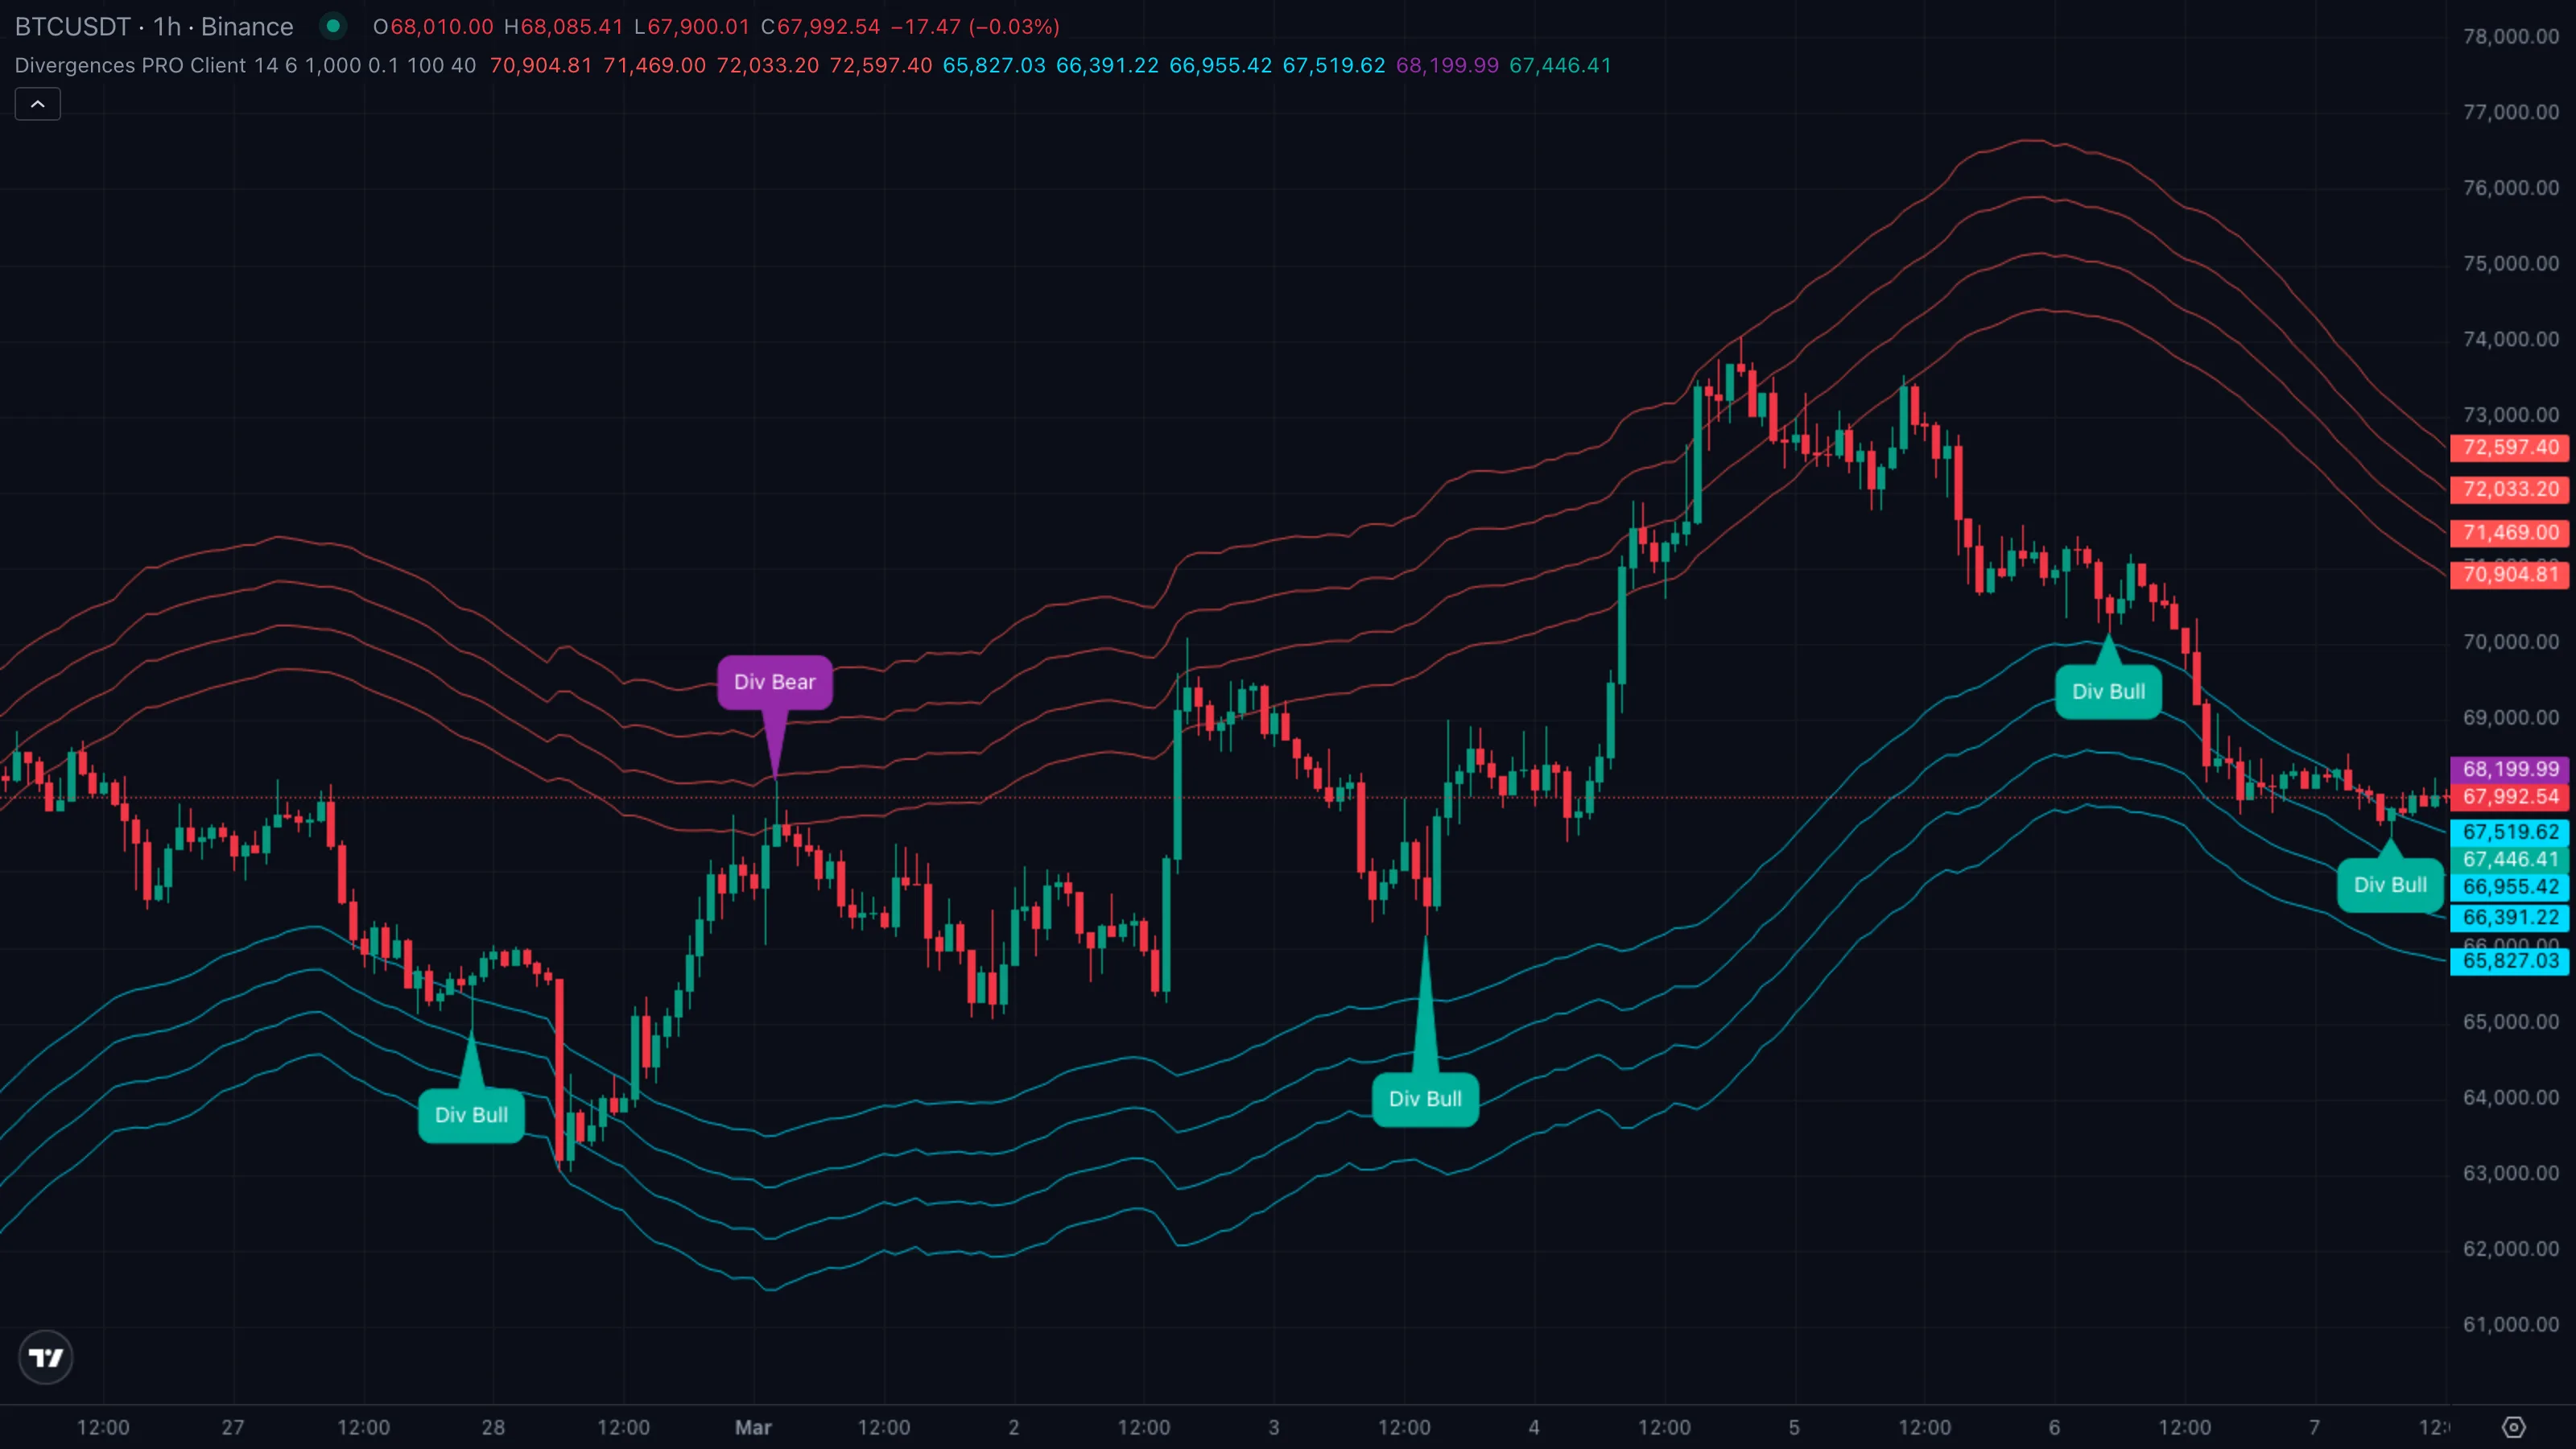
A clean reversal trade. BTC ran from the low 70,000s into the upper reversal bands across the back end of the rally, printed a regular bearish divergenceDivergenceWhen price makes a new extreme but a momentum indicator (RSI, MACD, etc.) does not — a sign that the move is losing internal force even though it's still going.Click for full definition → right where the indicator's outer rail sat, and rolled over for several days. The numbered markers ①–④ on the chart map to the four phases below.
The sequence
| # | When | BTC price | Indicator state | What it tells you |
|---|---|---|---|---|
| ① | 10 Mar to 14 Mar | ~$72,800 drifting to ~$76,200 | basis sloping up, no callouts | Trend up, price still inside the inner bands. No setup yet. |
| ② | 16 Mar | ~$78,400 swing highSwing High and Swing LowThe most recent confirmed pivot in either direction. Swing highs cap rallies until broken; swing lows support pullbacks until broken.Click for full definition → | first higher high, RSIRelative Strength IndexA 0-to-100 momentum oscillator measuring the size of recent up-bars versus down-bars. Above 70 is hot, below 30 is cold, near 50 is neutral.Click for full definition → prints lower high | Regular Bearish callout fires at the third upper red rail — the alert. |
| ③ | 17 Mar | ~$77,100 lower close | callout still latched on right-axis price tag | Price closes back inside the inner band — structureMarket StructureThe pattern of swing highs and lows price prints as it moves. Healthy uptrends print higher highs and higher lows; healthy downtrends print the mirror.Click for full definition → break. The real entry. |
| ④ | 20 Mar | ~$71,200 low | basis turning down, price near lower bands | Move tiring near the lower rails. Cue to take profit before the next test. |
The trade in one card
| What you skipped | Market-shorting the Div Bear callout bar at 78,400 — the chase trade. Price spiked another half percent before rolling, would have been stopped out. |
| What you took | Short on the close back inside the inner band at ~$77,100, with the callout's high as a hard invalidation. |
| Where you exited | Price approaching the lower rails near $71,200 with the basis turning down. |
| Move captured | ~ +7.6 % short in roughly four days. |
Lesson
The regular bearish callout at the outer band gives you the alert. The first close back inside the inner band gives you the trade. Price reaching the lower reversal rails tells you when the move is mature and it's time to step out.
6. Common Pitfalls
- Treating every callout as a trade. The indicator fires on every qualifying fractal and shows ghost callouts even when the bars-between or price-change filter would normally suppress them. Most callouts are noise — only the ones that print at the outer reversal bands, or that line up with a structureMarket StructureThe pattern of swing highs and lows price prints as it moves. Healthy uptrends print higher highs and higher lows; healthy downtrends print the mirror.Click for full definition → break on the next handful of bars, are real setups.
- Shorting a regular bearish in the middle of the bands. A purple callout that prints right next to the SMASimple Moving AverageThe plain arithmetic mean of the last N closing prices. Reacts slower than an EMA of the same length because every bar in the window has equal weight.Click for full definition → basis is almost meaningless — there's no exhaustion to fade, the move just paused. The same callout out at the third or fourth upper rail is a different signal entirely. Location is half the read.
- Confusing hidden with regular. Hidden divergencesDivergenceWhen price makes a new extreme but a momentum indicator (RSI, MACD, etc.) does not — a sign that the move is losing internal force even though it's still going.Click for full definition → point with the trend, not against it. A hidden bullish callout in a downtrend means the bounce is failing, not that the bottom is in. Read the surrounding bands' slope before deciding which side the callout is actually arguing for.
- Forgetting that RSIRelative Strength IndexA 0-to-100 momentum oscillator measuring the size of recent up-bars versus down-bars. Above 70 is hot, below 30 is cold, near 50 is neutral.Click for full definition → uses high and low, not close. This indicator computes RSIRelative Strength IndexA 0-to-100 momentum oscillator measuring the size of recent up-bars versus down-bars. Above 70 is hot, below 30 is cold, near 50 is neutral.Click for full definition → on the bar's high for top scans and on the bar's low for bottom scans. That's why callouts sometimes fire on bars where a close-based RSIRelative Strength IndexA 0-to-100 momentum oscillator measuring the size of recent up-bars versus down-bars. Above 70 is hot, below 30 is cold, near 50 is neutral.Click for full definition → on TradingView would not show divergenceDivergenceWhen price makes a new extreme but a momentum indicator (RSI, MACD, etc.) does not — a sign that the move is losing internal force even though it's still going.Click for full definition →. The two readings are not supposed to match.
- Trading divergenceDivergenceWhen price makes a new extreme but a momentum indicator (RSI, MACD, etc.) does not — a sign that the move is losing internal force even though it's still going.Click for full definition → alone. DivergenceDivergenceWhen price makes a new extreme but a momentum indicator (RSI, MACD, etc.) does not — a sign that the move is losing internal force even though it's still going.Click for full definition → is always a heads-up, never a signal on its own. Pair every regular bearish callout with a confirmation — the next bar's close, a structureMarket StructureThe pattern of swing highs and lows price prints as it moves. Healthy uptrends print higher highs and higher lows; healthy downtrends print the mirror.Click for full definition → break, a flip on a separate trend tool — before sizing into the trade. The callout is the tap on the shoulder; the confirmation is the green light.