

Impulse Targets
A pattern detector that watches for the classic thrust-plus-pullbackPullback (Retracement)A short, counter-trend move within an established trend — buyers (or sellers) momentarily losing ground before the trend resumes. Often the lowest-risk place to enter the trend.Click for full definition → rhythm and projects the price ladder the next leg is likely to hit.
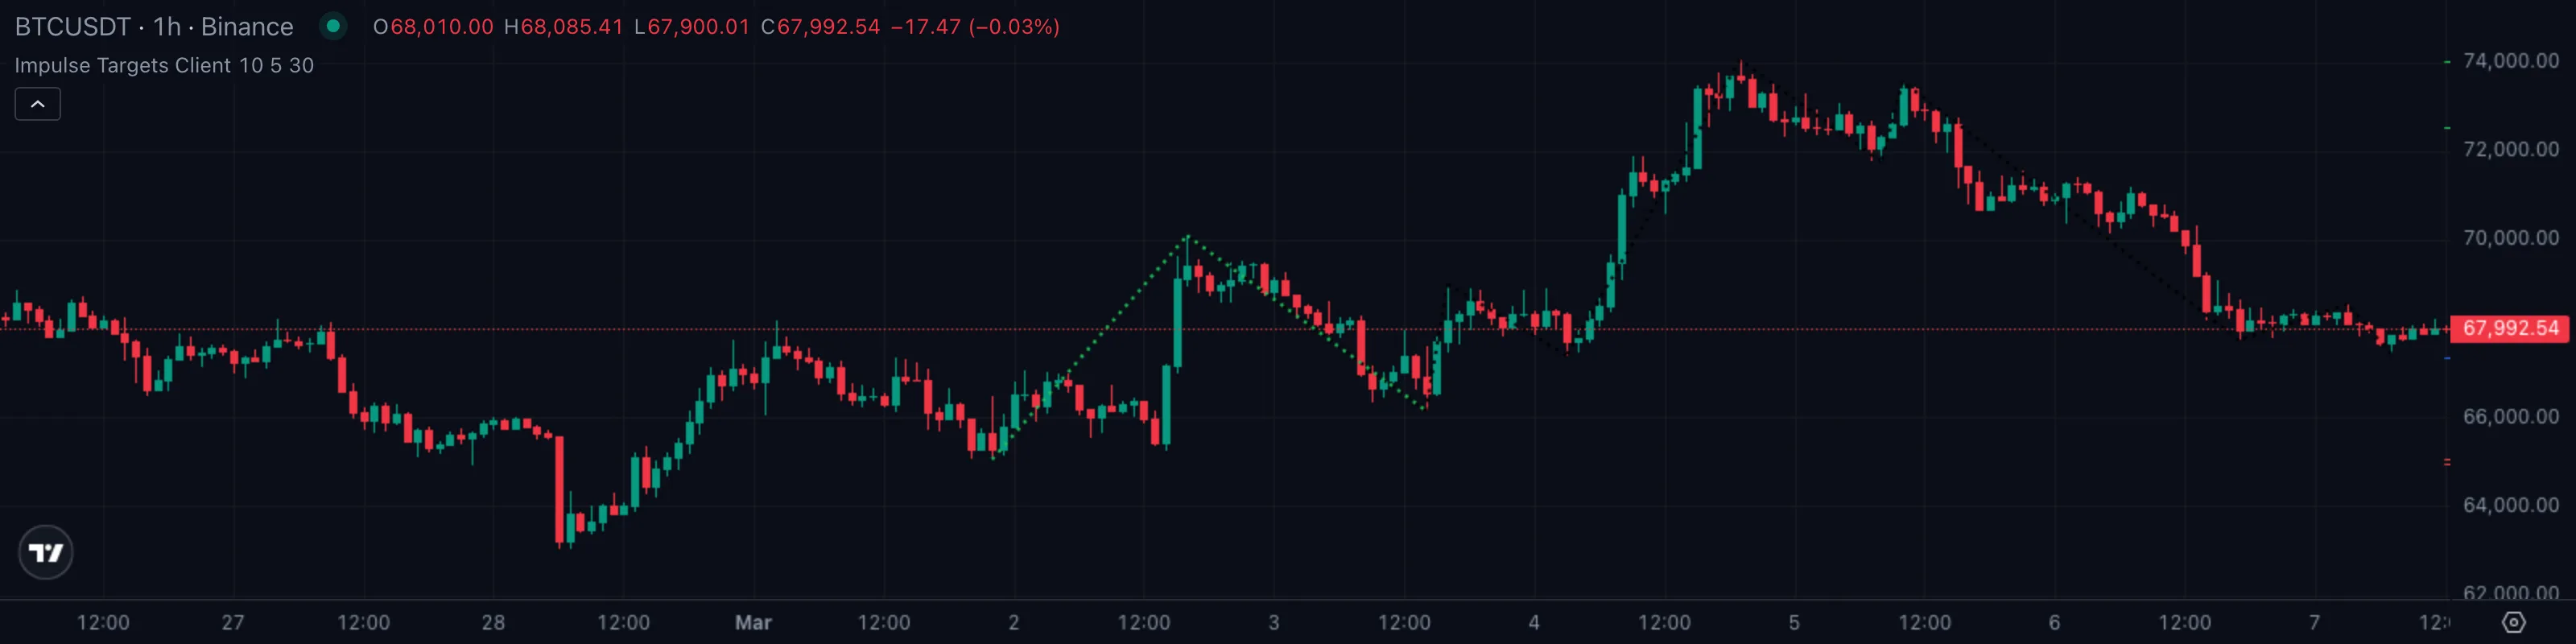
1. What This Indicator Watches For
Most strong moves don't go in a straight line. Price thrusts in one direction, takes a breather as profit-takers push back, then resumes — and the second leg often travels a measurable multiple of the first. Most textbook continuation setups (Elliott waves, ABC retracementsPullback (Retracement)A short, counter-trend move within an established trend — buyers (or sellers) momentarily losing ground before the trend resumes. Often the lowest-risk place to enter the trend.Click for full definition →, breakout-pullbackPullback (Retracement)A short, counter-trend move within an established trend — buyers (or sellers) momentarily losing ground before the trend resumes. Often the lowest-risk place to enter the trend.Click for full definition →-go) describe slightly different flavours of the same idea.
The trouble for a discretionary trader is twofold. Recognition — was that pullbackPullback (Retracement)A short, counter-trend move within an established trend — buyers (or sellers) momentarily losing ground before the trend resumes. Often the lowest-risk place to enter the trend.Click for full definition → deep enough to be a real pullbackPullback (Retracement)A short, counter-trend move within an established trend — buyers (or sellers) momentarily losing ground before the trend resumes. Often the lowest-risk place to enter the trend.Click for full definition →, or has the trend already broken? Eyeballing it across hundreds of charts a day is exhausting and inconsistent. Targeting — once you've decided to take the trade, where do you actually take profit? Picking levels by feel leaves money on the table on big moves and gives back winners on small ones.
Impulse Targets does both jobs at once. It scans for a thrust whose pullbackPullback (Retracement)A short, counter-trend move within an established trend — buyers (or sellers) momentarily losing ground before the trend resumes. Often the lowest-risk place to enter the trend.Click for full definition → retraces by a textbook amount, then — only when the geometry holds up — paints a complete trade plan onto the chart: a defined entry zone, a stop, a trailing-stop reference, and four extension targets stacked beyond at the classic FibonacciFibonacci Retracement and ExtensionPullback depths (50, 61.8, 76.4 %) and projection multiples (1.618, 2.0, 2.618 of an initial leg) used to gauge whether retraces are healthy and to project realistic targets.Click for full definition → multiples of the original thrust.
2. How It Works Under the Hood
Three engines run in series. The first finds the swings, the second labels them, the third decides whether they fit the pattern.
- The pivotsPivot High / Pivot LowA bar that is higher (or lower) than a defined number of bars on both sides. Confirmed only after the right-hand bars print without breaking it.Click for full definition →. A running high pivotPivot High / Pivot LowA bar that is higher (or lower) than a defined number of bars on both sides. Confirmed only after the right-hand bars print without breaking it.Click for full definition → fires whenever the current bar is the highest of the last
zigzagLengthbars (default 10); the same logic, mirrored, fires a low pivotPivot High / Pivot LowA bar that is higher (or lower) than a defined number of bars on both sides. Confirmed only after the right-hand bars print without breaking it.Click for full definition →. Same-direction pivotsPivot High / Pivot LowA bar that is higher (or lower) than a defined number of bars on both sides. Confirmed only after the right-hand bars print without breaking it.Click for full definition → back-to-back collapse into the more extreme one, so the chart only ever shows the meaningful turns. - The zigzag. The last ten pivotsPivot High / Pivot LowA bar that is higher (or lower) than a defined number of bars on both sides. Confirmed only after the right-hand bars print without breaking it.Click for full definition → are kept in memory with a directional tag — regular for an ordinary turn, confirmed wave for a turn that beats the previous same-side pivotPivot High / Pivot LowA bar that is higher (or lower) than a defined number of bars on both sides. Confirmed only after the right-hand bars print without breaking it.Click for full definition → (a fresh higher high or lower low). The dotted line connecting them is the zigzag you see on the chart.
- The pattern check. Every bar, the engine looks at the last three confirmed pivotsPivot High / Pivot LowA bar that is higher (or lower) than a defined number of bars on both sides. Confirmed only after the right-hand bars print without breaking it.Click for full definition → — call them Point 0, Point 1, Point 2 — and asks two questions before drawing anything.
How Impulse Targets picks a setup. Two plain-English questions decide whether the level ladder appears.
- Did the pullbackPullback (Retracement)A short, counter-trend move within an established trend — buyers (or sellers) momentarily losing ground before the trend resumes. Often the lowest-risk place to enter the trend.Click for full definition → retrace by a textbook amount? The distance from Point 1 back to Point 2 is compared with the original thrust from Point 0 to Point 1. The pullbackPullback (Retracement)A short, counter-trend move within an established trend — buyers (or sellers) momentarily losing ground before the trend resumes. Often the lowest-risk place to enter the trend.Click for full definition → must land within ±5 % of one of the four classic retracementPullback (Retracement)A short, counter-trend move within an established trend — buyers (or sellers) momentarily losing ground before the trend resumes. Often the lowest-risk place to enter the trend.Click for full definition → depths (50 %, 61.8 %, 76.4 %, 85.4 %). Anything shallower or deeper is rejected.
- Are the swings pointing the right way? Point 1 must be a confirmed wave (a fresh extreme), Point 2 a regular pivotPivot High / Pivot LowA bar that is higher (or lower) than a defined number of bars on both sides. Confirmed only after the right-hand bars print without breaking it.Click for full definition → in the opposite direction. In plain English a fresh impulse high followed by an ordinary pullbackPullback (Retracement)A short, counter-trend move within an established trend — buyers (or sellers) momentarily losing ground before the trend resumes. Often the lowest-risk place to enter the trend.Click for full definition → low for bullish setups, the mirror for bearish.
If both pass, the engine commits to a level set. If not, no levels are drawn and the chart shows just the zigzag.
| What the engine sees | Output | Plain English |
|---|---|---|
| Three swings line up, pullbackPullback (Retracement)A short, counter-trend move within an established trend — buyers (or sellers) momentarily losing ground before the trend resumes. Often the lowest-risk place to enter the trend.Click for full definition → in the textbook zone | 🟢 Levels drawn | A clean impulse with a healthy pullbackPullback (Retracement)A short, counter-trend move within an established trend — buyers (or sellers) momentarily losing ground before the trend resumes. Often the lowest-risk place to enter the trend.Click for full definition →. Trade plan is on the chart |
| PullbackPullback (Retracement)A short, counter-trend move within an established trend — buyers (or sellers) momentarily losing ground before the trend resumes. Often the lowest-risk place to enter the trend.Click for full definition → too shallow or too deep, swings ambiguous | 🟡 Zigzag only | The market is moving but it isn't yet a textbook setup. Wait |
| Trend rolls over, the impulse direction is broken | 🔴 Levels invalidated | Setup is dead. Stop has either been hit or is no longer relevant |
The five-percent tolerance is the whole reason Impulse Targets stays disciplined. Without it, every shallow noise dip would qualify as a retracementPullback (Retracement)A short, counter-trend move within an established trend — buyers (or sellers) momentarily losing ground before the trend resumes. Often the lowest-risk place to enter the trend.Click for full definition → and the chart would flood with stale level ladders.
3. What You See on the Chart
| Element | Looks like | Means |
|---|---|---|
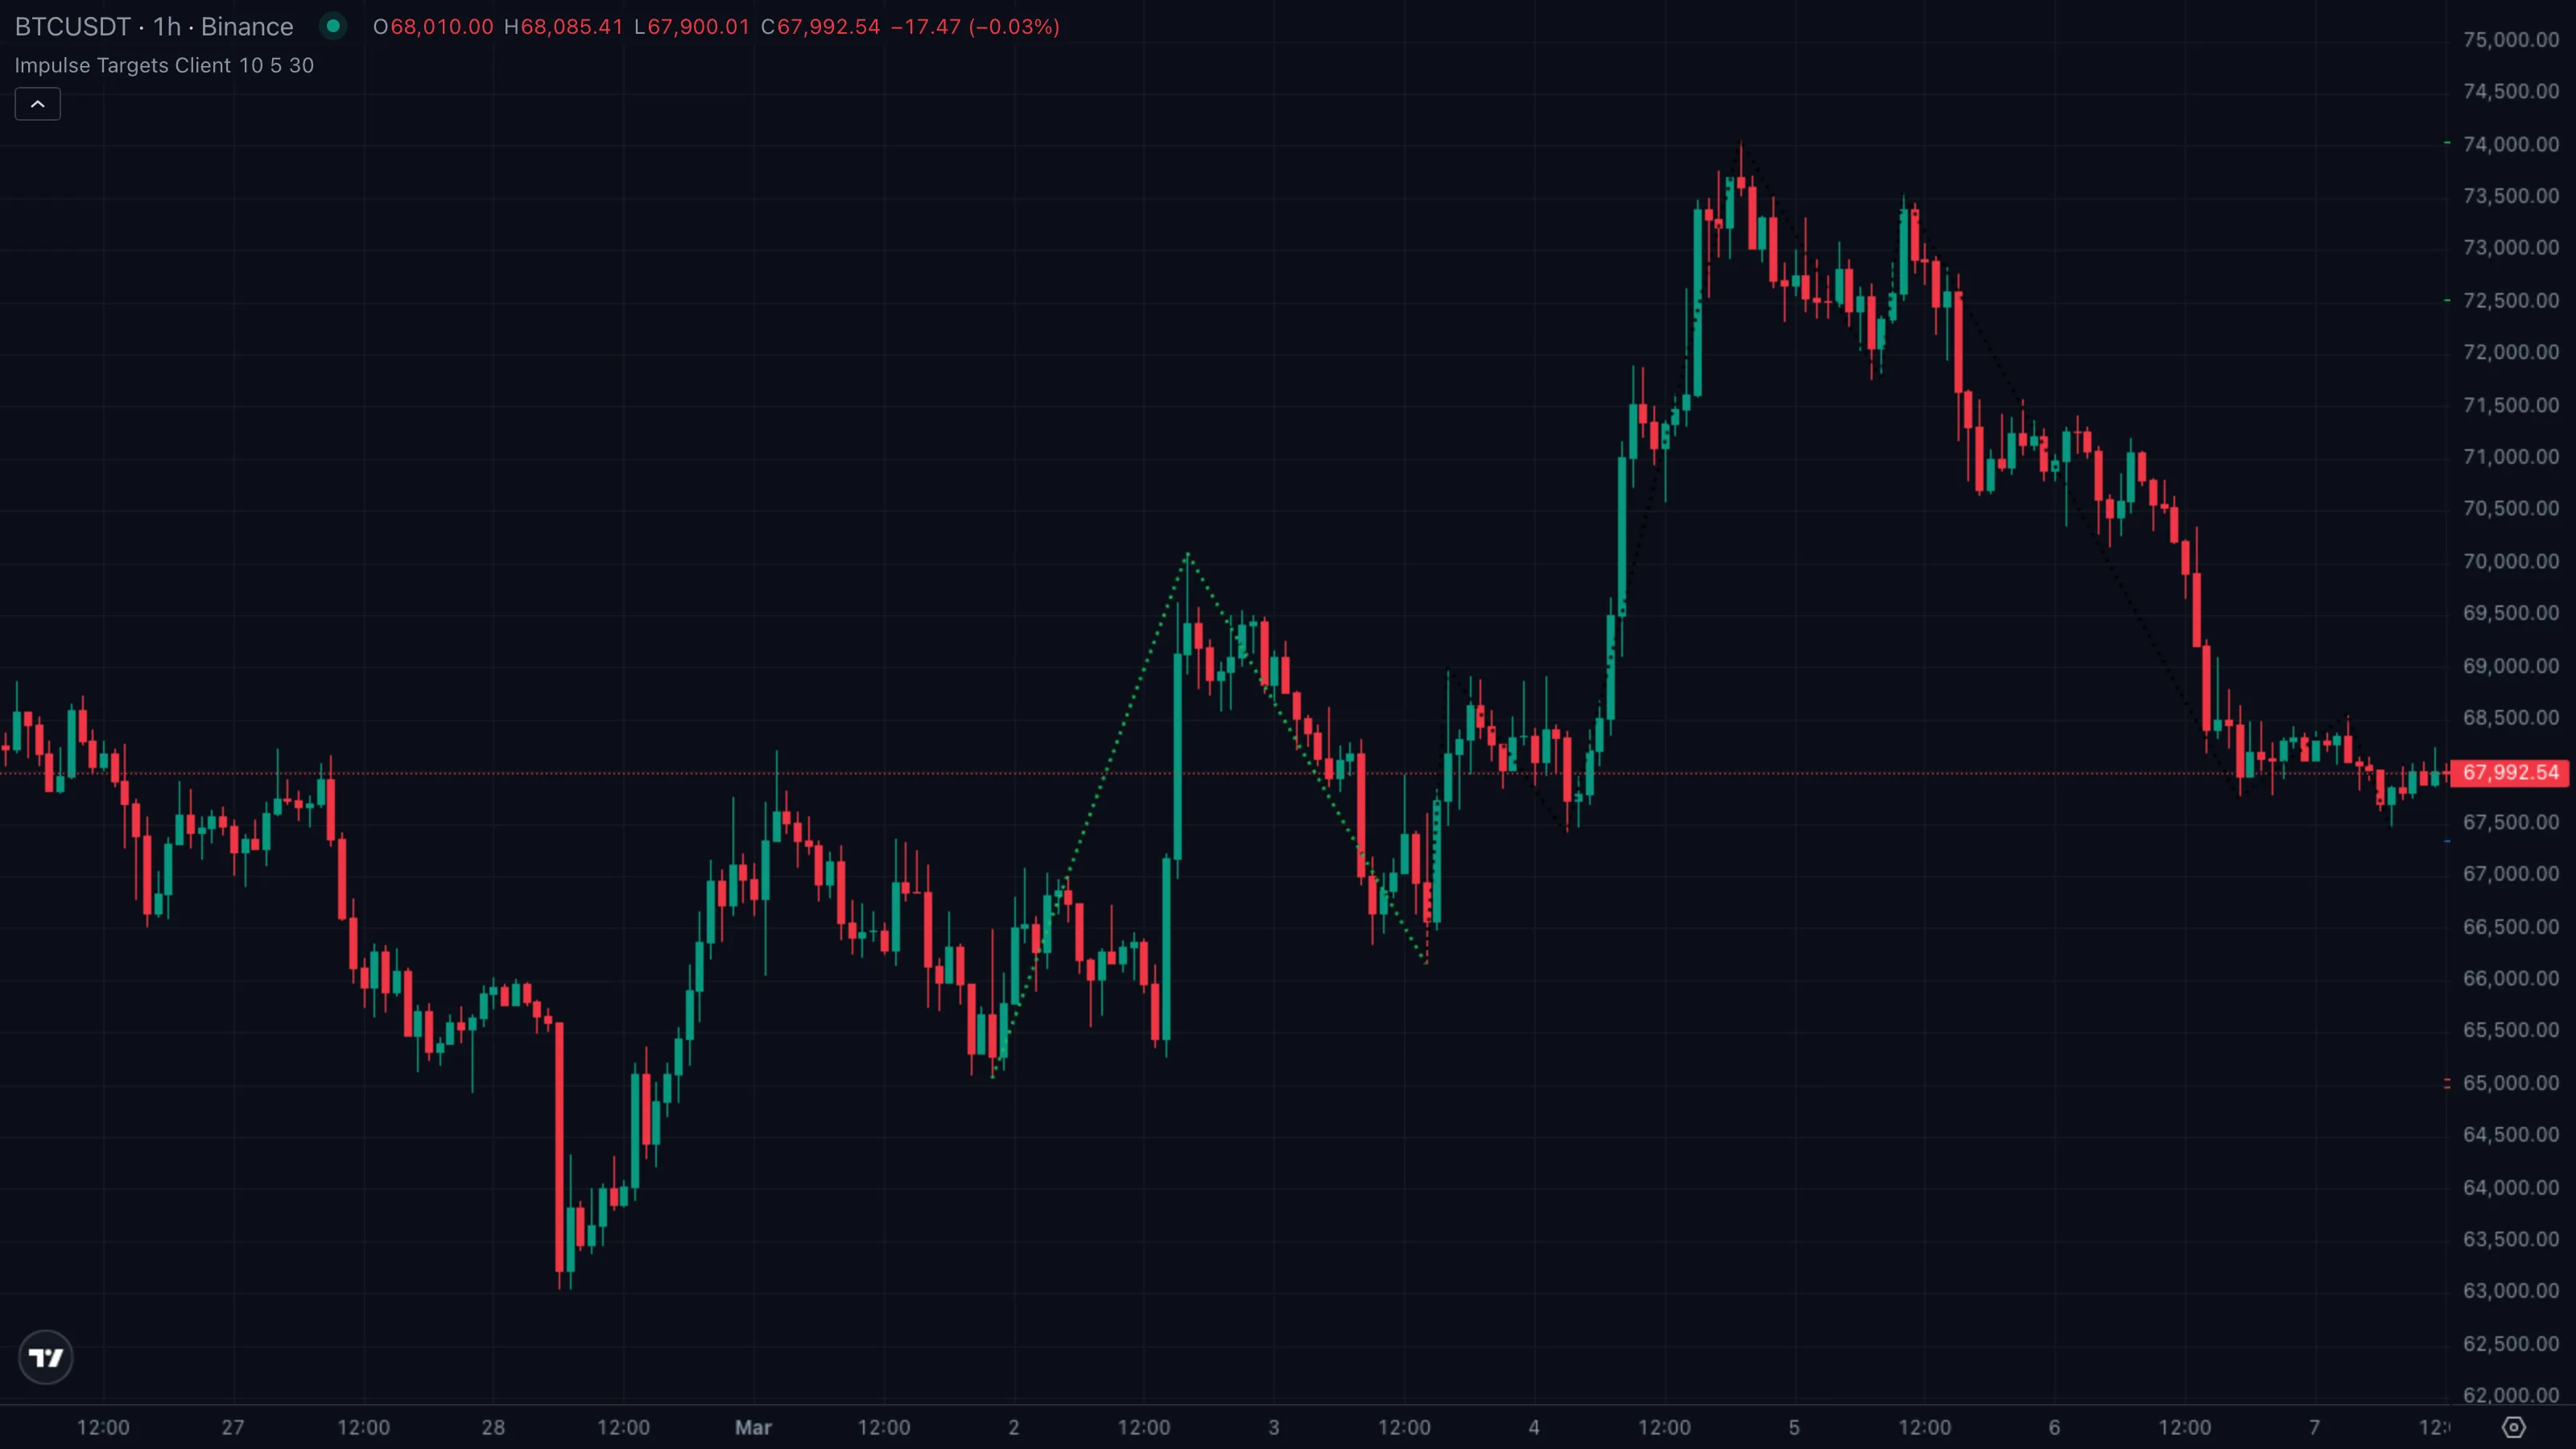
| Zigzag pivotsPivot High / Pivot LowA bar that is higher (or lower) than a defined number of bars on both sides. Confirmed only after the right-hand bars print without breaking it.Click for full definition → | Black dotted segments connecting recent swings | The structural turns the engine has identified |
| W1 segment | Coloured dotted line from Point 0 to Point 1 | The thrust leg, green if pointing up, red if pointing down |
| W2 segment | Same colour dotted line from Point 1 to Point 2 | The pullbackPullback (Retracement)A short, counter-trend move within an established trend — buyers (or sellers) momentarily losing ground before the trend resumes. Often the lowest-risk place to enter the trend.Click for full definition → leg, ending at the proposed entry zone |
| Entry line | Blue solid line with the price label | Where the trade is supposed to be initiated |
| Stop line | Red on bullish setups, green on bearish | Hard invalidation level, anchoredAnchored VWAPA VWAP that begins at a chosen pivot bar (a swing high or swing low) and runs forward. Anchoring makes the absolute level meaningful instead of drifting with whatever bars happen to load.Click for full definition → at Point 0 |
| T.Stop line | Same colour as Stop, sits beyond Entry | A tighter trailing-stop reference for active management |
| Target 1 to Target 4 | Four solid lines stacked beyond entry | Profit ladders at 1.618, 2.0, 2.618, 3.236 multiples of the pullbackPullback (Retracement)A short, counter-trend move within an established trend — buyers (or sellers) momentarily losing ground before the trend resumes. Often the lowest-risk place to enter the trend.Click for full definition → |
Stop is always coloured opposite to targets so a glance tells you which way the trade is biased.
4. Reading It in 3 Patterns
Pattern A — Impulse triggers, targets hit
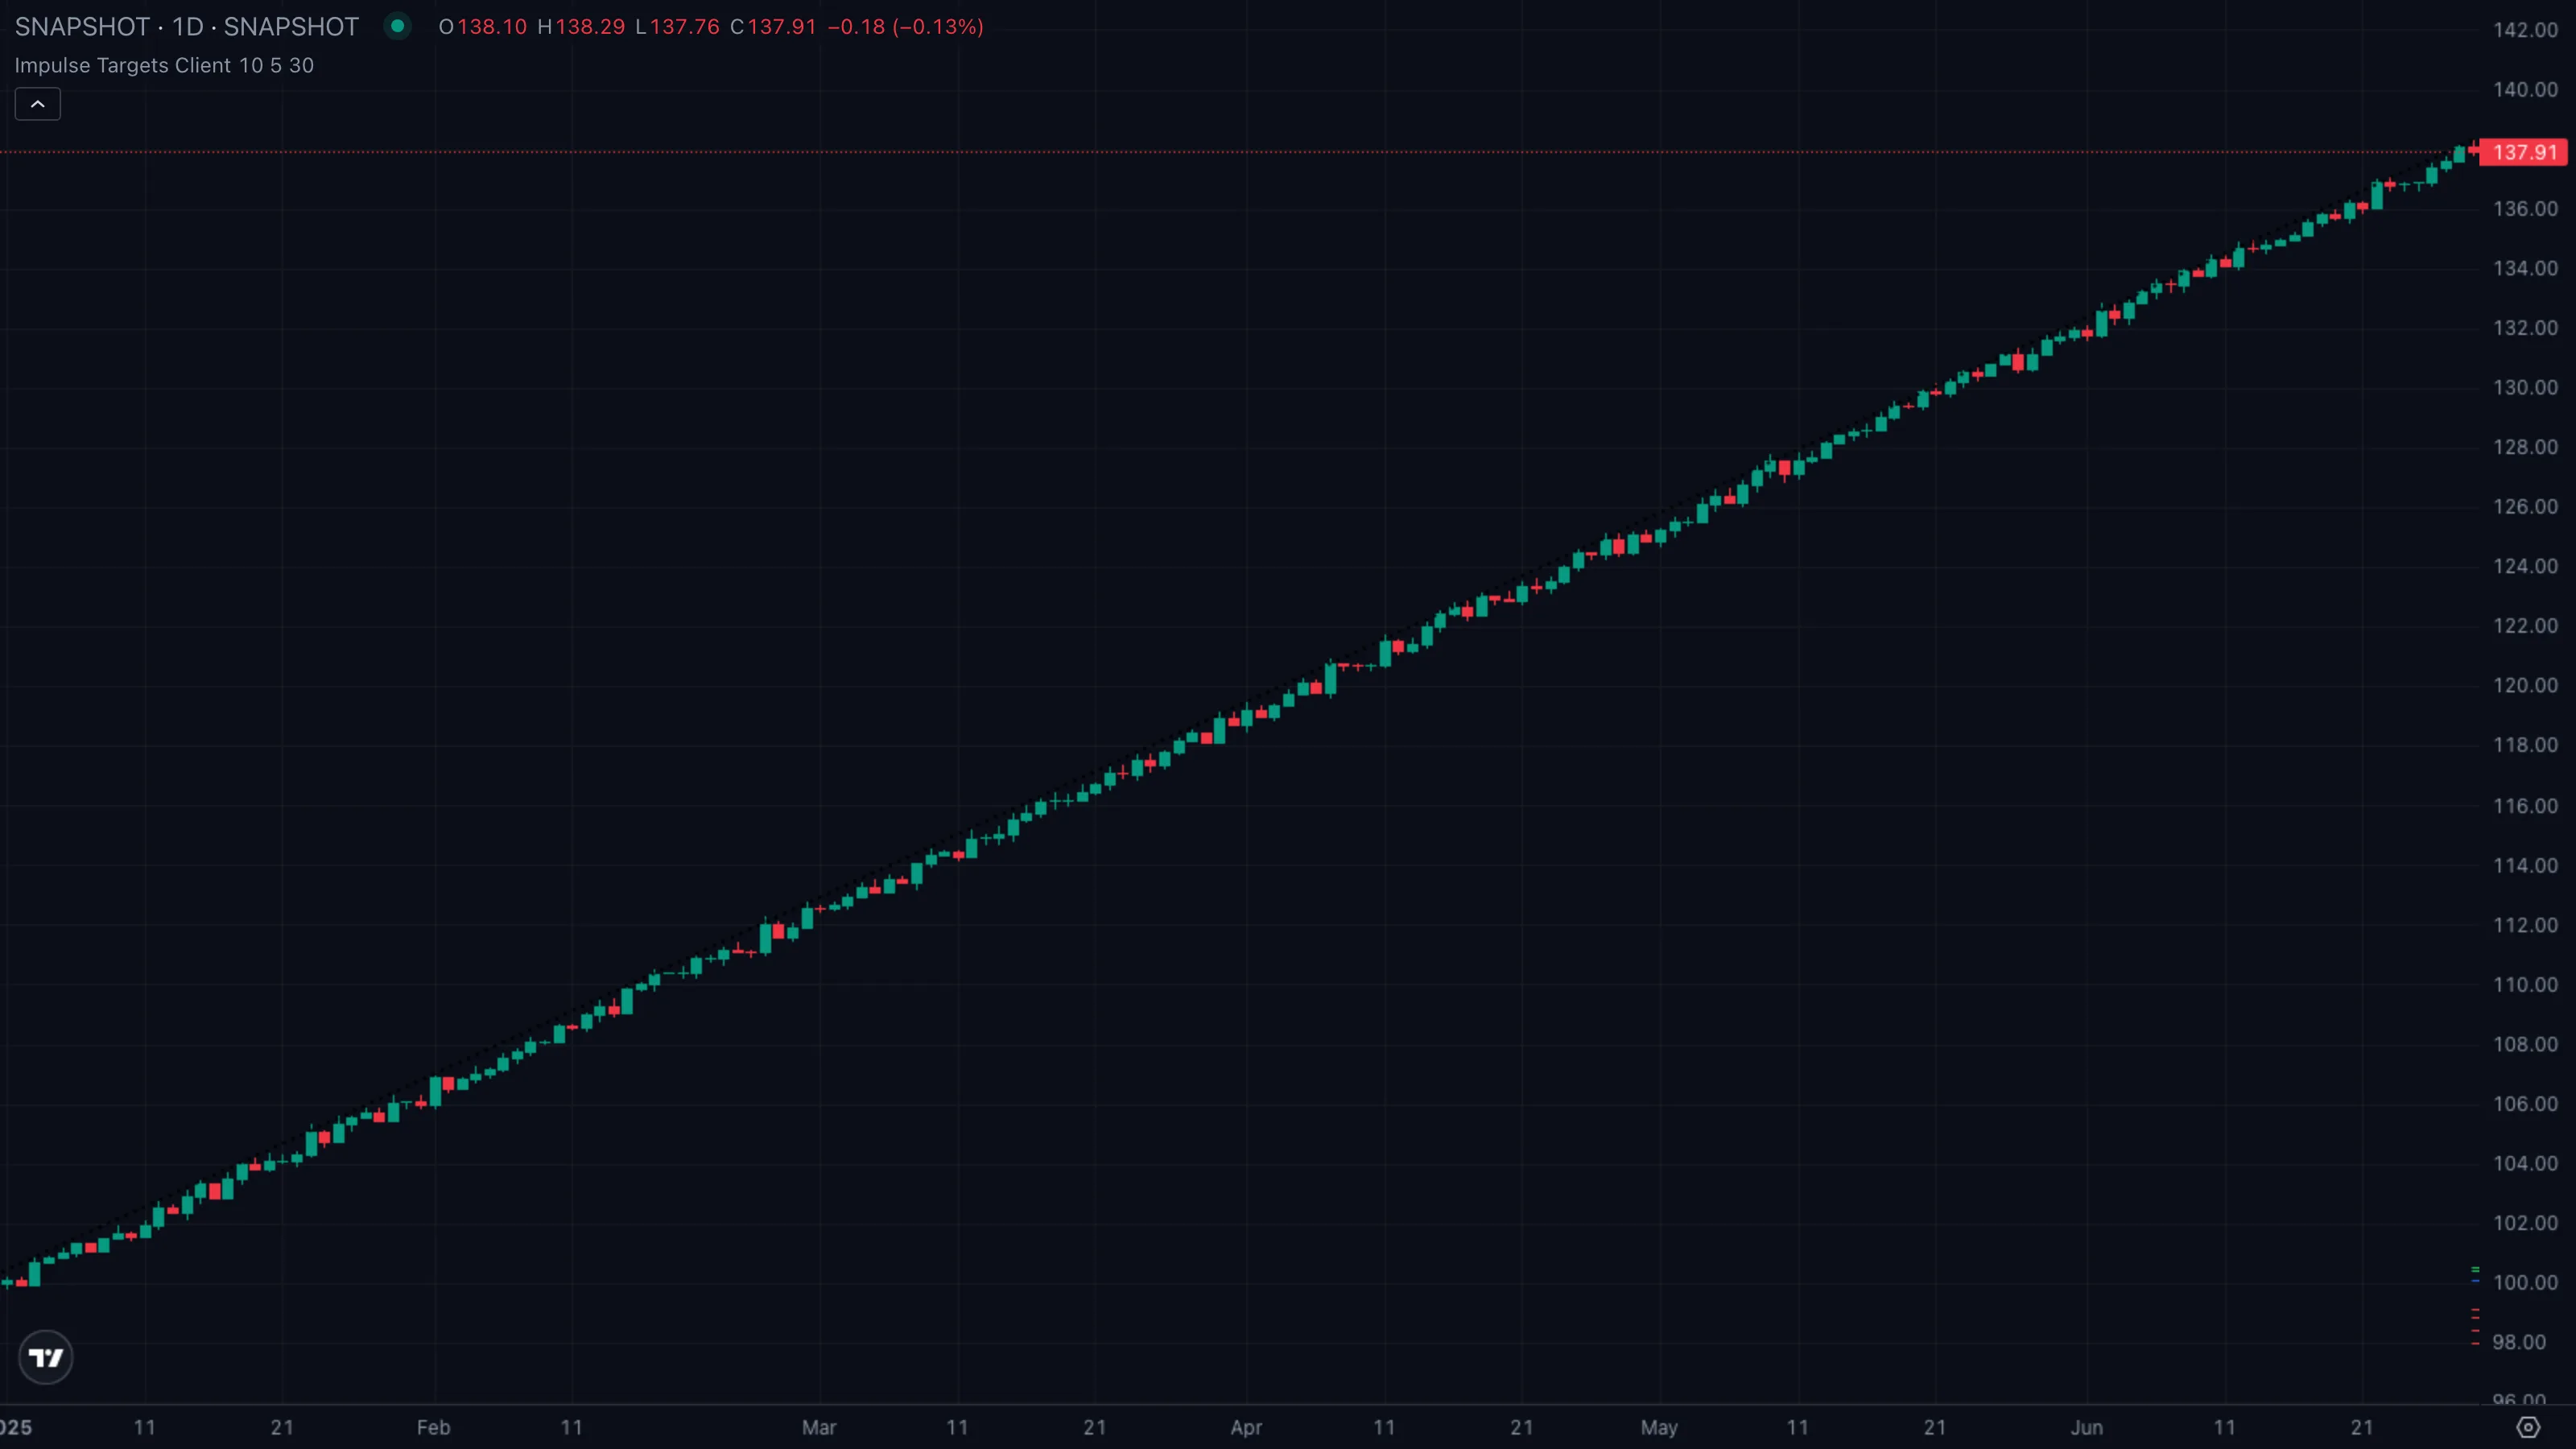
| What you see | ① Strong thrust higher tags Point 1 ② shallow pullbackPullback (Retracement)A short, counter-trend move within an established trend — buyers (or sellers) momentarily losing ground before the trend resumes. Often the lowest-risk place to enter the trend.Click for full definition → prints Point 2 inside the textbook zone ③ blue Entry line activates as price re-tests the pullbackPullback (Retracement)A short, counter-trend move within an established trend — buyers (or sellers) momentarily losing ground before the trend resumes. Often the lowest-risk place to enter the trend.Click for full definition → area ④ price walks up the ladder, clipping Target 1, 2, 3 in turn. |
| What it means | Both geometry and follow-through are textbook. The pullbackPullback (Retracement)A short, counter-trend move within an established trend — buyers (or sellers) momentarily losing ground before the trend resumes. Often the lowest-risk place to enter the trend.Click for full definition → was healthy enough to shake out late longs but not deep enough to break structureMarket StructureThe pattern of swing highs and lows price prints as it moves. Healthy uptrends print higher highs and higher lows; healthy downtrends print the mirror.Click for full definition →, and the resumption respected the projected ladder almost rung-by-rung. |
| What to do | Bias long from the Entry line, stop just beyond Point 0. Scale out at Target 1 to lock in the trade, leave a runner for Target 3 or 4. Trail using the T.Stop reference once Target 1 is filled. |
Pattern B — Impulse with partial fill
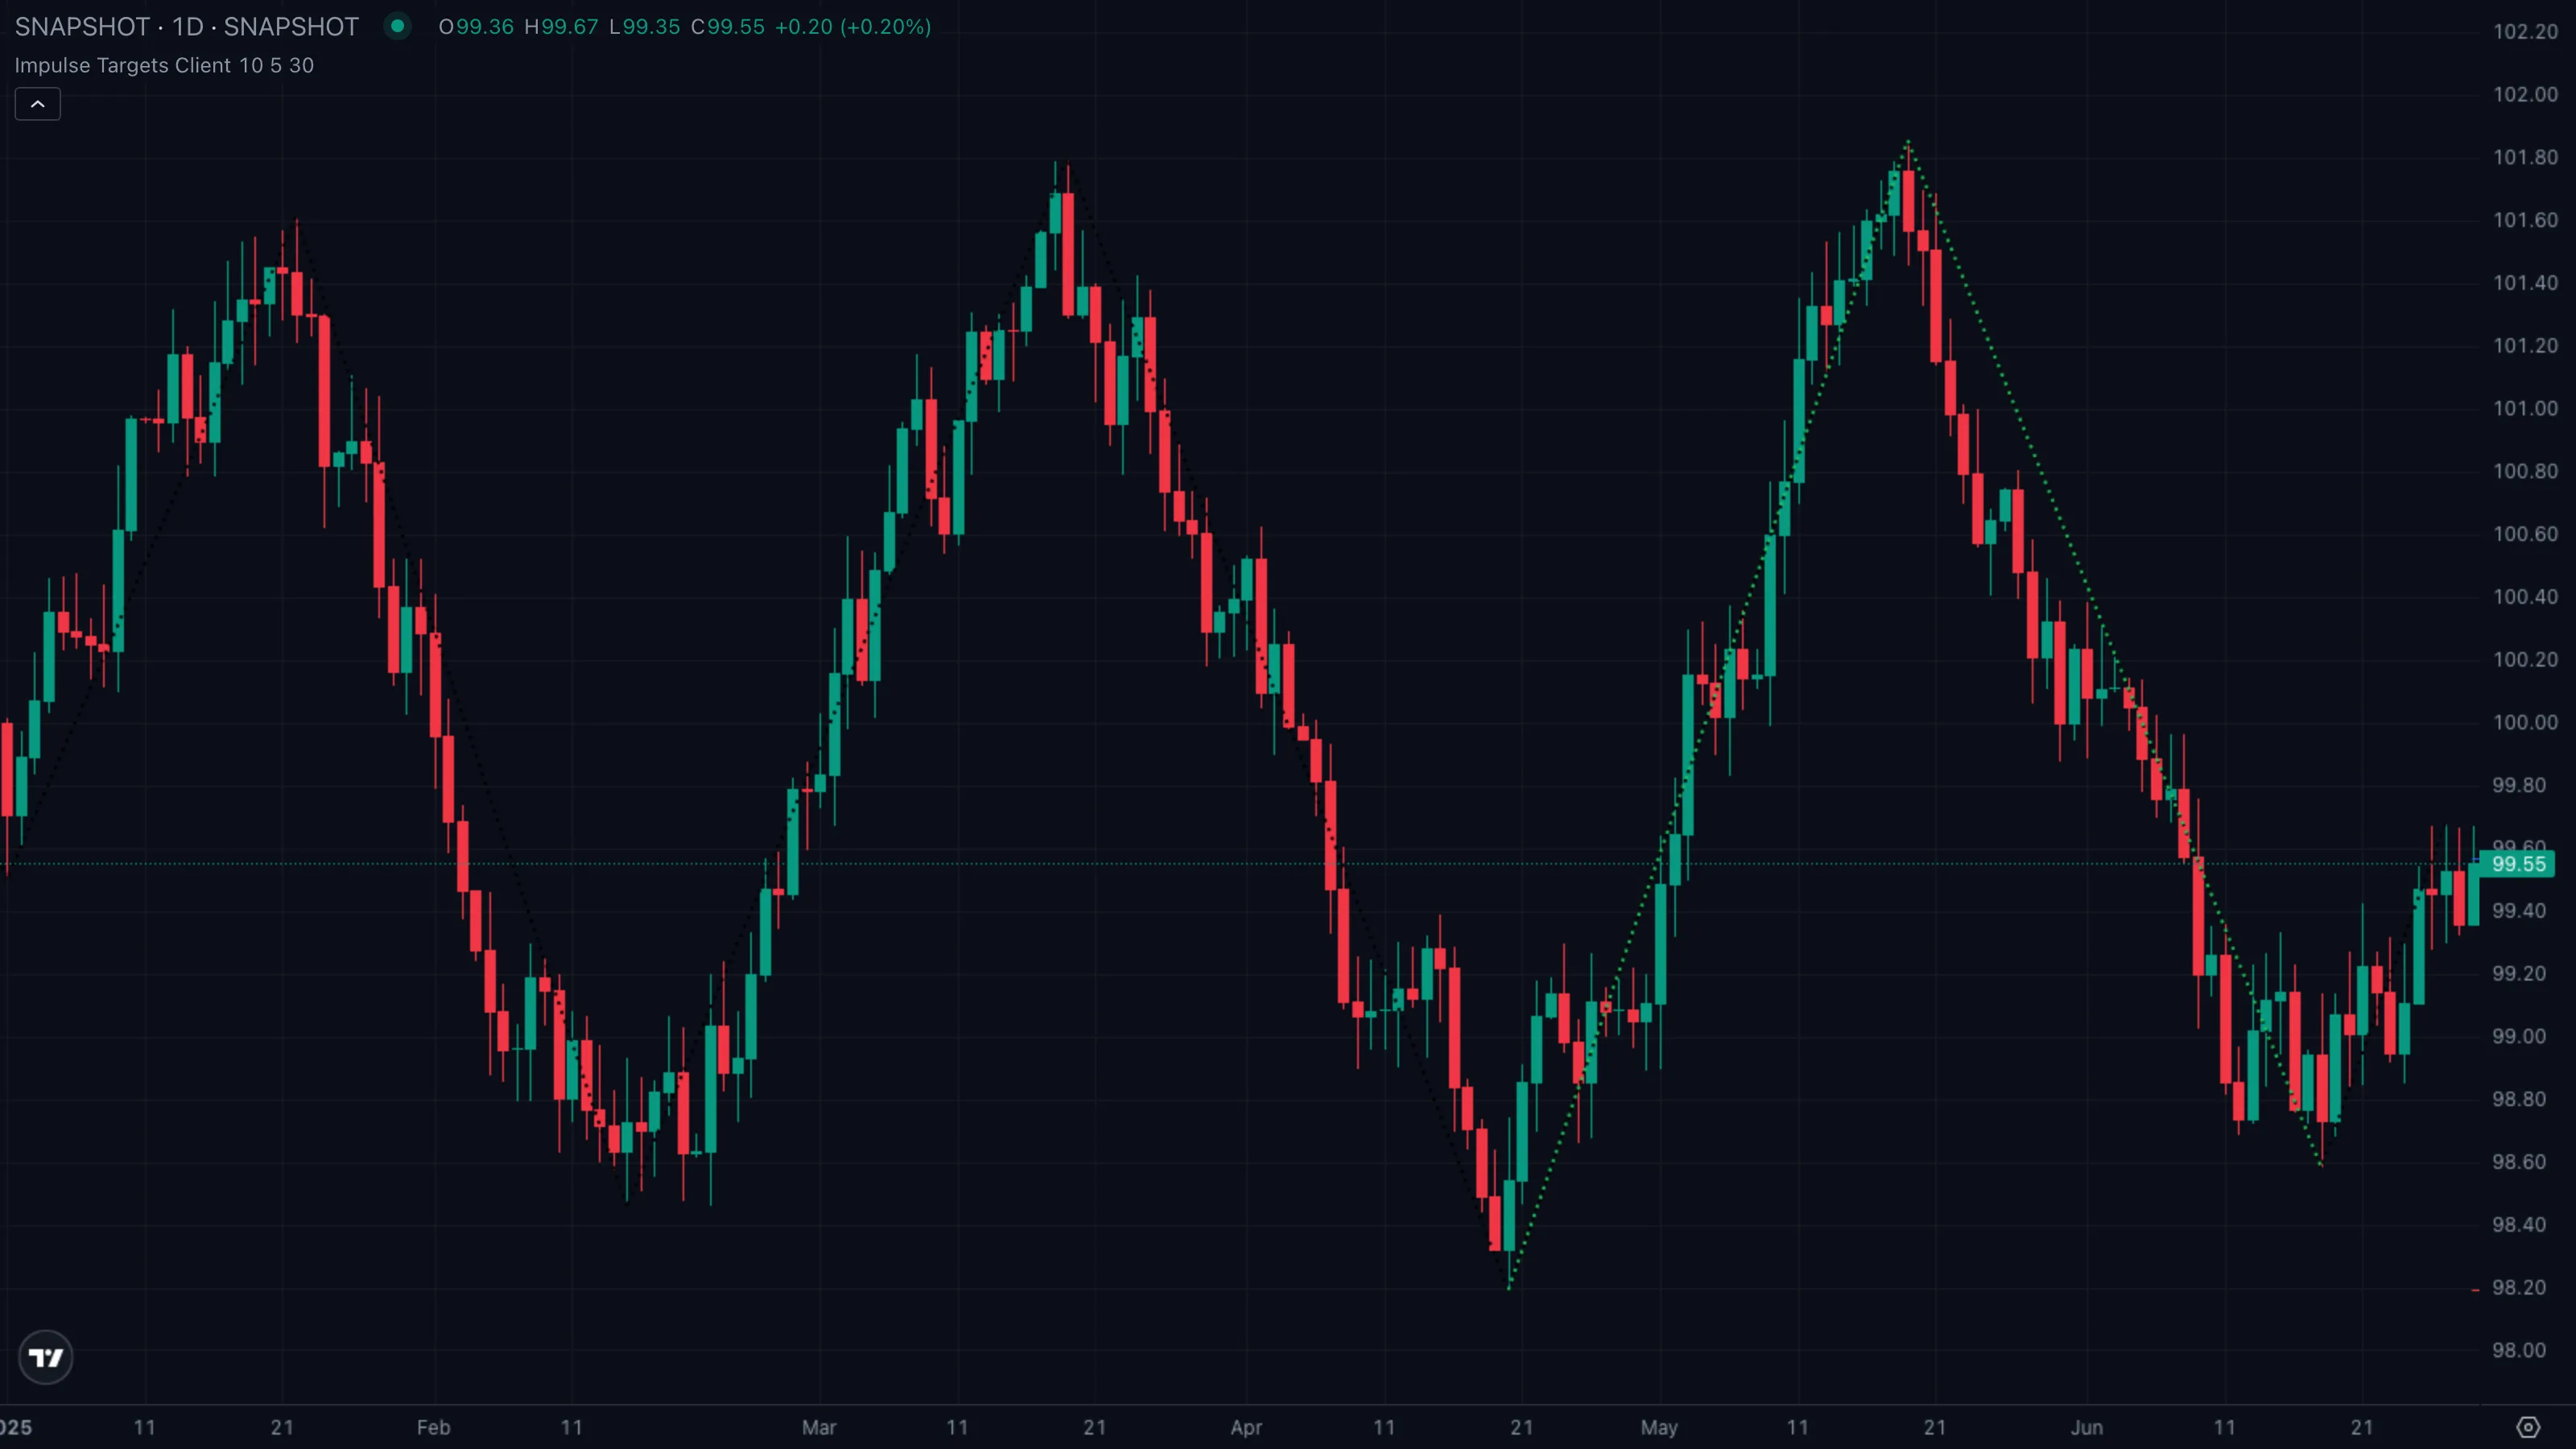
| What you see | ① Clean Point 0 to Point 1 to Point 2 sequence sets up the ladder ② entry triggers and price grinds up to Target 1 ③ momentum stalls before Target 2 and price chops sideways ④ T.Stop is eventually clipped on a deeper retest. |
| What it means | The setup was real but the follow-through was tired. This is what most live trades actually look like — geometry good enough to get paid on the first rung, but the broader market didn't have the gas for the full ladder. |
| What to do | Take Target 1 as the base case, not the bonus. Move stop to break-even after Target 1 fills, rely on T.Stop for the back half. Walking away with one rung is a win. |
Pattern C — Failed impulse
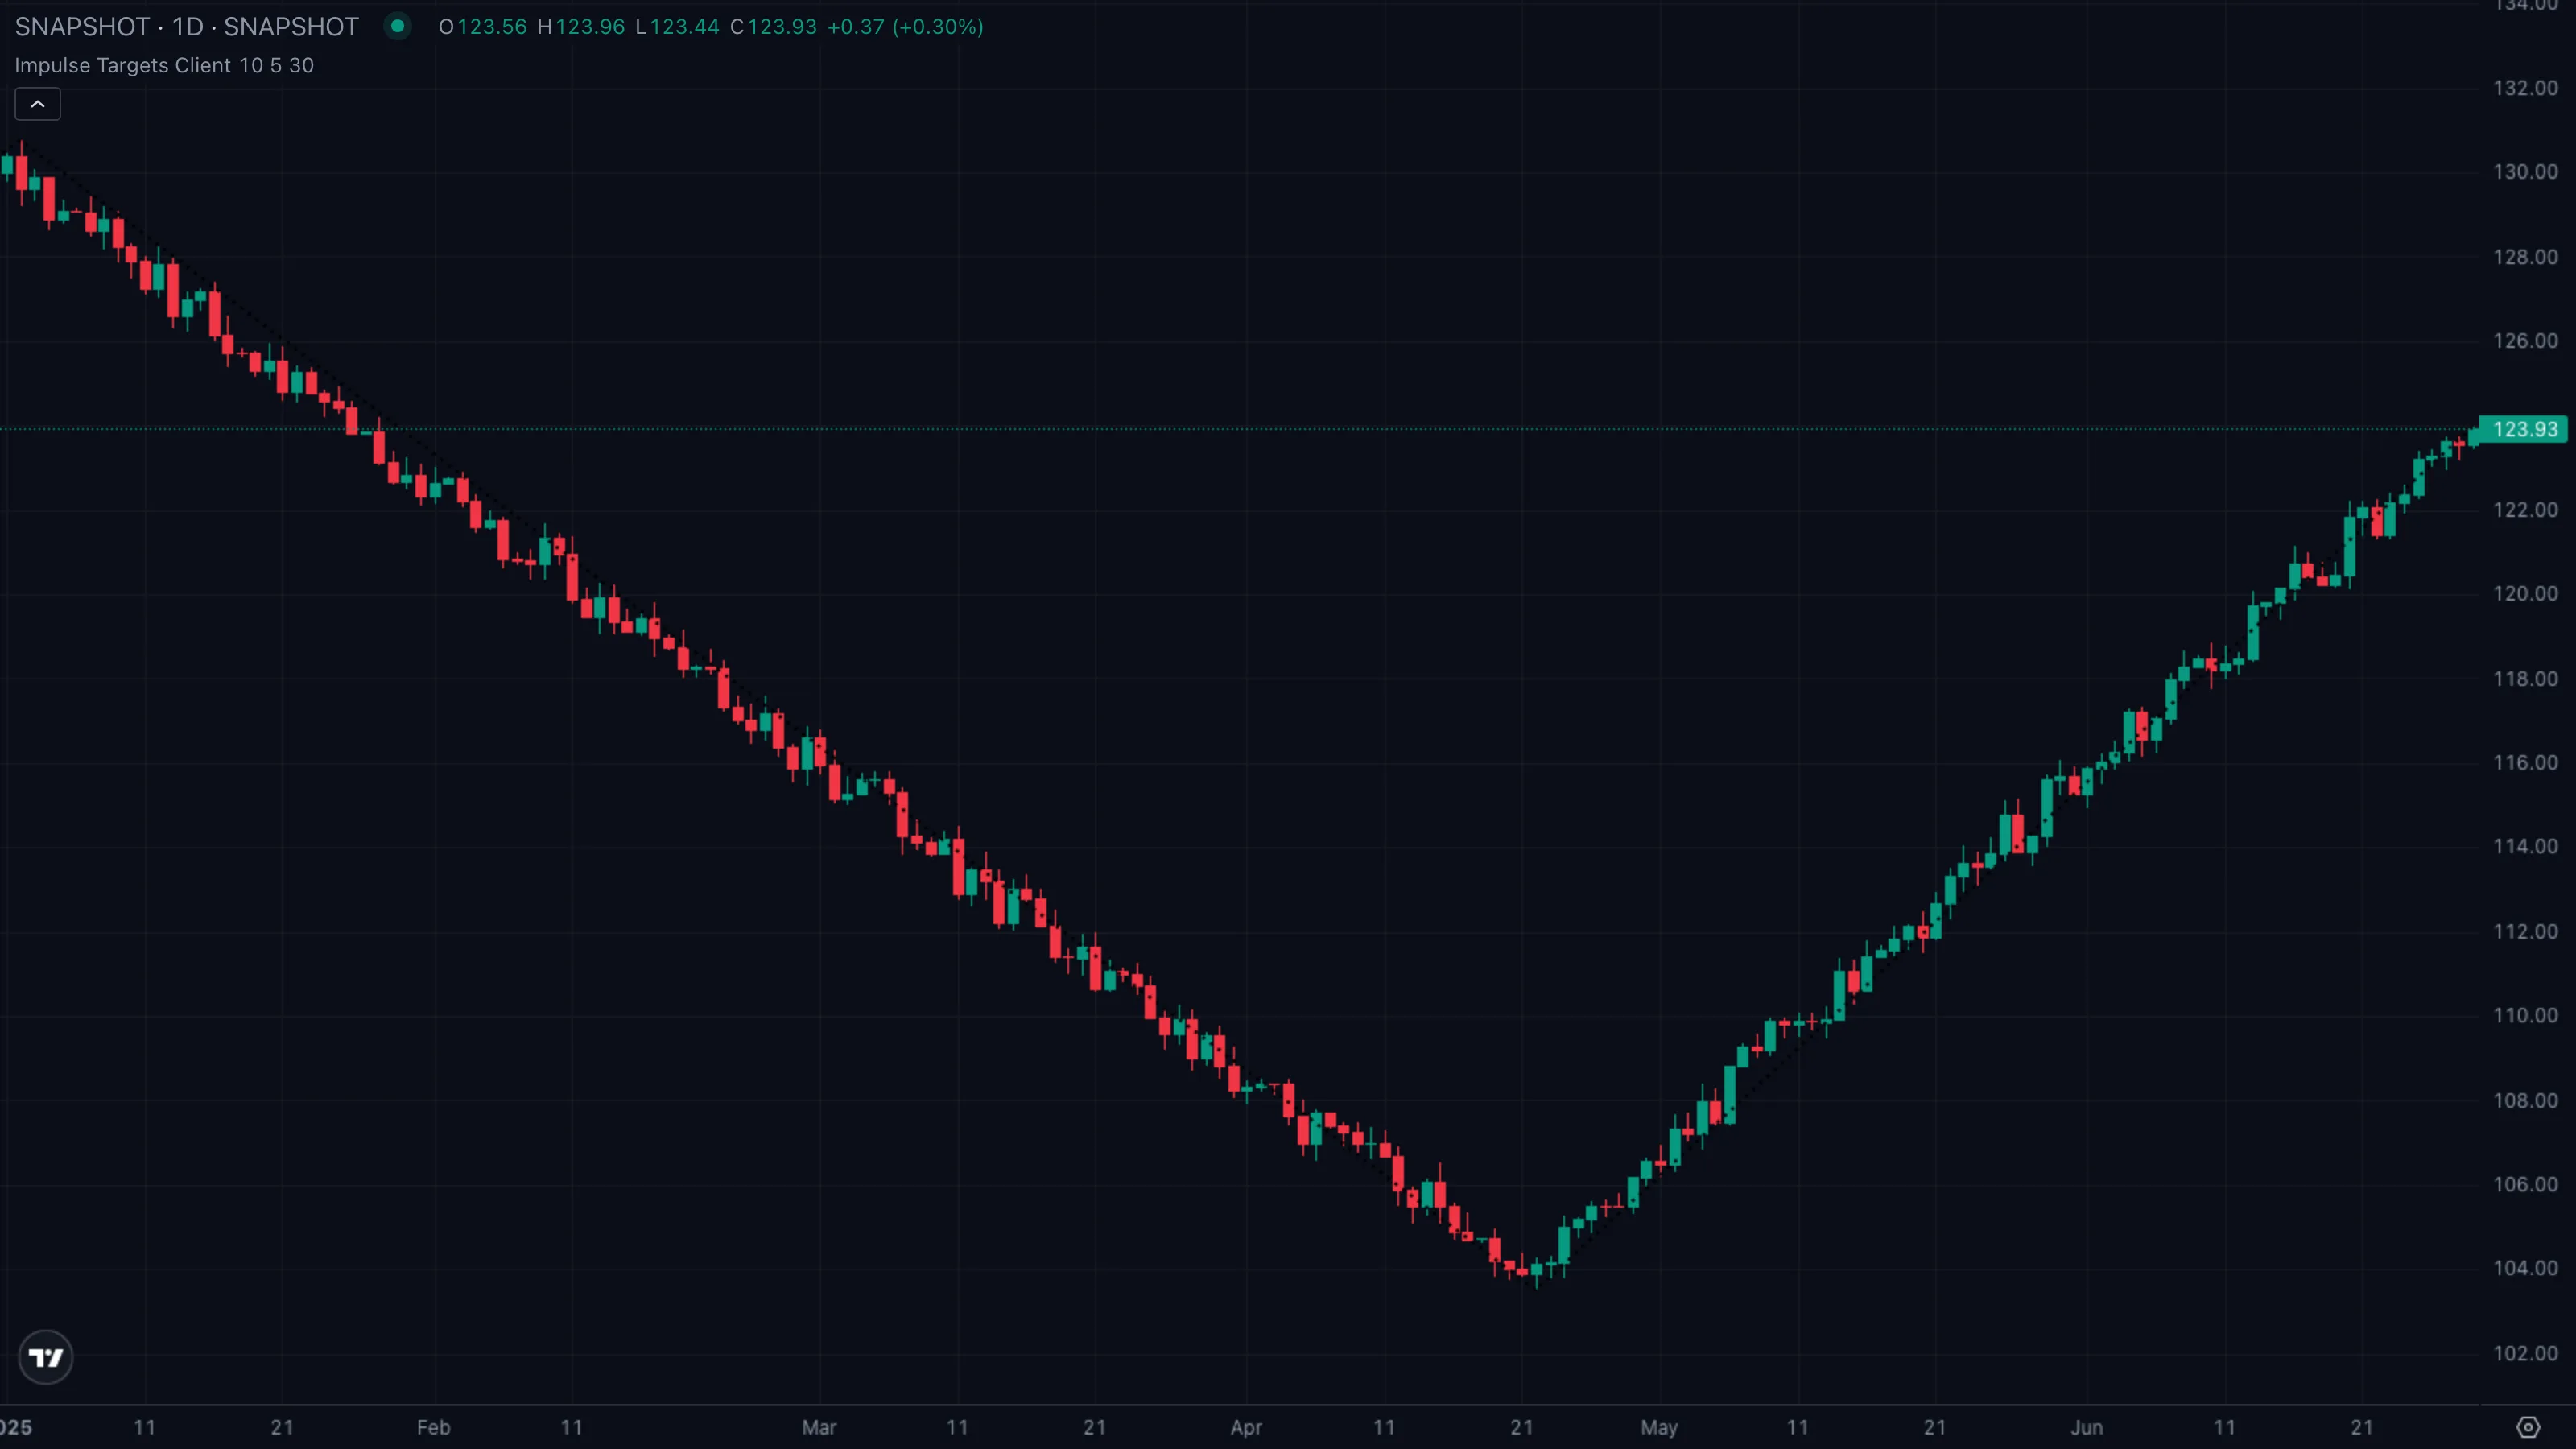
| What you see | ① Apparent W1 plus W2 with the ladder painted ② entry fires on the pullbackPullback (Retracement)A short, counter-trend move within an established trend — buyers (or sellers) momentarily losing ground before the trend resumes. Often the lowest-risk place to enter the trend.Click for full definition → ③ price never pushes toward Target 1, instead grinding back through entry ④ Stop level at Point 0 is taken out and the levels disappear. |
| What it means | Recognition was correct, follow-through wasn't. The pattern matched the textbook but the underlying regime — a higher-timeframe trend the other way, a news catalyst, thin liquidity — overruled the local geometry. Normal and expected. |
| What to do | Take the stop without arguing. Point 0 is the hard invalidation by design. Don't widen, don't average. The next setup is usually only a few sessions away. |
5. Trade Walkthrough
| Symbol | ETHUSDT |
|---|---|
| Timeframe | 4H |
| Venue | Binance |
| Window | 10 Mar to 22 Mar 2026 |
| Pattern | A — impulse triggers, targets hit |
A textbook bullish setup. ETH thrust off the 3,520 swing lowSwing High and Swing LowThe most recent confirmed pivot in either direction. Swing highs cap rallies until broken; swing lows support pullbacks until broken.Click for full definition → to a fresh wave high near 3,900, pulled back roughly two-thirds of that move into the 3,640 area, and then resumed. The pullbackPullback (Retracement)A short, counter-trend move within an established trend — buyers (or sellers) momentarily losing ground before the trend resumes. Often the lowest-risk place to enter the trend.Click for full definition → landed cleanly inside the textbook retracementPullback (Retracement)A short, counter-trend move within an established trend — buyers (or sellers) momentarily losing ground before the trend resumes. Often the lowest-risk place to enter the trend.Click for full definition → band, the engine published the ladder, and the next leg respected the projection almost rung-by-rung. The numbered markers ①–④ map to the four phases of the trade below.
The sequence
| # | When | ETH price | Indicator state | What it tells you |
|---|---|---|---|---|
| ① | 10 Mar | ~3,520 low | Confirmed-wave low (Point 0) | Structural base of the thrust. Becomes the Stop reference |
| ② | 13 Mar | ~3,900 high | Confirmed-wave high (Point 1), levels appear | The thrust leg is complete. Engine waits for a pullbackPullback (Retracement)A short, counter-trend move within an established trend — buyers (or sellers) momentarily losing ground before the trend resumes. Often the lowest-risk place to enter the trend.Click for full definition → |
| ③ | 16 Mar | ~3,640 low | Regular pullbackPullback (Retracement)A short, counter-trend move within an established trend — buyers (or sellers) momentarily losing ground before the trend resumes. Often the lowest-risk place to enter the trend.Click for full definition → low (Point 2), Entry line activates | PullbackPullback (Retracement)A short, counter-trend move within an established trend — buyers (or sellers) momentarily losing ground before the trend resumes. Often the lowest-risk place to enter the trend.Click for full definition → retraced ~68 % of W1, inside the textbook band. The real entry. |
| ④ | 21 Mar | ~4,400 area | Target 2 tagged, Target 3 within reach | Move maturing. Cue to scale out and trail with T.Stop |
The trade in one card
| What you skipped | Chasing the breakout bar at 3,900 — the obvious trade everyone took. Underwater within a session as the pullbackPullback (Retracement)A short, counter-trend move within an established trend — buyers (or sellers) momentarily losing ground before the trend resumes. Often the lowest-risk place to enter the trend.Click for full definition → developed. |
| What you took | Long on the retest of the Entry line near 3,650, stop just under Point 0 at 3,510. |
| Where you exited | Half off at Target 1 around 4,150, balance trailed by T.Stop after Target 2 filled near 4,400. |
| Move captured | ~ +18 % in roughly five days on the held portion. |
Lesson
The pattern match gives you the alert. The pullbackPullback (Retracement)A short, counter-trend move within an established trend — buyers (or sellers) momentarily losing ground before the trend resumes. Often the lowest-risk place to enter the trend.Click for full definition → into the Entry line gives you the trade. The target ladder tells you where to scale and where to walk.
6. Common Pitfalls
- Trading without a confirmed Point 1. The level ladder only paints when the engine sees a confirmed-wave pivotPivot High / Pivot LowA bar that is higher (or lower) than a defined number of bars on both sides. Confirmed only after the right-hand bars print without breaking it.Click for full definition →. If you see zigzag dots but no blue Entry line, the pattern hasn't triggered yet — don't pre-empt it.
- Treating the targets as guarantees. Target 4 is the upper bound of what's realistic, not a forecast. Most live trades only reach Target 1 or 2 — that's Pattern B, the most common outcome. Build your expectations around that.
- Ignoring the higher-timeframe regime. A bullish setup inside a clean daily downtrend has a much lower hit rate than the same setup inside a daily uptrend. Pair Impulse Targets with a regime tool — Momentum Wave's ribbon colour is the obvious companion — before sizing in.
- Moving the Stop because "it's close." Point 0 is the hard invalidation by design. If price trades through it the impulse interpretation is wrong. Widening the stop just turns a controlled loss into a bigger one.
- Re-using a stale ladder. Once Stop is hit, the engine clears the levels and starts looking for the next setup. If you're still anchoredAnchored VWAPA VWAP that begins at a chosen pivot bar (a swing high or swing low) and runs forward. Anchoring makes the absolute level meaningful instead of drifting with whatever bars happen to load.Click for full definition → to yesterday's targets, you'll miss the new pattern already forming. Trust the redraw.