

Institutional Algo
A signal-and-cloud framework that traces the footprint of large players — accumulationAccumulation and DistributionAccumulation is sustained net buying that builds a position quietly. Distribution is the reverse — sustained net selling into strength.Click for full definition → under the radar, distributionAccumulation and DistributionAccumulation is sustained net buying that builds a position quietly. Distribution is the reverse — sustained net selling into strength.Click for full definition → at the highs, and the displacementDisplacementA long-bodied bar that breaks out of a range with conviction. Marks the moment a desk stops hiding and starts pushing price.Click for full definition → bars that mark where they finally show their hand.
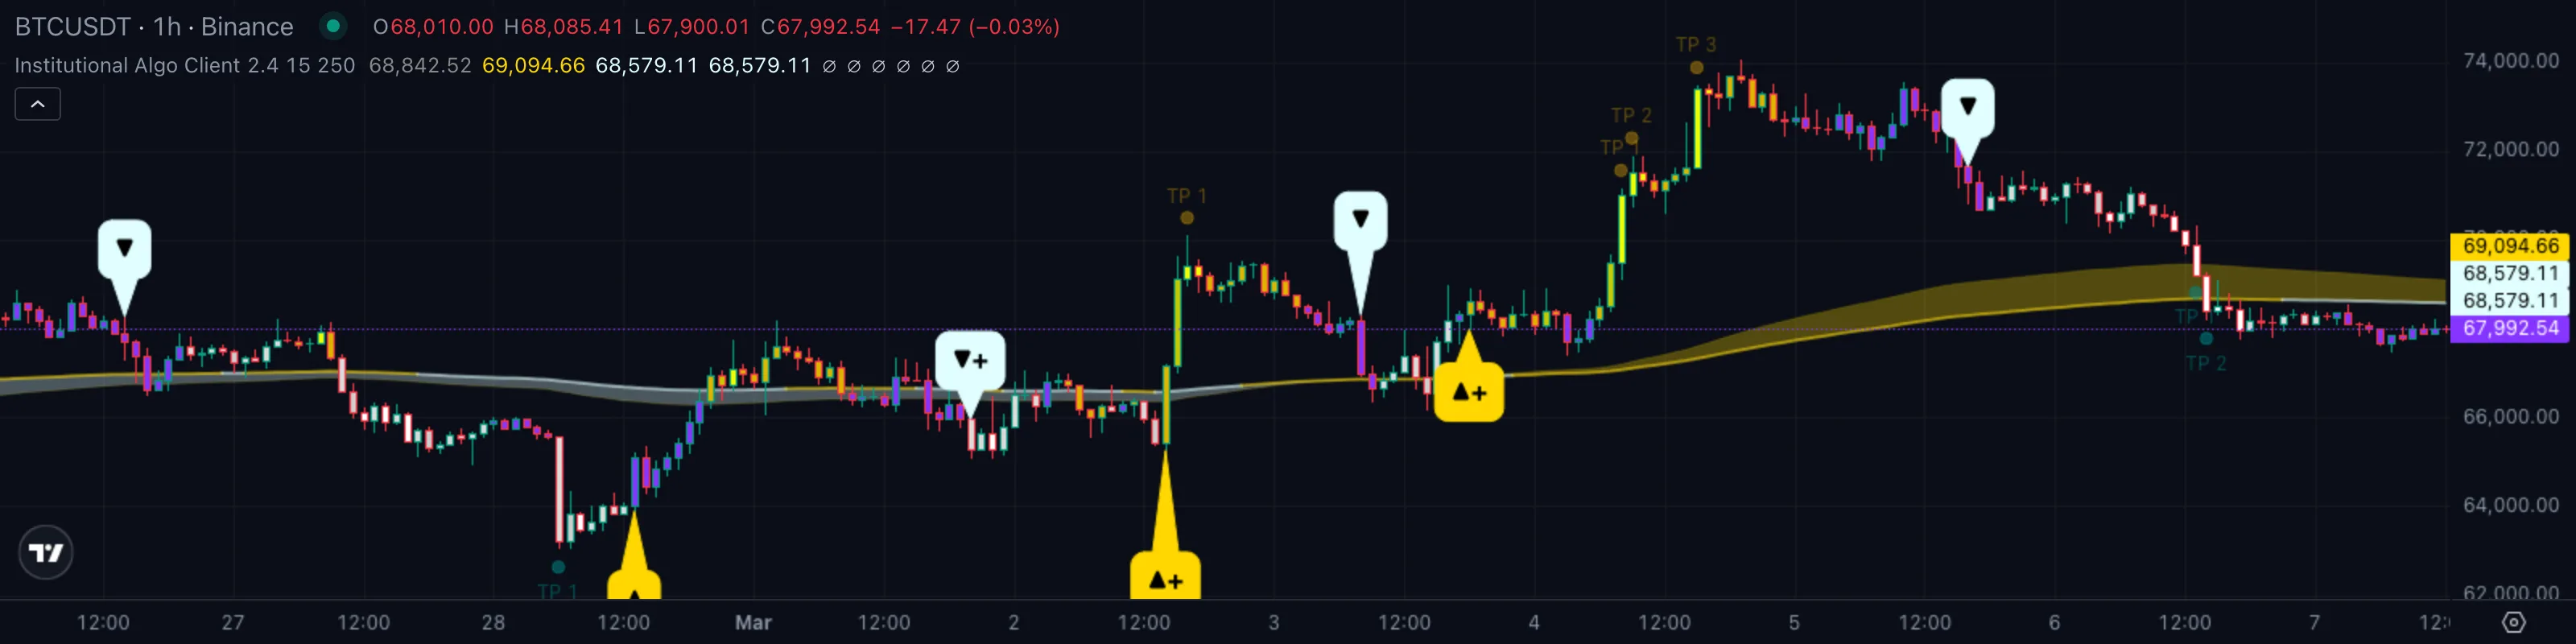
1. What This Indicator Watches For
The biggest moves in any market don't start with retail traders. They start when a fund, a market maker, or a desk has built a position quietly over hours or days and finally decides to push price the way it wants to go. By the time a trend is obvious on a chart, the heavy lifting is already done — the position is built, the order blockOrder BlockThe cluster of bars where a large player built a position before a strong move. Often acts as future support or resistance when price returns to it.Click for full definition → is set, and what you're watching is the public part of a private process.
Smart-money traders try to read three phases of that process:
- AccumulationAccumulation and DistributionAccumulation is sustained net buying that builds a position quietly. Distribution is the reverse — sustained net selling into strength.Click for full definition → — price goes sideways while large buyers absorb every supplySupply and Demand ZoneA horizontal band drawn at a recent swing extreme where buyers (demand) or sellers (supply) last took control. Treated as likely support or resistance until price closes through it.Click for full definition → that comes in. The chart looks boring. It is not.
- DisplacementDisplacementA long-bodied bar that breaks out of a range with conviction. Marks the moment a desk stops hiding and starts pushing price.Click for full definition → — a sudden, decisive bar (or two) that breaks the range. This is where the desk stops hiding and starts pushing. It usually leaves a fair value gapFair Value GapA gap between three consecutive bars where price moved so fast it left an unfilled zone. Markets often revisit it before continuing the trend.Click for full definition → behind it.
- DistributionAccumulation and DistributionAccumulation is sustained net buying that builds a position quietly. Distribution is the reverse — sustained net selling into strength.Click for full definition → — the mirror image of accumulationAccumulation and DistributionAccumulation is sustained net buying that builds a position quietly. Distribution is the reverse — sustained net selling into strength.Click for full definition →, but at the top. Price drifts sideways while the same desk quietly hands its inventory to the late crowd.
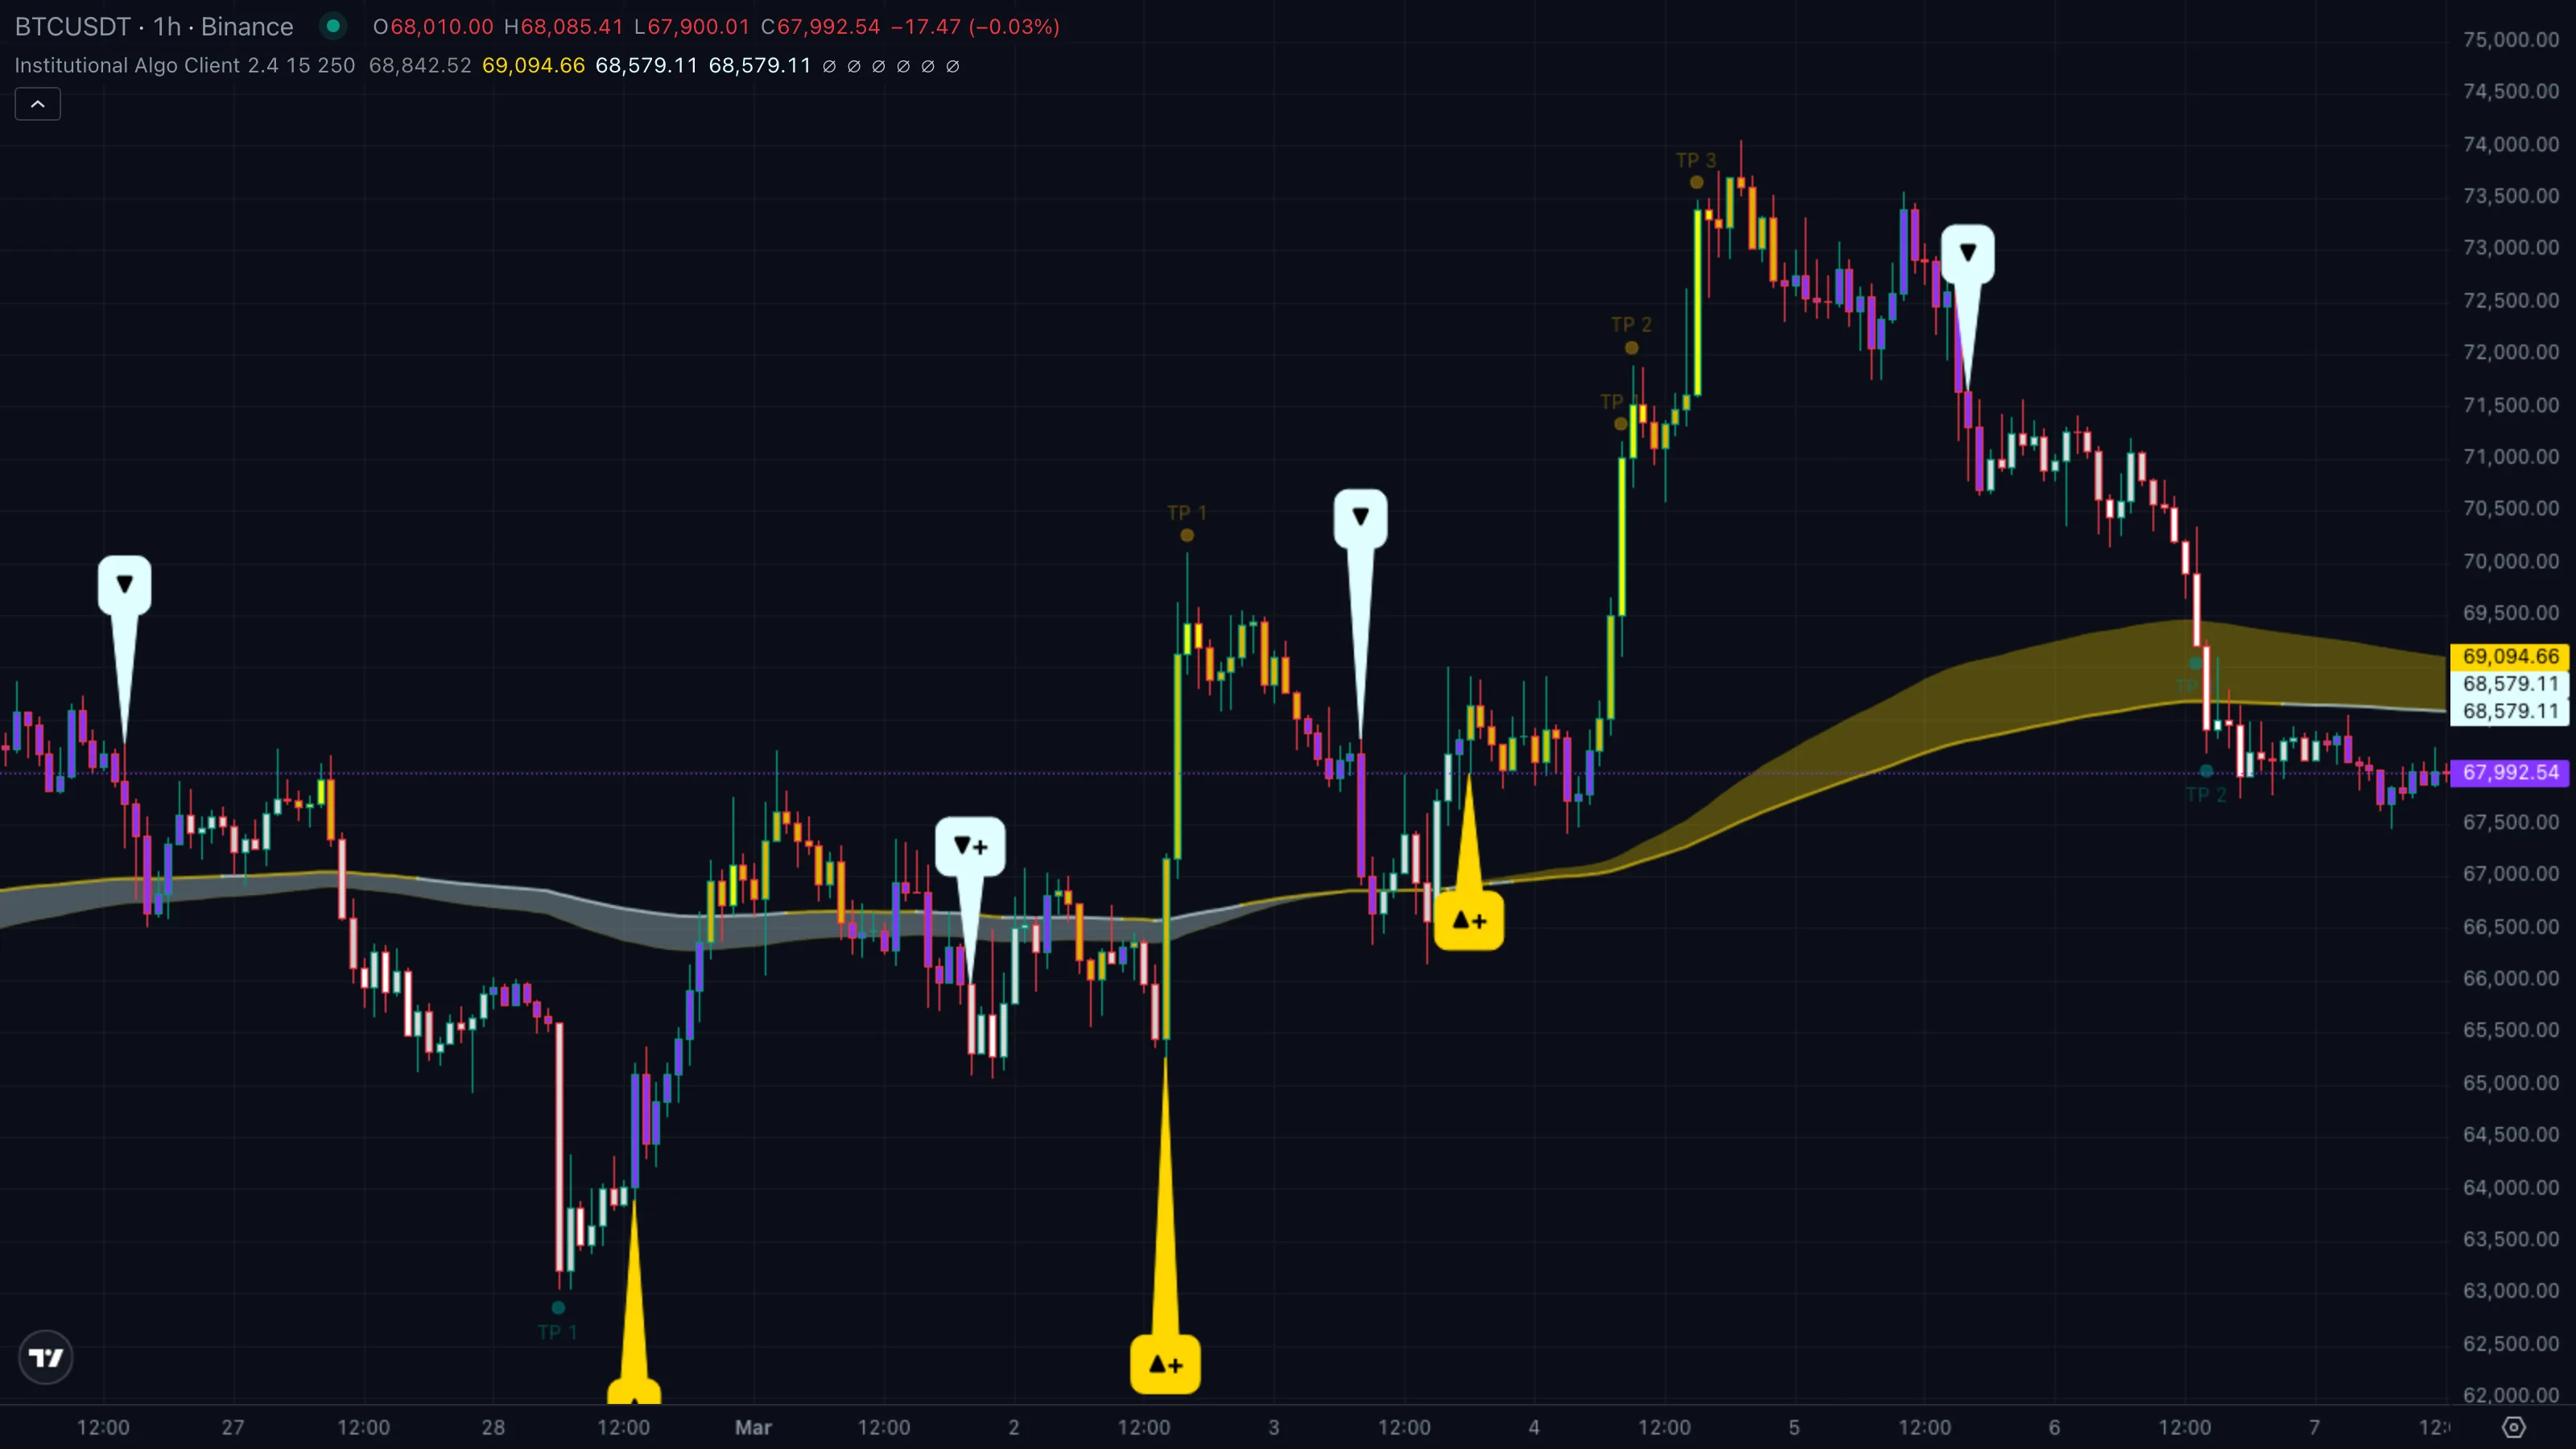
Institutional Algo is built to flag all three. It paints a Trend Cloud, a Trend Tracer line, a Smart Panel of regime cells, and — most importantly — a small set of Buy / Strong Buy / Sell / Strong Sell callouts at the bars where the displacementDisplacementA long-bodied bar that breaks out of a range with conviction. Marks the moment a desk stops hiding and starts pushing price.Click for full definition → actually fires.
2. How It Works Under the Hood
Three engines run in parallel and each contributes a different piece of the smart-money story:
- The SupertrendSupertrendA trailing line set above or below price using an ATR multiple. When close crosses it, the line flips to the opposite side and signals a regime change.Click for full definition → signal core — a volatility-aware trailing line. When price closes back through it from below, the chart prints a Buy callout. When price closes back through it from above, a Sell. The line itself stays hidden in the pane; what you see is the arrow at the bar where the cross happened. Default sensitivity 2.4, ATRAverage True RangeA measure of typical bar-to-bar volatility. ATR rises when bars get bigger; many indicators use it as a noise floor — they only fire when a move clears a multiple of ATR.Click for full definition → length 15.
- The Trend Cloud — two long EMAs (lengths 150 and 250). The shaded fill between them is gold when the fast edge sits above the slow edge, light cyan when it sits below. The cloud is the regime filter — it tells you which side of the market the long money is on, regardless of the noise in between.
- The Trend Tracer — a single visible long EMAExponential Moving AverageA moving average that weights recent bars more heavily than old ones, so it reacts faster to fresh price action than a simple average of the same length.Click for full definition → (default length 250). Its colour flips by comparing today's price against the price 8 bars ago — a coarse proxy for whether the last bar-and-a-half of price action is still pushing in the cloud's direction.
On top of that the indicator adds two extras that turn signals into a workflow:
- Strong qualifier — every Buy or Sell is graded against a 200-bar EMAExponential Moving AverageA moving average that weights recent bars more heavily than old ones, so it reacts faster to fresh price action than a simple average of the same length.Click for full definition →. Price firing above it means a strong upgrade ("Strong Buy"). Below it means a downgrade ("Sell" instead of "Strong Sell"). Visually it's the difference between a single arrow and an arrow with a "+" — the chart tells you immediately whether the desk's footprint lines up with the bigger trend.
- Take-profit ladder — once a trade is open, the indicator plots TP1, TP2, TP3 at the bars where RSIRelative Strength IndexA 0-to-100 momentum oscillator measuring the size of recent up-bars versus down-bars. Above 70 is hot, below 30 is cold, near 50 is neutral.Click for full definition → crosses 70 / 75 / 80 on the bull side, or 30 / 25 / 20 on the bear side. The rungs only fire once per trade, in order, and only inside the current trade window. The chart literally tells you where the desk is most likely to start taking profit.
How the Trend Cloud picks its colour. Every bar, the indicator asks two simple questions:
- Is the fast EMAExponential Moving AverageA moving average that weights recent bars more heavily than old ones, so it reacts faster to fresh price action than a simple average of the same length.Click for full definition → above the slow EMAExponential Moving AverageA moving average that weights recent bars more heavily than old ones, so it reacts faster to fresh price action than a simple average of the same length.Click for full definition →? If yes, gold cloud — the long money is on the bull side. If no, light cyan — the long money is on the bear side.
- How decisive is the firing bar? A signal fires at the moment price closes back through the SupertrendSupertrendA trailing line set above or below price using an ATR multiple. When close crosses it, the line flips to the opposite side and signals a regime change.Click for full definition →. The Strong qualifier then asks "is this bar already on the right side of the 200-bar baseline?" — if yes, mark it Strong; if not, mark it Normal.
| What you're seeing | Cloud + signal | Plain English |
|---|---|---|
| Gold cloud, Buy callout fires above the 200 EMAExponential Moving AverageA moving average that weights recent bars more heavily than old ones, so it reacts faster to fresh price action than a simple average of the same length.Click for full definition → | 🟢 Strong Buy | Big trend is up, displacementDisplacementA long-bodied bar that breaks out of a range with conviction. Marks the moment a desk stops hiding and starts pushing price.Click for full definition → just confirmed it |
| Gold cloud, Buy below the 200 EMAExponential Moving AverageA moving average that weights recent bars more heavily than old ones, so it reacts faster to fresh price action than a simple average of the same length.Click for full definition → — or cyan cloud, Sell above | 🟡 Normal signal | Mixed regime, signal is real but smaller edge |
| Cyan cloud, Sell callout fires below the 200 EMAExponential Moving AverageA moving average that weights recent bars more heavily than old ones, so it reacts faster to fresh price action than a simple average of the same length.Click for full definition → | 🔴 Strong Sell | Big trend is down, distributionAccumulation and DistributionAccumulation is sustained net buying that builds a position quietly. Distribution is the reverse — sustained net selling into strength.Click for full definition → top just gave way |
The "Strong" qualifier is the whole reason Institutional Algo doesn't treat every SupertrendSupertrendA trailing line set above or below price using an ATR multiple. When close crosses it, the line flips to the opposite side and signals a regime change.Click for full definition → cross equally. A Buy that happens while price is already trending up over a long lookback is a different beast from a Buy in a clear downtrend — the indicator labels them so you don't confuse the two.
3. What You See on the Chart
| Element | Looks like | Means |
|---|---|---|
| Buy callout | Gold bubble below the bar with ▲ inside | SupertrendSupertrendA trailing line set above or below price using an ATR multiple. When close crosses it, the line flips to the opposite side and signals a regime change.Click for full definition → cross up. Bar is below the 200 EMAExponential Moving AverageA moving average that weights recent bars more heavily than old ones, so it reacts faster to fresh price action than a simple average of the same length.Click for full definition → — Normal Buy |
| Strong Buy callout | Gold bubble below the bar with ▲+ inside | SupertrendSupertrendA trailing line set above or below price using an ATR multiple. When close crosses it, the line flips to the opposite side and signals a regime change.Click for full definition → cross up while price is above the 200 EMAExponential Moving AverageA moving average that weights recent bars more heavily than old ones, so it reacts faster to fresh price action than a simple average of the same length.Click for full definition → — high-conviction long |
| Sell callout | Light cyan bubble above the bar with ▼ inside | SupertrendSupertrendA trailing line set above or below price using an ATR multiple. When close crosses it, the line flips to the opposite side and signals a regime change.Click for full definition → cross down. Bar is above the 200 EMAExponential Moving AverageA moving average that weights recent bars more heavily than old ones, so it reacts faster to fresh price action than a simple average of the same length.Click for full definition → — Normal Sell |
| Strong Sell callout | Light cyan bubble above the bar with ▼+ inside | SupertrendSupertrendA trailing line set above or below price using an ATR multiple. When close crosses it, the line flips to the opposite side and signals a regime change.Click for full definition → cross down while price is below the 200 EMAExponential Moving AverageA moving average that weights recent bars more heavily than old ones, so it reacts faster to fresh price action than a simple average of the same length.Click for full definition → — high-conviction short |
| Trend Cloud | Tinted area between two faint lines | Long-term regime — gold = bullish bias, cyan = bearish bias |
| Trend Tracer | One thicker EMAExponential Moving AverageA moving average that weights recent bars more heavily than old ones, so it reacts faster to fresh price action than a simple average of the same length.Click for full definition → line | Visible long baseline. Colour flips bull/bear by comparing close vs close 8 bars ago |
| TP markers | Small circles labelled "TP 1" / "TP 2" / "TP 3" | Profit-taking rungs. Above the bar in a long, below the bar in a short |
| Smart Panel | Five-row card in the bottom-right corner | Regime dashboard — Market State, Volatility, Institutional Activity, Session, Trend Pressure |
| Bar colouring | Candles tinted purple, amber, yellow, gray, or white | Trend Gradient — purple is weak / ranging, bright yellow is strong-bull, white is strong-bear |
The Smart Panel in particular is worth getting comfortable with. It reads the latest bar and answers five questions at a glance — is the market actually trending right now (ADX), how stretched is volatility, is volume above its 21-bar average (the liquidity sweepLiquidity SweepA quick wick or push beyond an obvious high or low that triggers retail stops. Smart money often uses it to fill big orders before reversing the move.Click for full definition → check), which trading session you're in, and which way the short EMAExponential Moving AverageA moving average that weights recent bars more heavily than old ones, so it reacts faster to fresh price action than a simple average of the same length.Click for full definition → is sloping. Think of it as a heads-up display of the things a desk would look at before pulling the trigger.
4. Reading It in 3 Patterns
Pattern A — AccumulationAccumulation and DistributionAccumulation is sustained net buying that builds a position quietly. Distribution is the reverse — sustained net selling into strength.Click for full definition → footprint
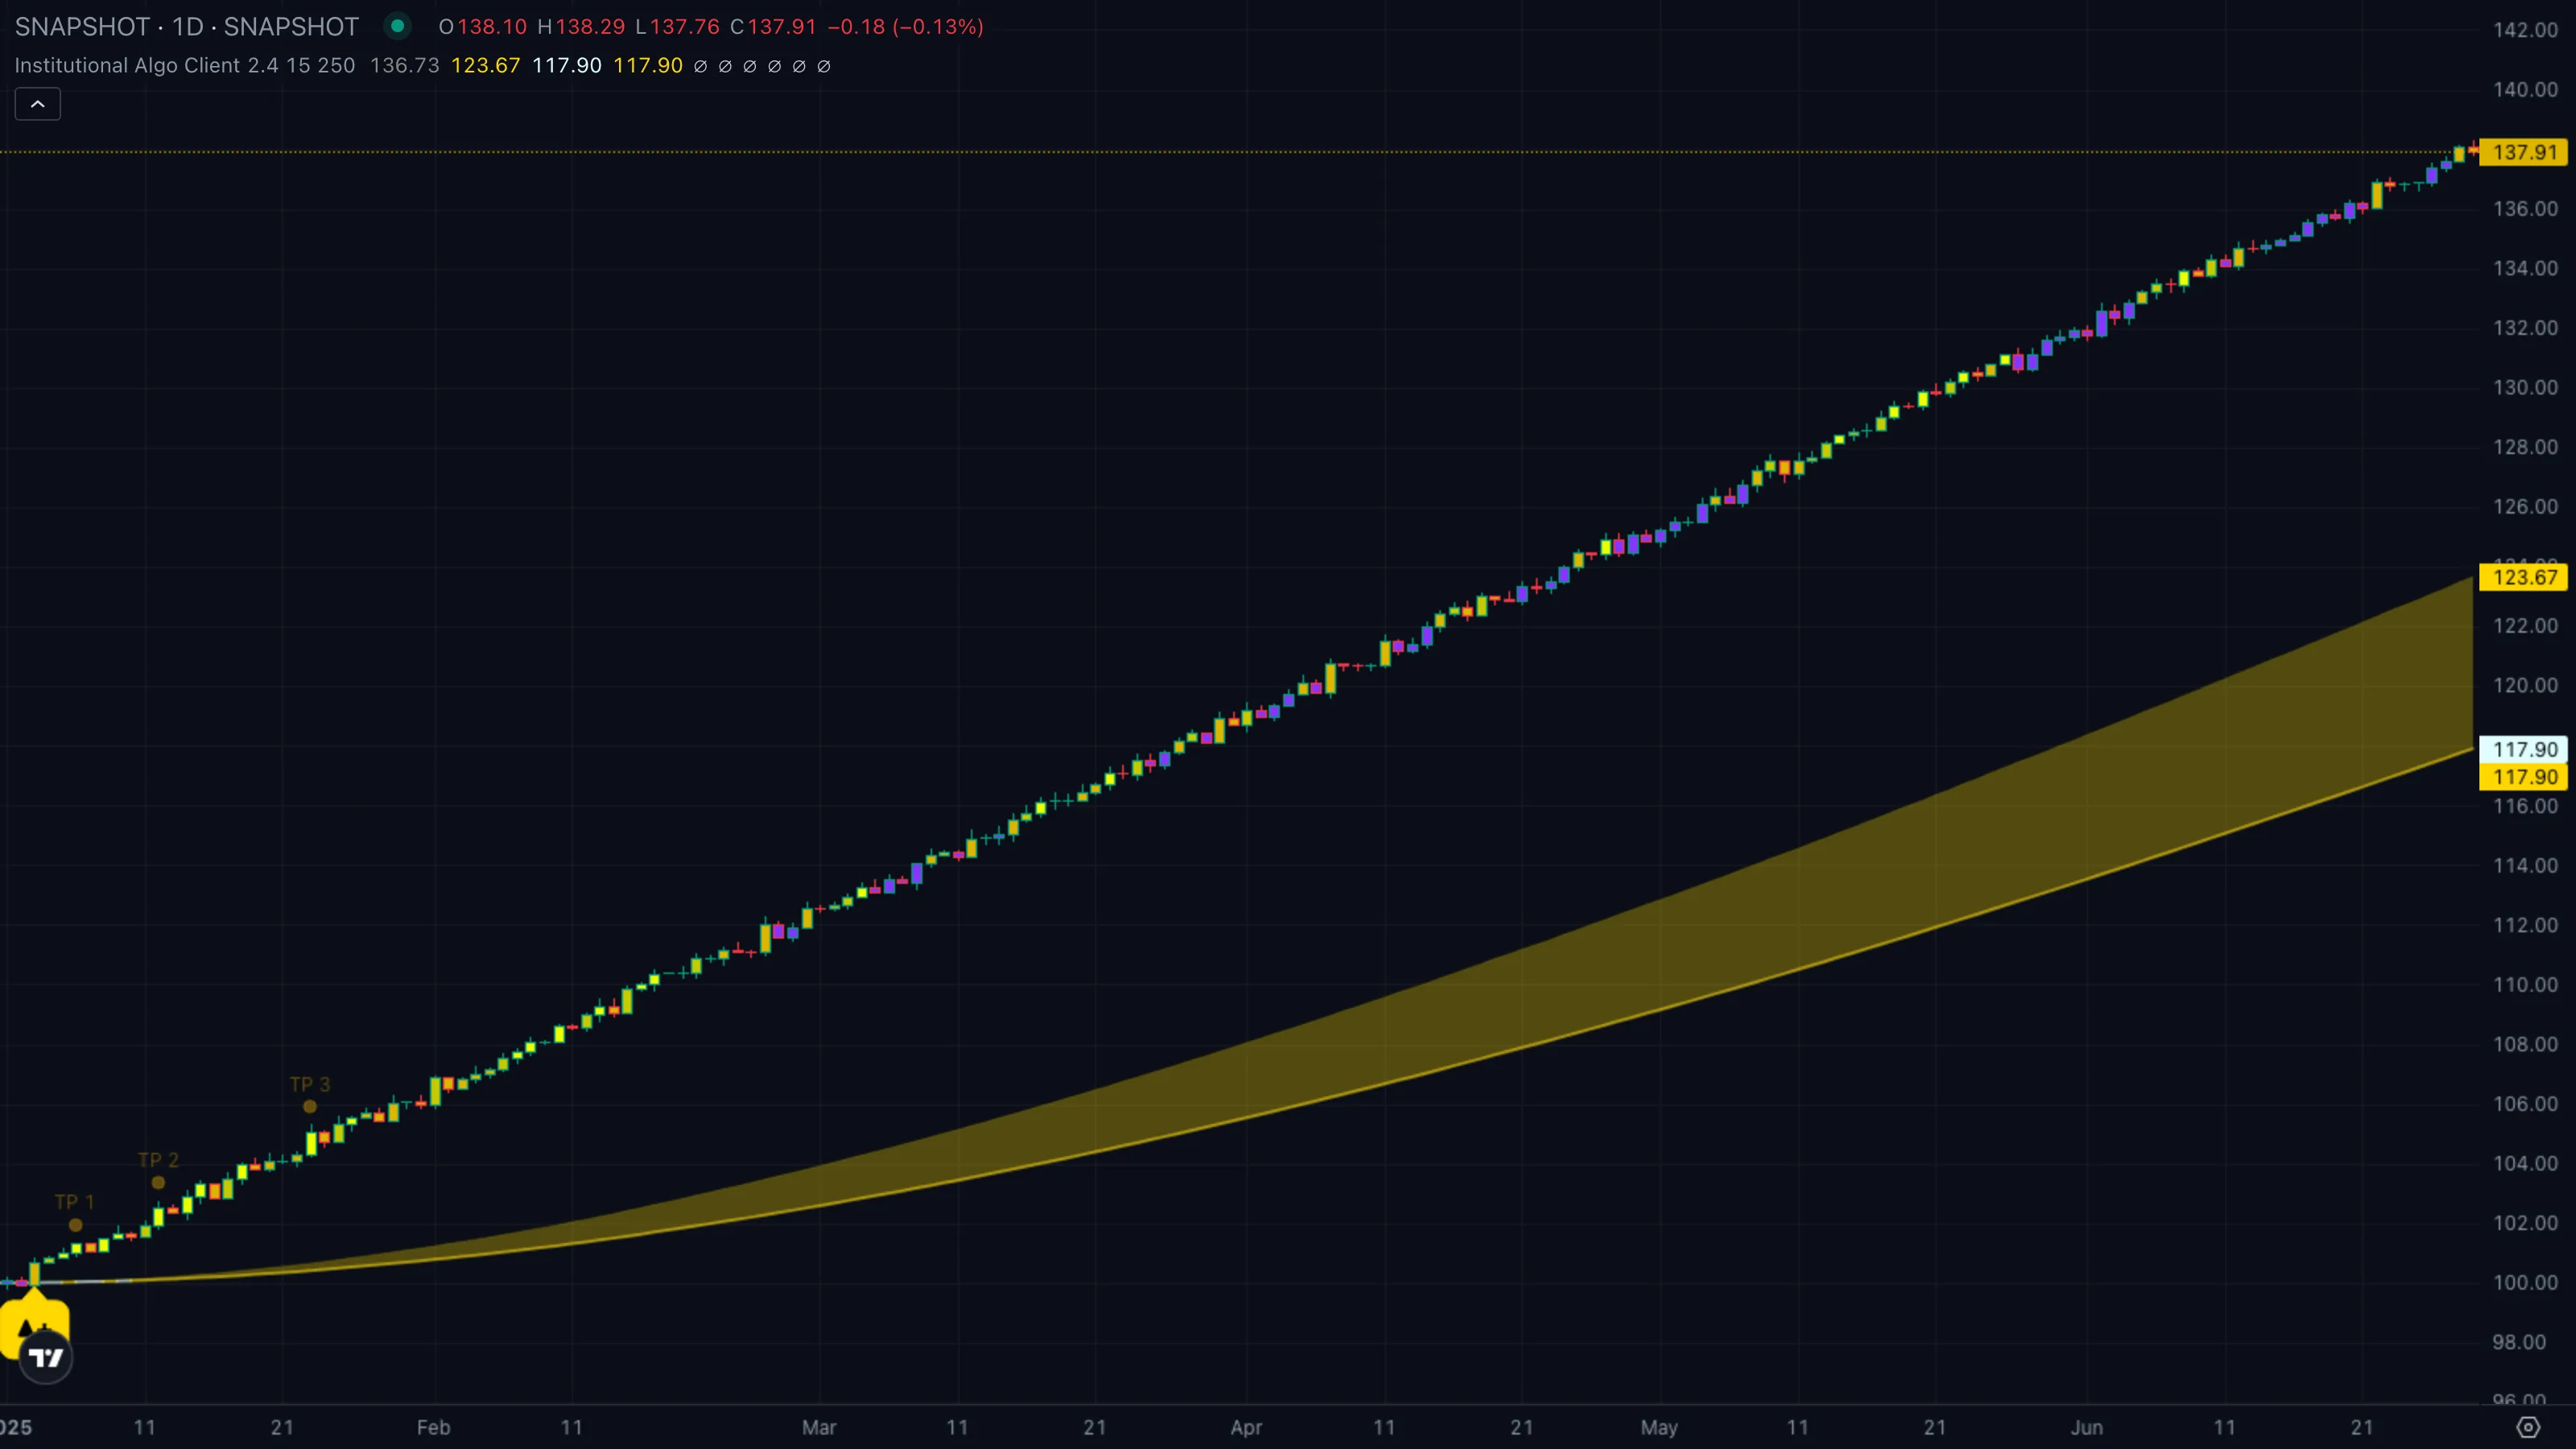
| What you see | ① Price ranges sideways for a long stretch ② cloud edges sit close together, often flat ③ a Buy callout fires near the bottom of the range, frequently graded Strong as price reclaims the 200 EMAExponential Moving AverageA moving average that weights recent bars more heavily than old ones, so it reacts faster to fresh price action than a simple average of the same length.Click for full definition →. |
| What it means | An accumulation phaseAccumulation and DistributionAccumulation is sustained net buying that builds a position quietly. Distribution is the reverse — sustained net selling into strength.Click for full definition → is wrapping up. The desk has been absorbing supplySupply and Demand ZoneA horizontal band drawn at a recent swing extreme where buyers (demand) or sellers (supply) last took control. Treated as likely support or resistance until price closes through it.Click for full definition → inside the range; the Buy at the lower edge is the first public hint that absorption is done and price wants to leave. |
| What to do | Bias long, but enter on the next pullbackPullback (Retracement)A short, counter-trend move within an established trend — buyers (or sellers) momentarily losing ground before the trend resumes. Often the lowest-risk place to enter the trend.Click for full definition → into the lower cloud edge or the Trend Tracer — not at the callout bar itself. The TP1 rung at RSIRelative Strength IndexA 0-to-100 momentum oscillator measuring the size of recent up-bars versus down-bars. Above 70 is hot, below 30 is cold, near 50 is neutral.Click for full definition → 70 is the natural first scale-out. |
Pattern B — DistributionAccumulation and DistributionAccumulation is sustained net buying that builds a position quietly. Distribution is the reverse — sustained net selling into strength.Click for full definition → top
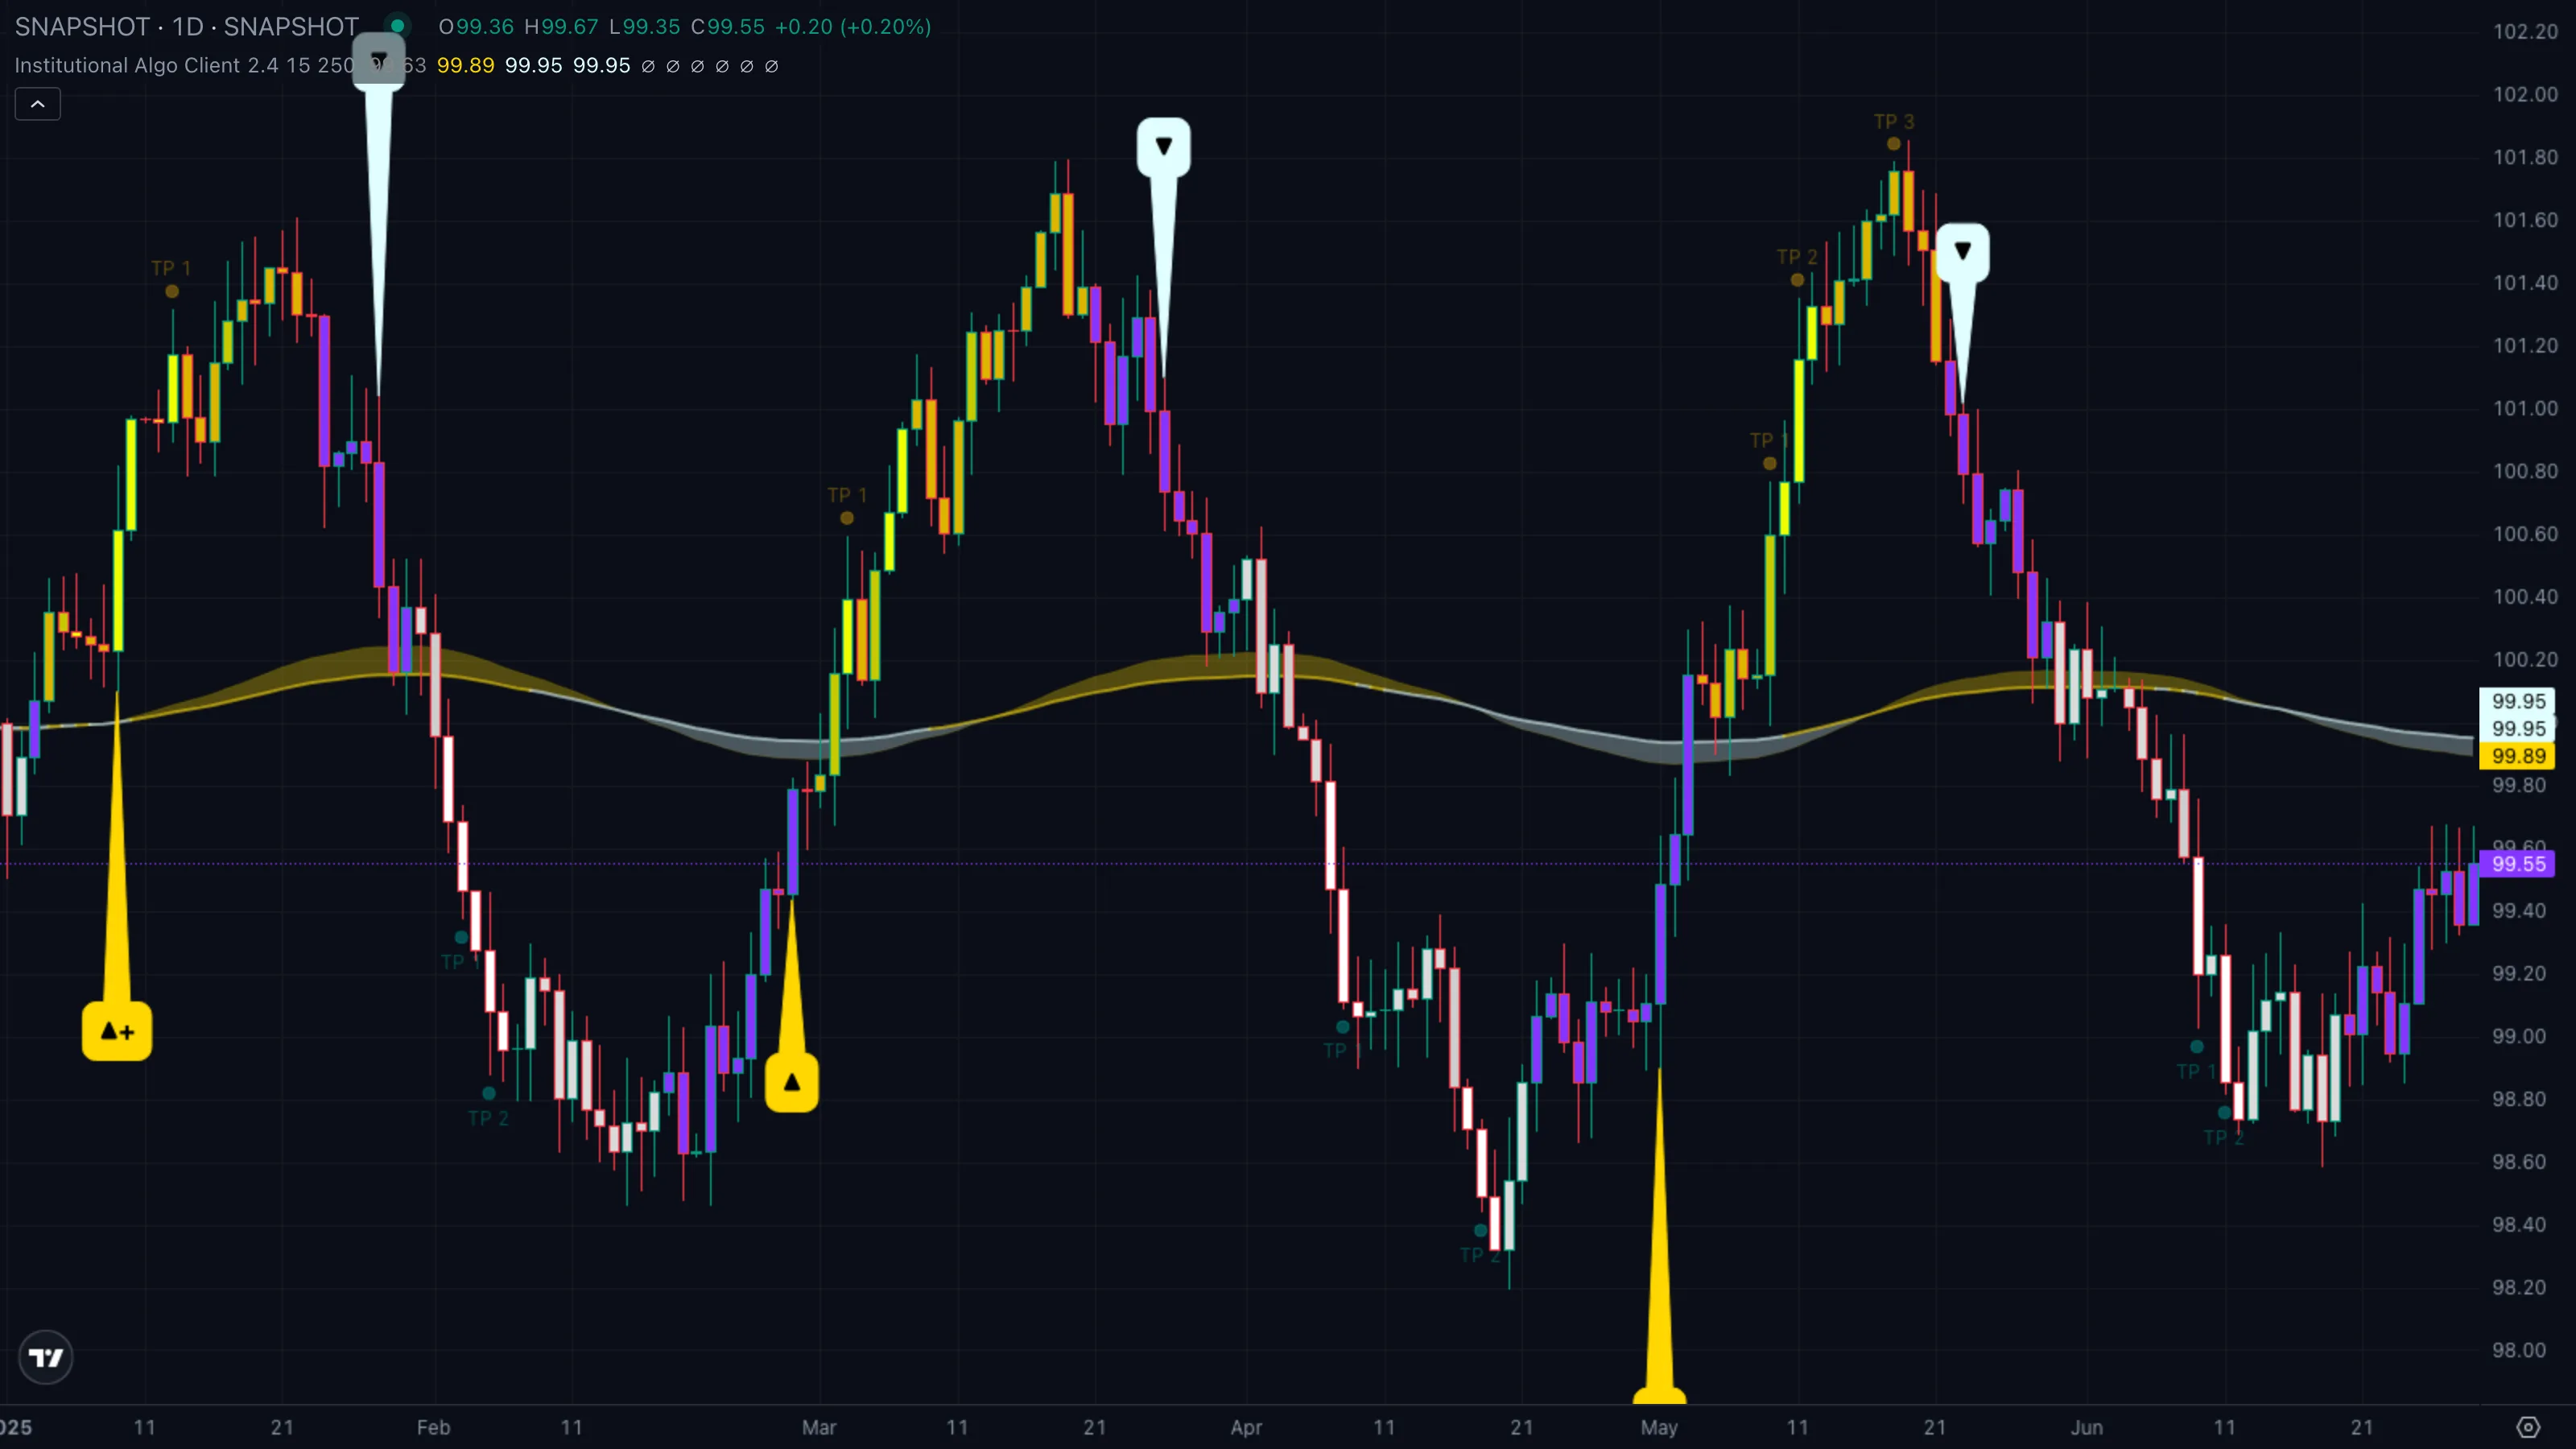
| What you see | ① Price stalls after an extended uptrend ② Trend Tracer flattens and starts to roll over ③ a Strong Sell callout fires as price closes back below the cloud and the 200 EMAExponential Moving AverageA moving average that weights recent bars more heavily than old ones, so it reacts faster to fresh price action than a simple average of the same length.Click for full definition → in the same handful of bars. |
| What it means | A distribution phaseAccumulation and DistributionAccumulation is sustained net buying that builds a position quietly. Distribution is the reverse — sustained net selling into strength.Click for full definition → at the highs. The desk has been quietly handing inventory to late buyers; the Strong Sell is the bar where it stops hiding and lets price go. |
| What to do | Bias short on the first pullbackPullback (Retracement)A short, counter-trend move within an established trend — buyers (or sellers) momentarily losing ground before the trend resumes. Often the lowest-risk place to enter the trend.Click for full definition → into the broken cloud underside. TP1 at RSIRelative Strength IndexA 0-to-100 momentum oscillator measuring the size of recent up-bars versus down-bars. Above 70 is hot, below 30 is cold, near 50 is neutral.Click for full definition → 30 is the first cover; TP2 / TP3 at 25 and 20 catch the deeper flush if the smart moneySmart Money Concepts (SMC)A reading style focused on where institutional players accumulate, displace, and distribute — rather than classical indicator crossovers.Click for full definition → is right. |
Pattern C — DisplacementDisplacementA long-bodied bar that breaks out of a range with conviction. Marks the moment a desk stops hiding and starts pushing price.Click for full definition → / breakout move
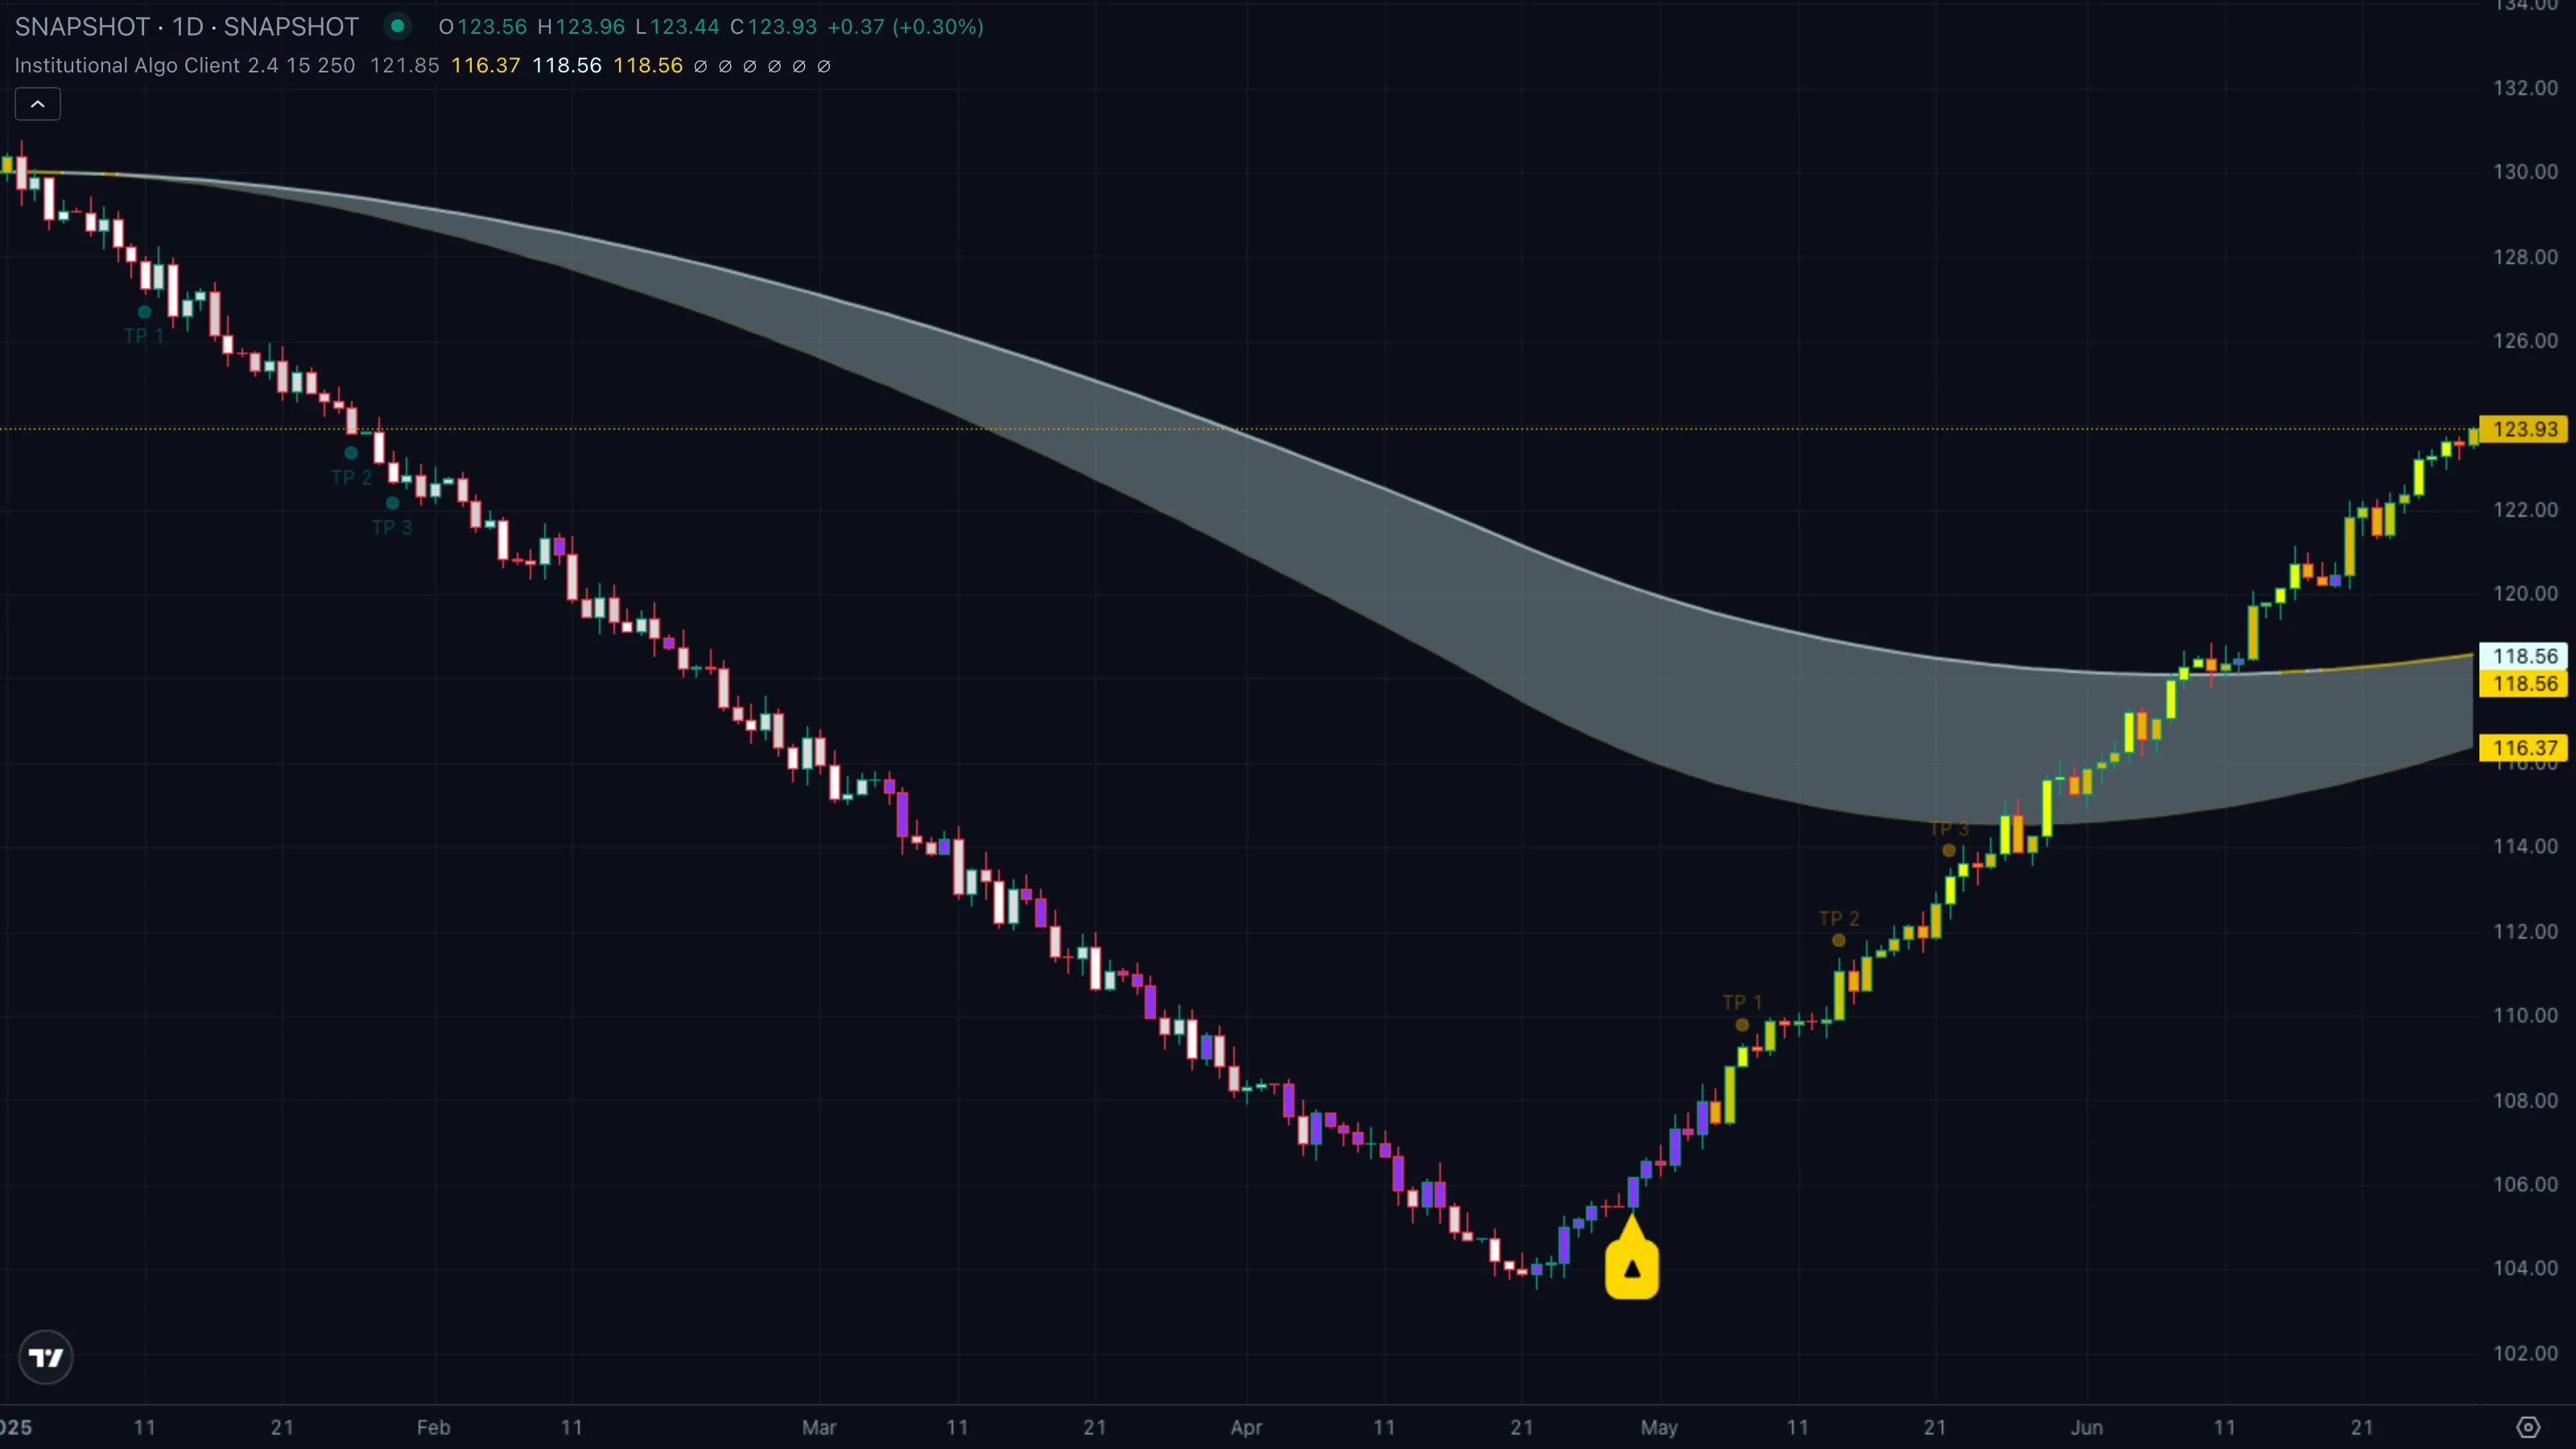
| What you see | ① A long-bodied bar punches clear of the prior range ② the cloud expands as the fast edge pulls away from the slow ③ Smart Panel flips to "Trending" with Institutional Activity Active and a Strong signal prints on the close. |
| What it means | This is the displacementDisplacementA long-bodied bar that breaks out of a range with conviction. Marks the moment a desk stops hiding and starts pushing price.Click for full definition → itself — the bar where the desk shows its hand. The gap between this bar's body and the prior structureMarket StructureThe pattern of swing highs and lows price prints as it moves. Healthy uptrends print higher highs and higher lows; healthy downtrends print the mirror.Click for full definition → is a textbook fair value gapFair Value GapA gap between three consecutive bars where price moved so fast it left an unfilled zone. Markets often revisit it before continuing the trend.Click for full definition → that price often comes back to fill before continuing. |
| What to do | Don't chase the displacement barDisplacementA long-bodied bar that breaks out of a range with conviction. Marks the moment a desk stops hiding and starts pushing price.Click for full definition →. Wait for the first pullbackPullback (Retracement)A short, counter-trend move within an established trend — buyers (or sellers) momentarily losing ground before the trend resumes. Often the lowest-risk place to enter the trend.Click for full definition → into the FVGFair Value GapA gap between three consecutive bars where price moved so fast it left an unfilled zone. Markets often revisit it before continuing the trend.Click for full definition → or the Trend Tracer with the cloud still on your side, then enter. The TP ladder is your roadmap out — at minimum take partials at TP1. |
5. Trade Walkthrough
| Symbol | ETHUSDT |
|---|---|
| Timeframe | 4H |
| Venue | Binance |
| Window | 10 Mar to 22 Mar 2026 |
| Pattern | C — displacementDisplacementA long-bodied bar that breaks out of a range with conviction. Marks the moment a desk stops hiding and starts pushing price.Click for full definition → breakout out of an accumulationAccumulation and DistributionAccumulation is sustained net buying that builds a position quietly. Distribution is the reverse — sustained net selling into strength.Click for full definition → footprint |
A textbook smart-money setup. ETH spent the first half of March chopping between 3,200 and 3,450 — flat cloud, purple bar colours, Smart Panel reading "Ranging" and Institutional Activity "Inactive". Then on 15 March a single 4H bar pushed clean through 3,450 on volume that flipped the panel to "Active". A Strong Buy printed on the close. Over the following four days price ran roughly +9 % to 3,780, and the TP1 / TP2 / TP3 rungs ticked off in order as RSIRelative Strength IndexA 0-to-100 momentum oscillator measuring the size of recent up-bars versus down-bars. Above 70 is hot, below 30 is cold, near 50 is neutral.Click for full definition → worked through 70, 75, 80.
The sequence
| # | When | ETH price | Indicator state | What it tells you |
|---|---|---|---|---|
| ① | 10 Mar to 14 Mar | 3,200 to 3,450 chop | flat cloud, purple bars | Accumulation phaseAccumulation and DistributionAccumulation is sustained net buying that builds a position quietly. Distribution is the reverse — sustained net selling into strength.Click for full definition →. Smart Panel says Ranging, volume tame. |
| ② | 15 Mar | ~3,470 close | Strong Buy fires | Displacement barDisplacementA long-bodied bar that breaks out of a range with conviction. Marks the moment a desk stops hiding and starts pushing price.Click for full definition →. Price closes back above SupertrendSupertrendA trailing line set above or below price using an ATR multiple. When close crosses it, the line flips to the opposite side and signals a regime change.Click for full definition → AND the 200 EMAExponential Moving AverageA moving average that weights recent bars more heavily than old ones, so it reacts faster to fresh price action than a simple average of the same length.Click for full definition →, cloud already gold. |
| ③ | 16 Mar | ~3,520 retrace | Trend Tracer holds | First pullbackPullback (Retracement)A short, counter-trend move within an established trend — buyers (or sellers) momentarily losing ground before the trend resumes. Often the lowest-risk place to enter the trend.Click for full definition → into the Tracer / FVGFair Value GapA gap between three consecutive bars where price moved so fast it left an unfilled zone. Markets often revisit it before continuing the trend.Click for full definition →. The real entry. |
| ④ | 18 Mar to 20 Mar | 3,650 to 3,780 | TP1 then TP2 print | RSIRelative Strength IndexA 0-to-100 momentum oscillator measuring the size of recent up-bars versus down-bars. Above 70 is hot, below 30 is cold, near 50 is neutral.Click for full definition → ladder ticks off in order. Cue to scale out and tighten. |
The trade in one card
| What you skipped | Market-buying the displacement barDisplacementA long-bodied bar that breaks out of a range with conviction. Marks the moment a desk stops hiding and starts pushing price.Click for full definition → at 3,470. Within hours price retraced to 3,520 — the chase entry was offside almost immediately. |
| What you took | PullbackPullback (Retracement)A short, counter-trend move within an established trend — buyers (or sellers) momentarily losing ground before the trend resumes. Often the lowest-risk place to enter the trend.Click for full definition → into the Trend Tracer at ~3,520 with the cloud still gold and the Smart Panel reading Trending + Active. |
| Where you exited | Half off at TP1 (~3,650), trailed the rest until TP2 printed (~3,720). |
| Move captured | ~ +5.7 % on the trailed runner in roughly four days, with a defined invalidation under the Tracer. |
Lesson
The Strong Buy callout gives you the alert. The first pullbackPullback (Retracement)A short, counter-trend move within an established trend — buyers (or sellers) momentarily losing ground before the trend resumes. Often the lowest-risk place to enter the trend.Click for full definition → that holds the Trend Tracer, with the cloud still gold and the panel still Active, gives you the trade. The TP ladder tells you where the desk is statistically taking profit — use it as your scaling map, not a target to argue with.
6. Common Pitfalls
- Trading every Normal signal in a chop regime. When the Smart Panel reads "Ranging" or "No trend", Normal Buys and Sells will print at every twitch through the SupertrendSupertrendA trailing line set above or below price using an ATR multiple. When close crosses it, the line flips to the opposite side and signals a regime change.Click for full definition →. Wait for Strong-graded signals or skip the ticker entirely until the panel commits.
- Confusing the Trend Tracer flip with a regime change. The Tracer recolours by comparing close vs close 8 bars ago. In a sharp pullbackPullback (Retracement)A short, counter-trend move within an established trend — buyers (or sellers) momentarily losing ground before the trend resumes. Often the lowest-risk place to enter the trend.Click for full definition → inside an uptrend the Tracer can briefly turn cyan even though the Cloud is still gold. The cloud is the regime; the Tracer is the pulse — when they disagree, trust the cloud.
- Chasing the displacement barDisplacementA long-bodied bar that breaks out of a range with conviction. Marks the moment a desk stops hiding and starts pushing price.Click for full definition →. The bar where a Strong signal prints is also the bar with the worst risk/reward — your stop has to sit miles away and price almost always retraces partway into the move. Wait for the pullbackPullback (Retracement)A short, counter-trend move within an established trend — buyers (or sellers) momentarily losing ground before the trend resumes. Often the lowest-risk place to enter the trend.Click for full definition →.
- Treating TP rungs as exit targets you must hit. The TP ladder fires off RSIRelative Strength IndexA 0-to-100 momentum oscillator measuring the size of recent up-bars versus down-bars. Above 70 is hot, below 30 is cold, near 50 is neutral.Click for full definition → thresholds, not price targets. If RSIRelative Strength IndexA 0-to-100 momentum oscillator measuring the size of recent up-bars versus down-bars. Above 70 is hot, below 30 is cold, near 50 is neutral.Click for full definition → never reaches 70 the rung never prints — that's the indicator telling you the move ran out of momentum. Use TPs as scale-out cues, not orders to set blindly.
- Reading the Smart Panel out of context. Institutional Activity = "Active" only means current-bar volume crossed the 21-bar average — it confirms a move, it doesn't predict one. Pair it with the cloud and the signal grade; alone it's just a volume light.
- Forgetting the gap behind the displacementDisplacementA long-bodied bar that breaks out of a range with conviction. Marks the moment a desk stops hiding and starts pushing price.Click for full definition →. A clean displacementDisplacementA long-bodied bar that breaks out of a range with conviction. Marks the moment a desk stops hiding and starts pushing price.Click for full definition → leaves a fair value gapFair Value GapA gap between three consecutive bars where price moved so fast it left an unfilled zone. Markets often revisit it before continuing the trend.Click for full definition → that markets routinely revisit. If you took the trade and price retraces to fill the FVGFair Value GapA gap between three consecutive bars where price moved so fast it left an unfilled zone. Markets often revisit it before continuing the trend.Click for full definition → with the cloud still on your side, that's usually opportunity, not invalidation. The structureMarket StructureThe pattern of swing highs and lows price prints as it moves. Healthy uptrends print higher highs and higher lows; healthy downtrends print the mirror.Click for full definition → breaks when the cloud flips, not when the gap fills.