

MOM Algo V15
A mechanical buy/sell engine that prints the entry, the stop, and three take-profit ladders right on your chart so the only decision left is whether to take the trade.
1. What This Indicator Watches For
Most retail traders don't lose because their analysis is wrong. They lose because they hesitate — they see the setup, miss the entry, then chase. The remedy isn't more analysis; it's a written plan that names the trigger, the stop, and the exits before the bar even prints.
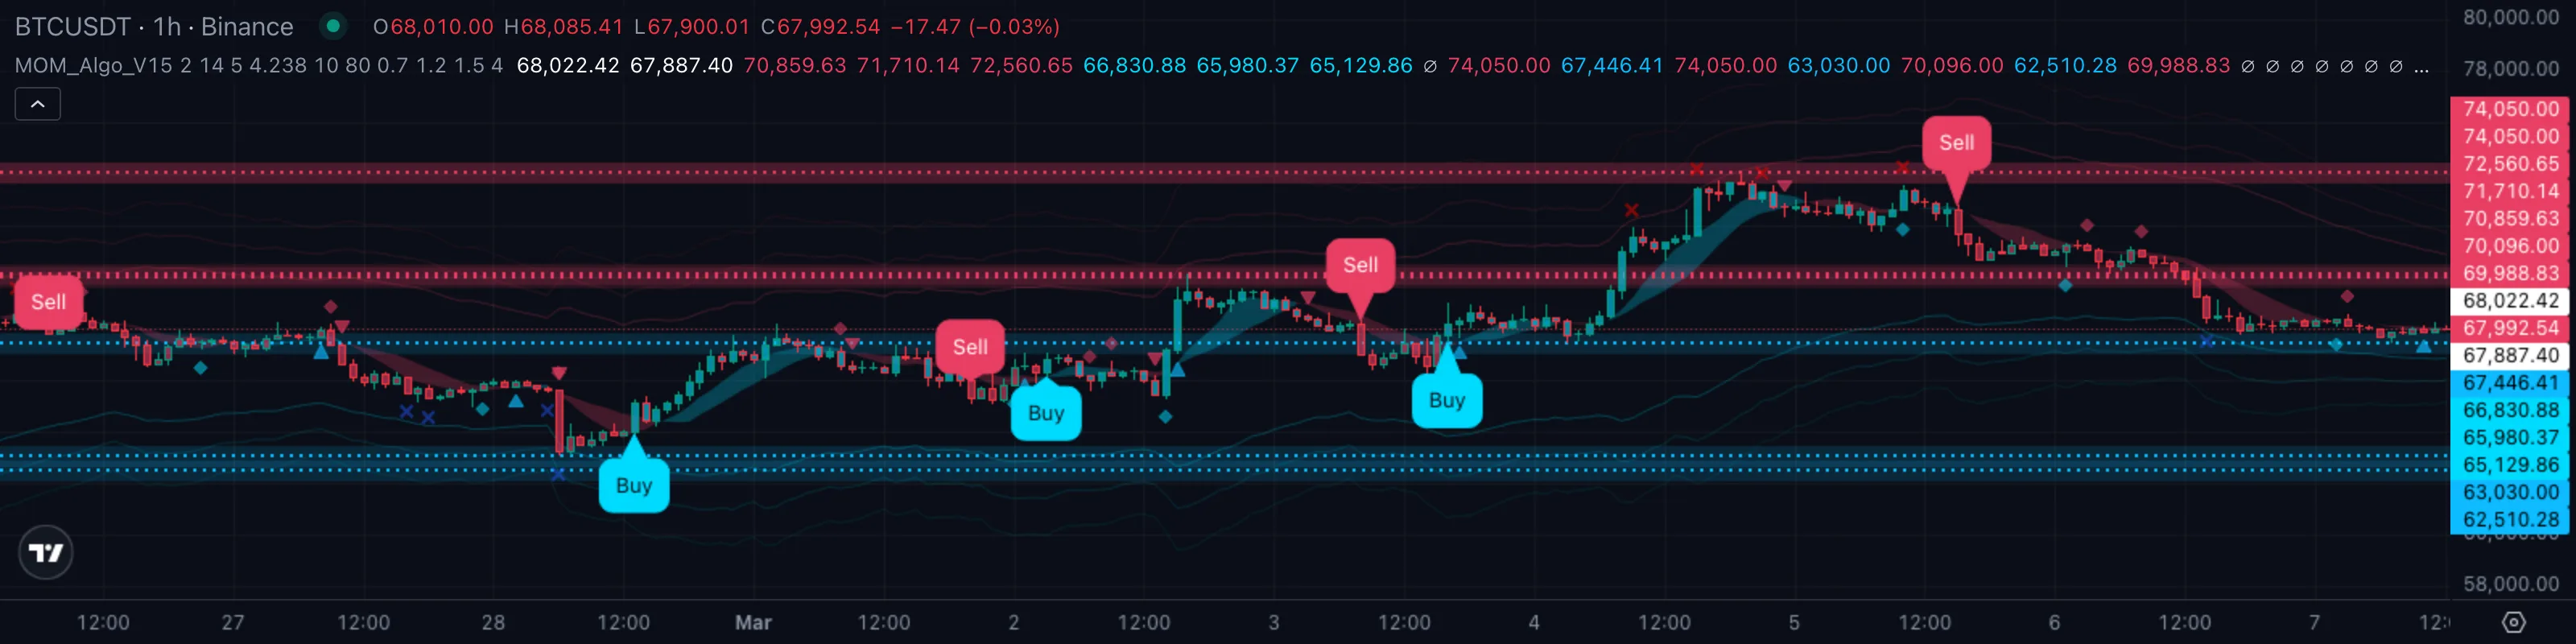
MOM Algo V15 is built around that idea. It runs a SupertrendSupertrendA trailing line set above or below price using an ATR multiple. When close crosses it, the line flips to the opposite side and signals a regime change.Click for full definition → engine in the background, and every time the engine flips it stamps a Buy or Sell pill directly on the bar that triggered the change. The same flip writes a stop level, a TP1, a TP2, and a TP3 onto the chart automatically — the entire trade plan exists the moment the signal fires. Layered on top are a trend ribbon, a KeltnerKeltner ChannelA price envelope built from a moving-average centreline with rails offset by multiples of ATR. Wider rails mark zones where price has historically run out of room before reverting.Click for full definition →-channel volatility envelope, eight pivotPivot High / Pivot LowA bar that is higher (or lower) than a defined number of bars on both sides. Confirmed only after the right-hand bars print without breaking it.Click for full definition →-based support and resistance lines, and a second-opinion reversal layer (diamonds and triangles) so you can see at a glance whether the broader picture agrees with the signal.
The point isn't to remove trader judgement — it's to remove the bookkeeping part of trading so judgement is the only thing left to apply.
2. How It Works Under the Hood
Three engines run side by side:
- The SupertrendSupertrendA trailing line set above or below price using an ATR multiple. When close crosses it, the line flips to the opposite side and signals a regime change.Click for full definition → core. A SupertrendSupertrendA trailing line set above or below price using an ATR multiple. When close crosses it, the line flips to the opposite side and signals a regime change.Click for full definition → line based on ATRAverage True RangeA measure of typical bar-to-bar volatility. ATR rises when bars get bigger; many indicators use it as a noise floor — they only fire when a move clears a multiple of ATR.Click for full definition → with a user-set sensitivity (default 2) tracks the dominant directional bias. When price closes back through it from below, the indicator fires a Buy; from above, a Sell. That single crossover is what every TP/SL number on the chart is anchoredAnchored VWAPA VWAP that begins at a chosen pivot bar (a swing high or swing low) and runs forward. Anchoring makes the absolute level meaningful instead of drifting with whatever bars happen to load.Click for full definition → to.
- The trend ribbon. A short SMASimple Moving AverageThe plain arithmetic mean of the last N closing prices. Reacts slower than an EMA of the same length because every bar in the window has equal weight.Click for full definition → (length 7) and a longer SMASimple Moving AverageThe plain arithmetic mean of the last N closing prices. Reacts slower than an EMA of the same length because every bar in the window has equal weight.Click for full definition → (length 13) painted as a filled band. Cyan fill means the short SMASimple Moving AverageThe plain arithmetic mean of the last N closing prices. Reacts slower than an EMA of the same length because every bar in the window has equal weight.Click for full definition → is on top — short-term momentum is up. Red fill means it's flipped. The ribbon reacts before the SupertrendSupertrendA trailing line set above or below price using an ATR multiple. When close crosses it, the line flips to the opposite side and signals a regime change.Click for full definition → itself.
- The volatility cage. Three KeltnerKeltner ChannelA price envelope built from a moving-average centreline with rails offset by multiples of ATR. Wider rails mark zones where price has historically run out of room before reverting.Click for full definition →-channel bands drawn at progressively wider multiples (4.5, 6.4, 8.3) on top of an EMAExponential Moving AverageA moving average that weights recent bars more heavily than old ones, so it reacts faster to fresh price action than a simple average of the same length.Click for full definition → baseline. They show how stretched price is — a Buy near the lower outer band is in a different risk class than one mid-channel.
How the trade plan picks its numbers. When a signal fires, the indicator answers two questions:
- Where is the stop? ATRAverage True RangeA measure of typical bar-to-bar volatility. ATR rises when bars get bigger; many indicators use it as a noise floor — they only fire when a move clears a multiple of ATR.Click for full definition →(14) times the Risk-To-Reward input (default 4). For a Buy, the stop sits that distance below the trigger bar's low; for a Sell, the same distance above its high.
- Where are the take-profits? Each TP is the entry plus the risk distance multiplied by a ladder (default TP1 = 0.7×, TP2 = 1.2×, TP3 = 1.5×). Cross any TP price and the indicator stamps an X mark on the bar that did it.
The colour falls out of those answers:
| What you're seeing | Signal | Plain English |
|---|---|---|
| Close pushes back above SupertrendSupertrendA trailing line set above or below price using an ATR multiple. When close crosses it, the line flips to the opposite side and signals a regime change.Click for full definition → after being below | 🟢 Buy pill + cyan ribbon + cyan bars | Mechanical long entry, plan already drawn |
| Ribbon and bars are mixed, no fresh pill | 🟡 Hold | No new trigger, sit with the existing trade or stand aside |
| Close pushes back below SupertrendSupertrendA trailing line set above or below price using an ATR multiple. When close crosses it, the line flips to the opposite side and signals a regime change.Click for full definition → after being above | 🔴 Sell pill + red ribbon + red bars | Mechanical short entry, plan already drawn |
When a Buy pill prints, you already know the entry, the stop, and the three exits. Your only job is to decide whether this setup deserves your size.
3. What You See on the Chart
| Element | Looks like | Means |
|---|---|---|
| Buy / Sell pills | Cyan or red rounded labels on the bar | Mechanical entry trigger from the SupertrendSupertrendA trailing line set above or below price using an ATR multiple. When close crosses it, the line flips to the opposite side and signals a regime change.Click for full definition → flip |
| Coloured bars | Cyan candles when above SupertrendSupertrendA trailing line set above or below price using an ATR multiple. When close crosses it, the line flips to the opposite side and signals a regime change.Click for full definition →, red when below | At-a-glance regime read on every bar |
| Trend ribbon | Cyan or red filled band between two SMAs | Short-term momentum confirmation |
| KeltnerKeltner ChannelA price envelope built from a moving-average centreline with rails offset by multiples of ATR. Wider rails mark zones where price has historically run out of room before reverting.Click for full definition → bands | Three pairs of faint red/cyan lines | Volatility envelope, outer bands = stretched |
| Diamonds | Tiny cyan diamond below bar / red diamond above bar | Donchian break, an earlier reversal hint |
| Triangles | Cyan triangle below / red triangle above | RSIRelative Strength IndexA 0-to-100 momentum oscillator measuring the size of recent up-bars versus down-bars. Above 70 is hot, below 30 is cold, near 50 is neutral.Click for full definition →-based reversal exhaustion mark |
| Dotted price lines | Eight horizontal dotted levels at the right edge | PivotPivot High / Pivot LowA bar that is higher (or lower) than a defined number of bars on both sides. Confirmed only after the right-hand bars print without breaking it.Click for full definition →-based support and resistance |
| TP cross marks | Tiny X above or below the bar | Price crossed TP1, TP2, or TP3 — book partials |
Default colour scheme: cyan for bullish state, red for bearish state, with a near-cyan tint on the support/resistance lines. The pills are the hero element — everything else is context.
4. Reading It in 3 Patterns
Pattern A — Clean Buy with full TP ladder
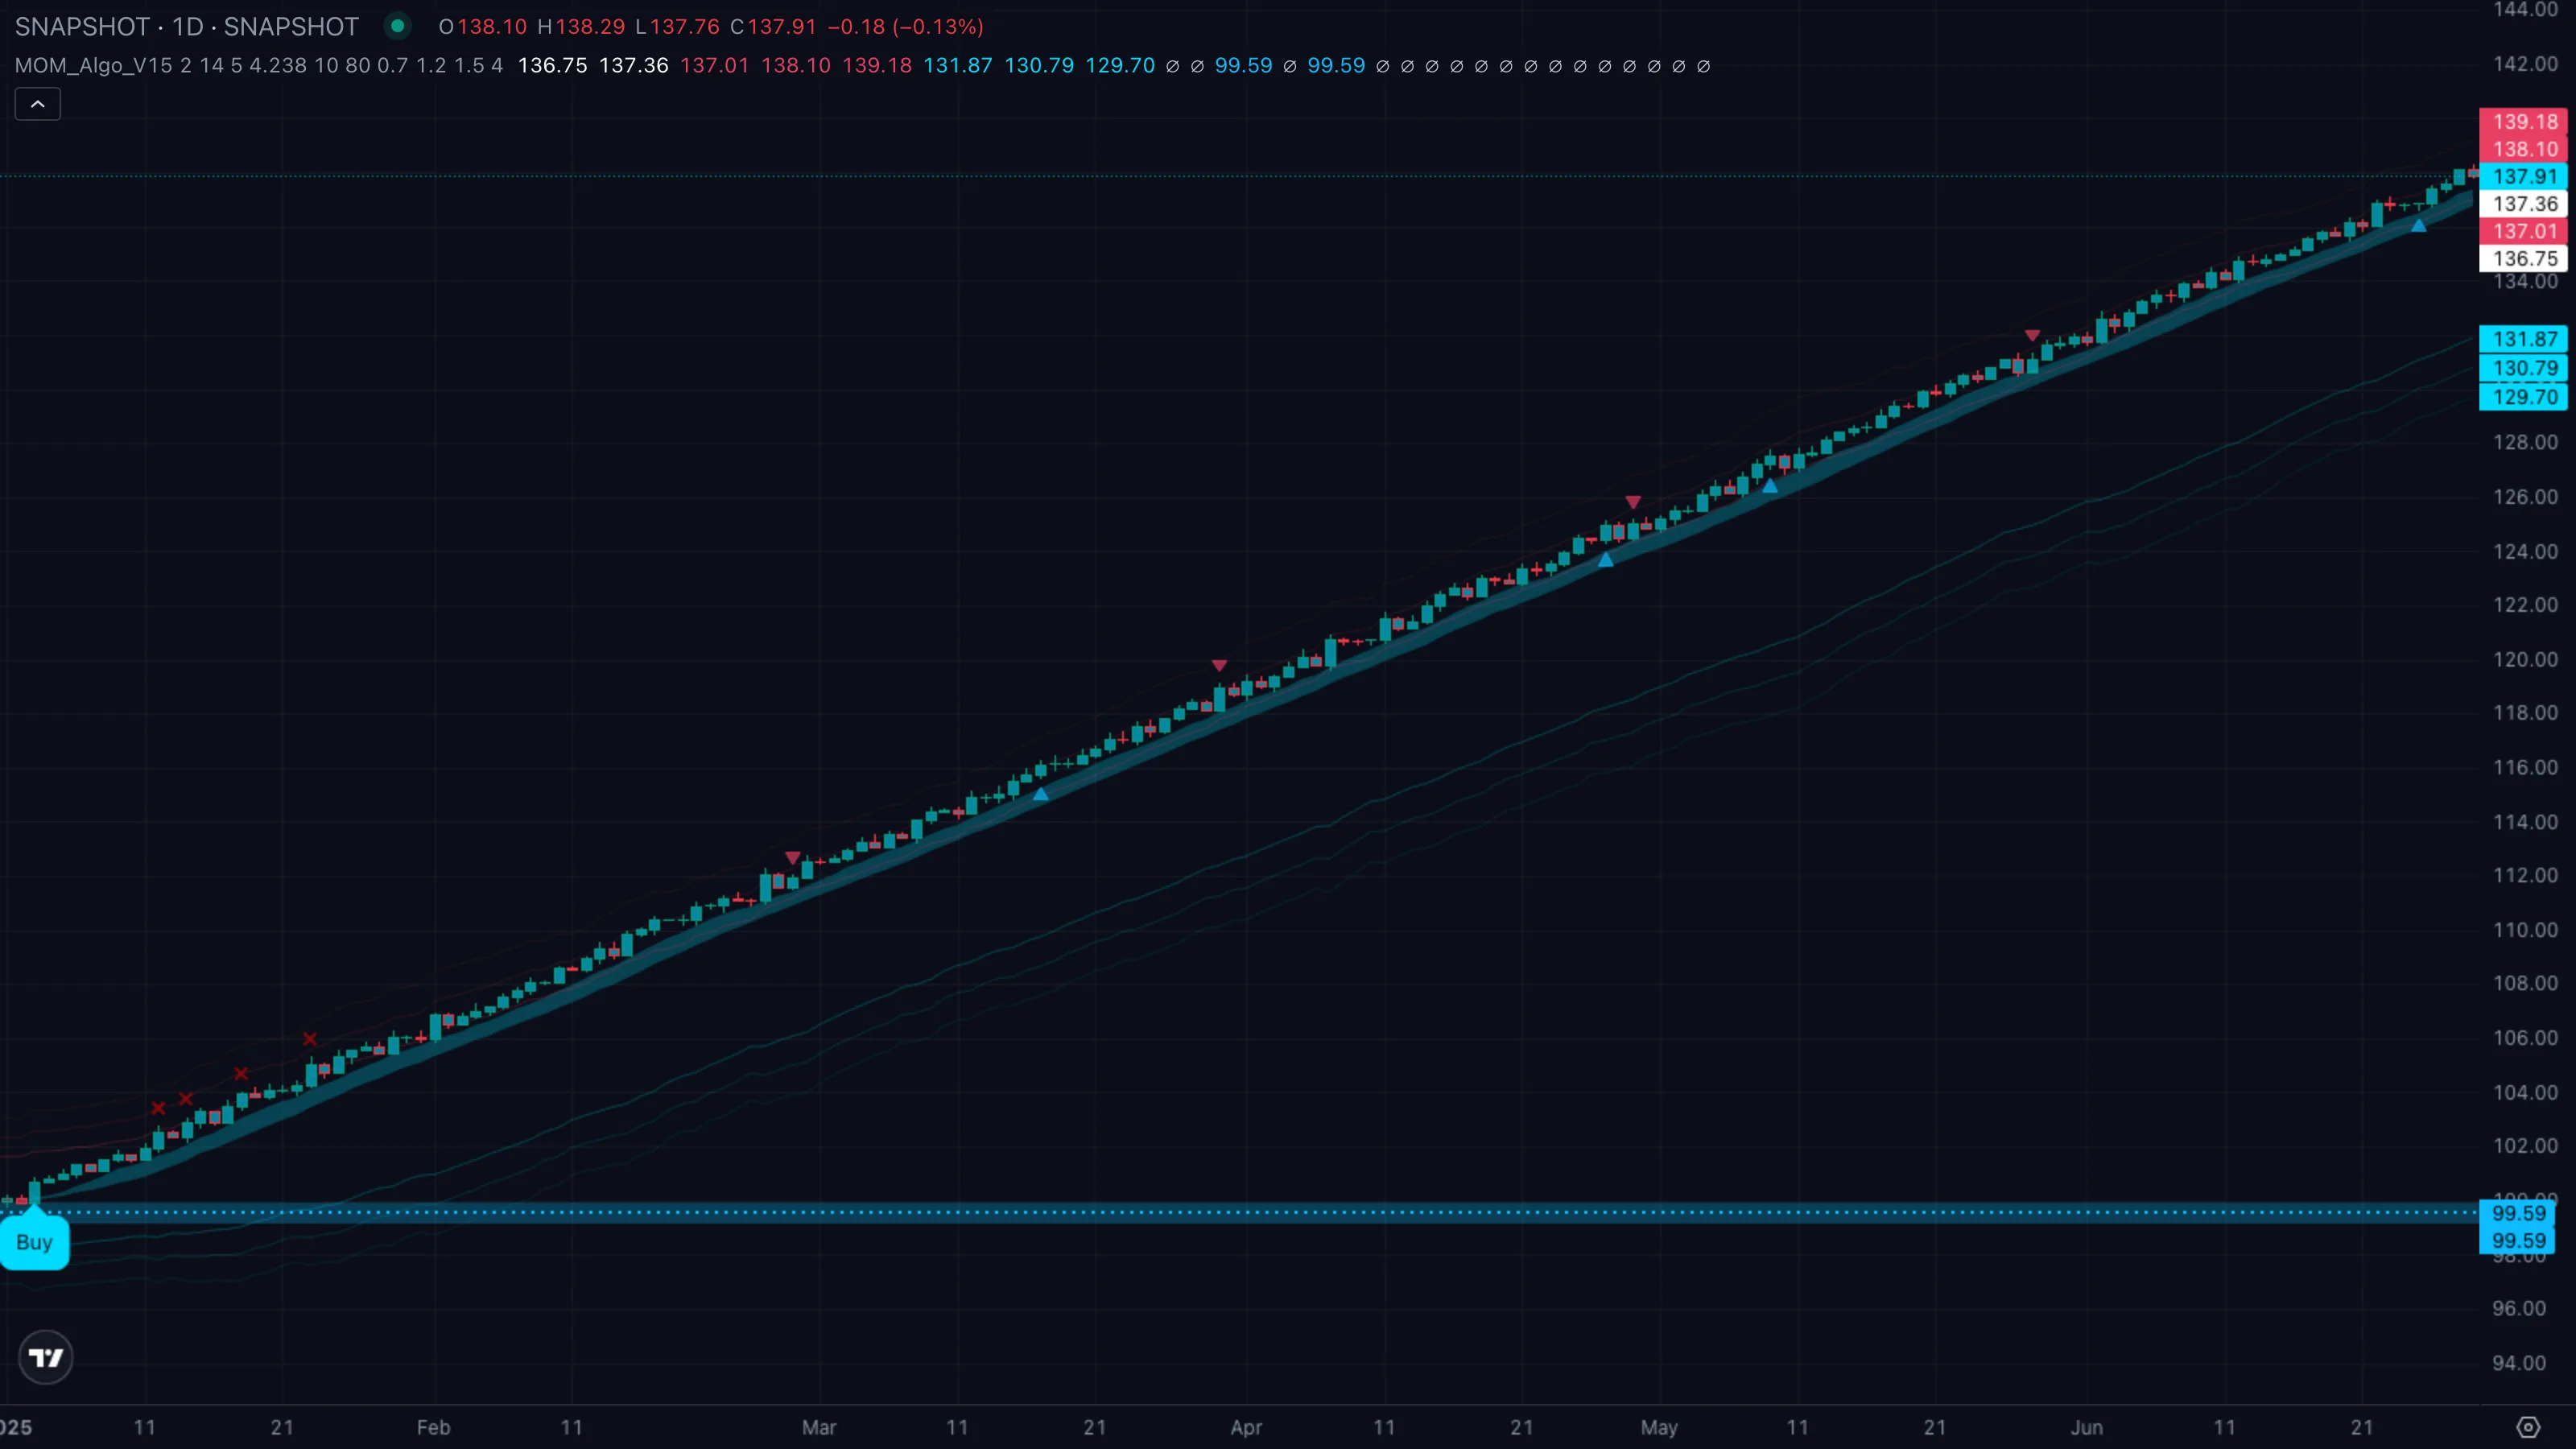
| What you see | ① Cyan Buy pill prints on the flip bar with stop and TP1/TP2/TP3 already drawn ② ribbon and bars both go cyan together ③ price climbs through TP1, then TP2, then TP3, leaving an X mark on each cross. |
| What it means | Textbook mechanical long. SupertrendSupertrendA trailing line set above or below price using an ATR multiple. When close crosses it, the line flips to the opposite side and signals a regime change.Click for full definition →, ribbon, and bar colour all agree, and the move runs far enough to clip every profit ladder before any reversal sign appears. |
| What to do | Enter at the Buy pill or on the first pullbackPullback (Retracement)A short, counter-trend move within an established trend — buyers (or sellers) momentarily losing ground before the trend resumes. Often the lowest-risk place to enter the trend.Click for full definition → into the trend ribbon. Scale out at each TP X mark. Leave the runner until the ribbon flips or a Sell pill prints. |
Pattern B — False Buy stopped out
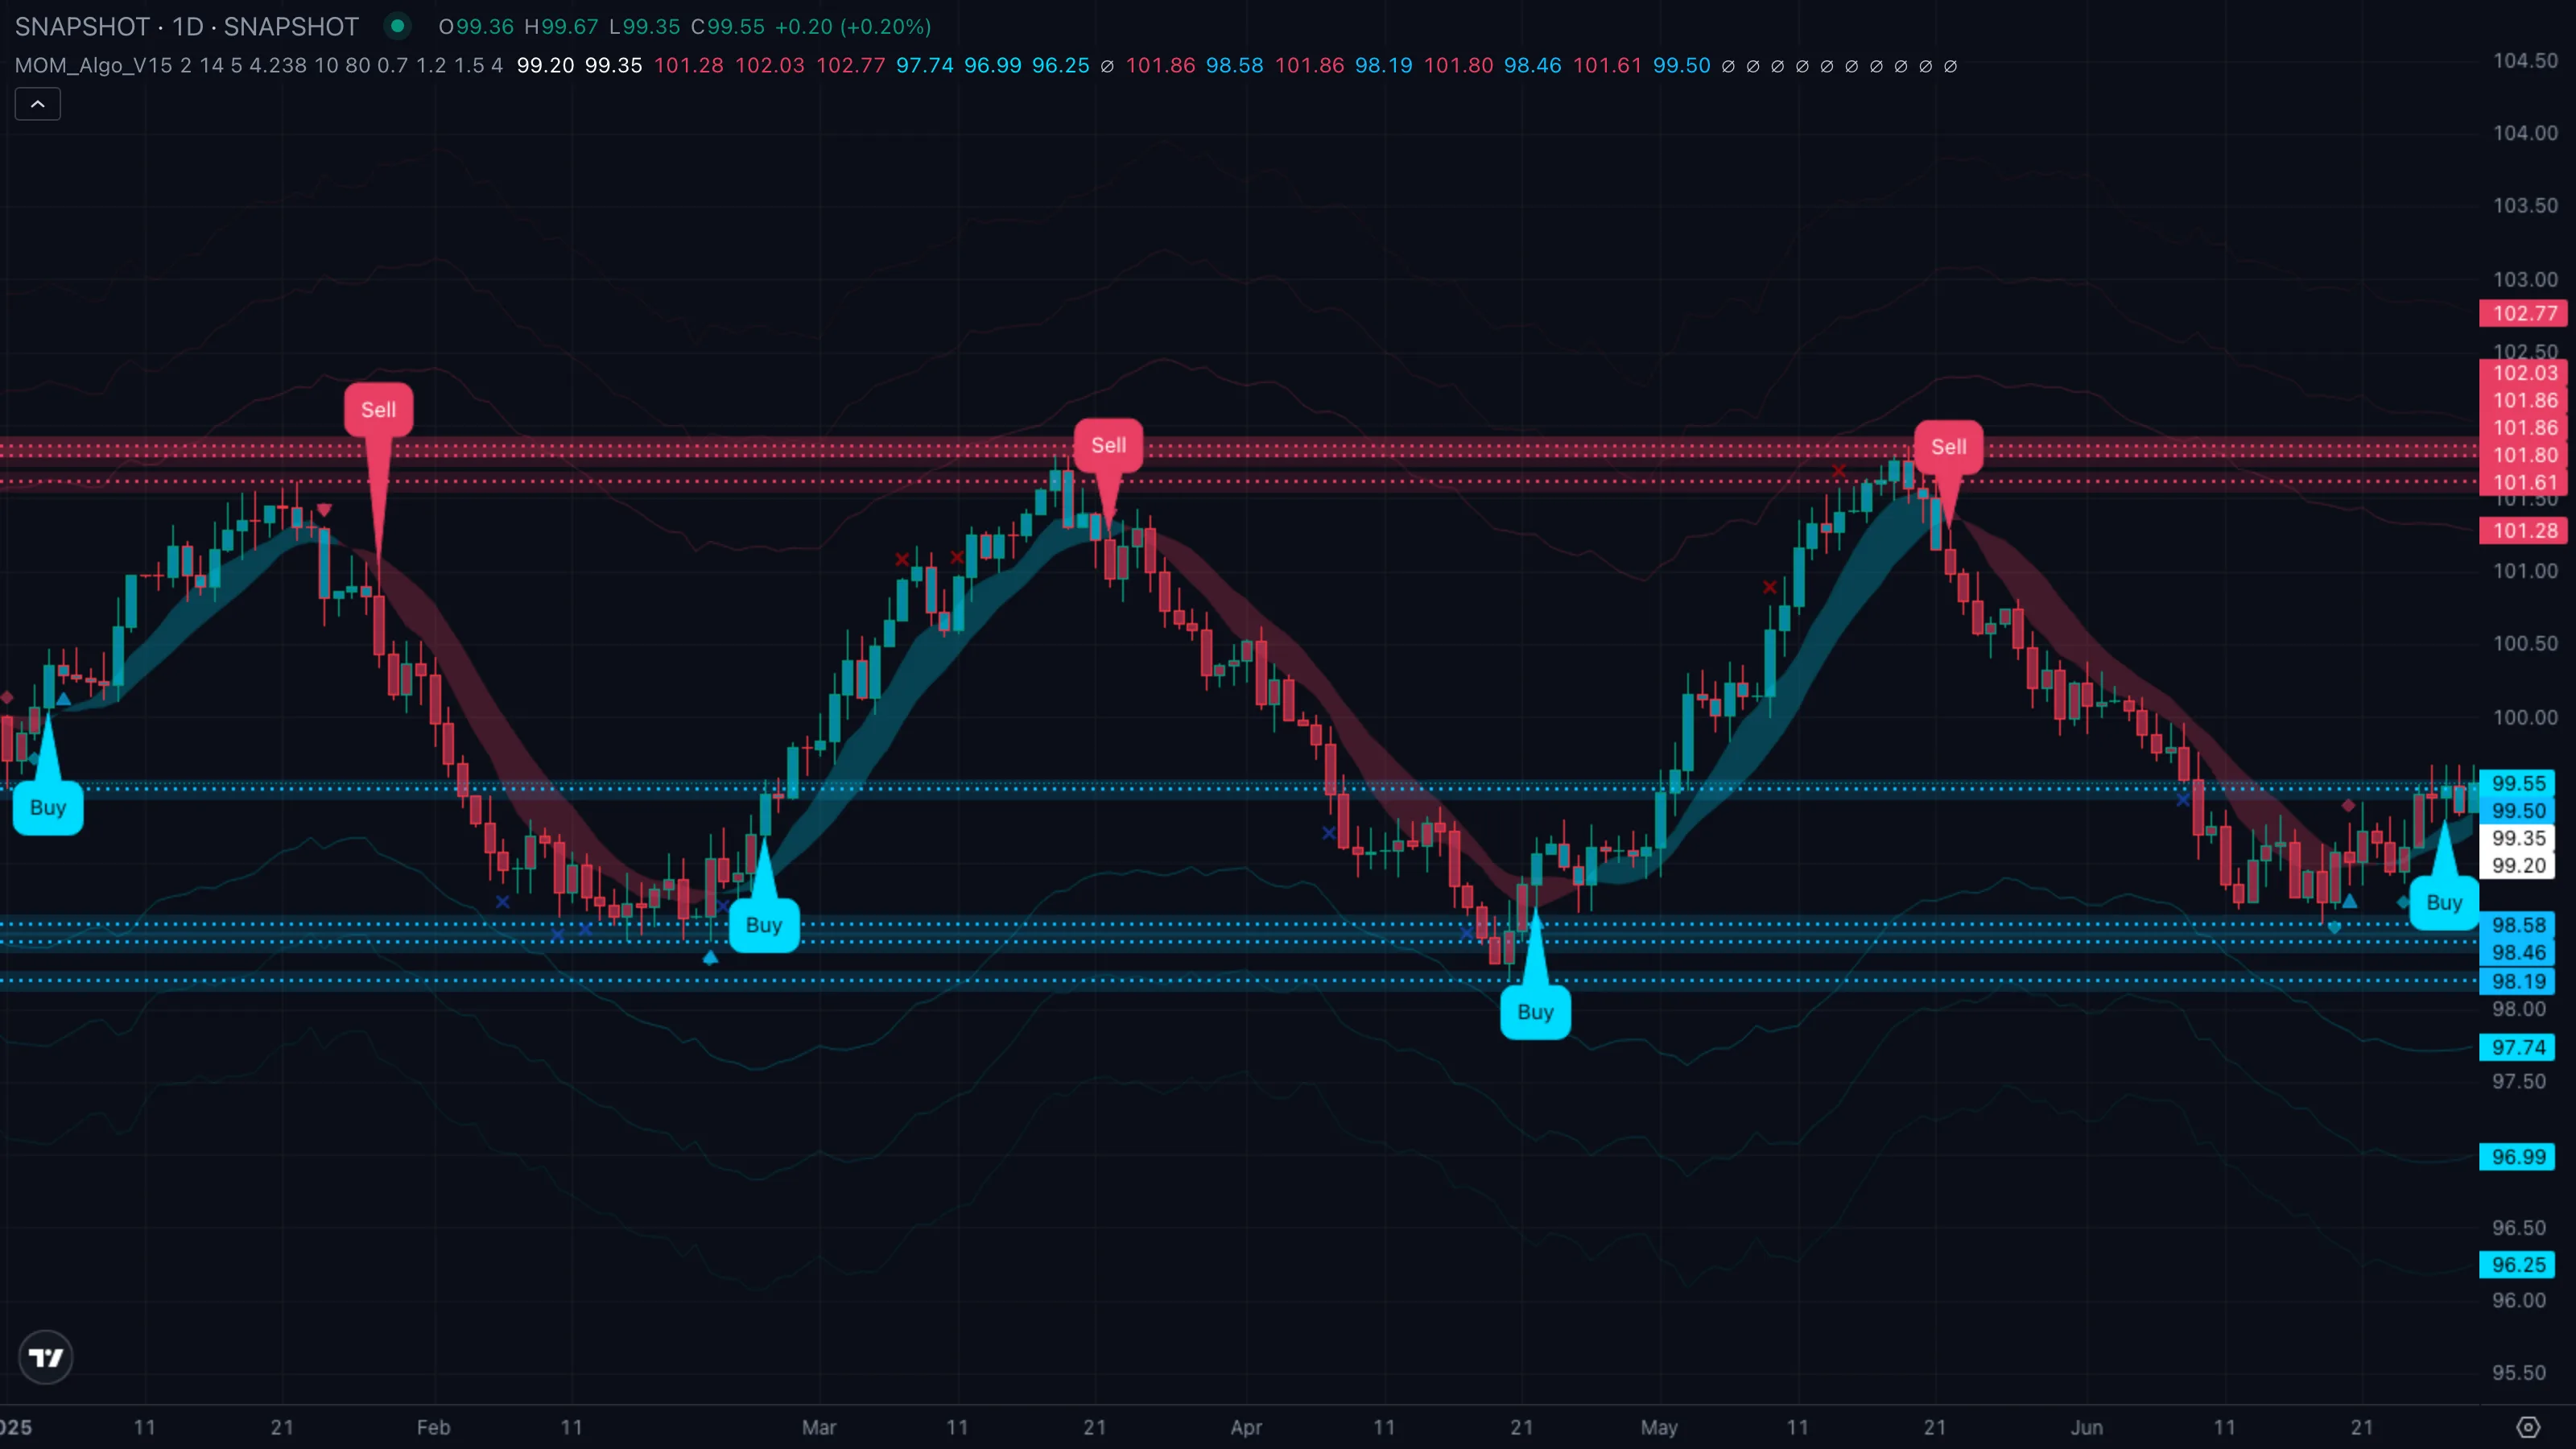
| What you see | ① Cyan Buy pill fires but the ribbon has not committed yet ② bars chop between cyan and red on the next two candles ③ price drops back through the drawn stop level and a red Sell pill prints shortly after. |
| What it means | The SupertrendSupertrendA trailing line set above or below price using an ATR multiple. When close crosses it, the line flips to the opposite side and signals a regime change.Click for full definition → flipped on a single push that the rest of the engine never confirmed. The mechanical stop doing its job — you take a small, defined loss instead of a large undefined one. |
| What to do | Honour the stop without negotiating. The fact that the next pill is a Sell is the indicator telling you the regime really has shifted. Skip the chase, wait for the next clean signal. |
Pattern C — Trend ride through a series of signals
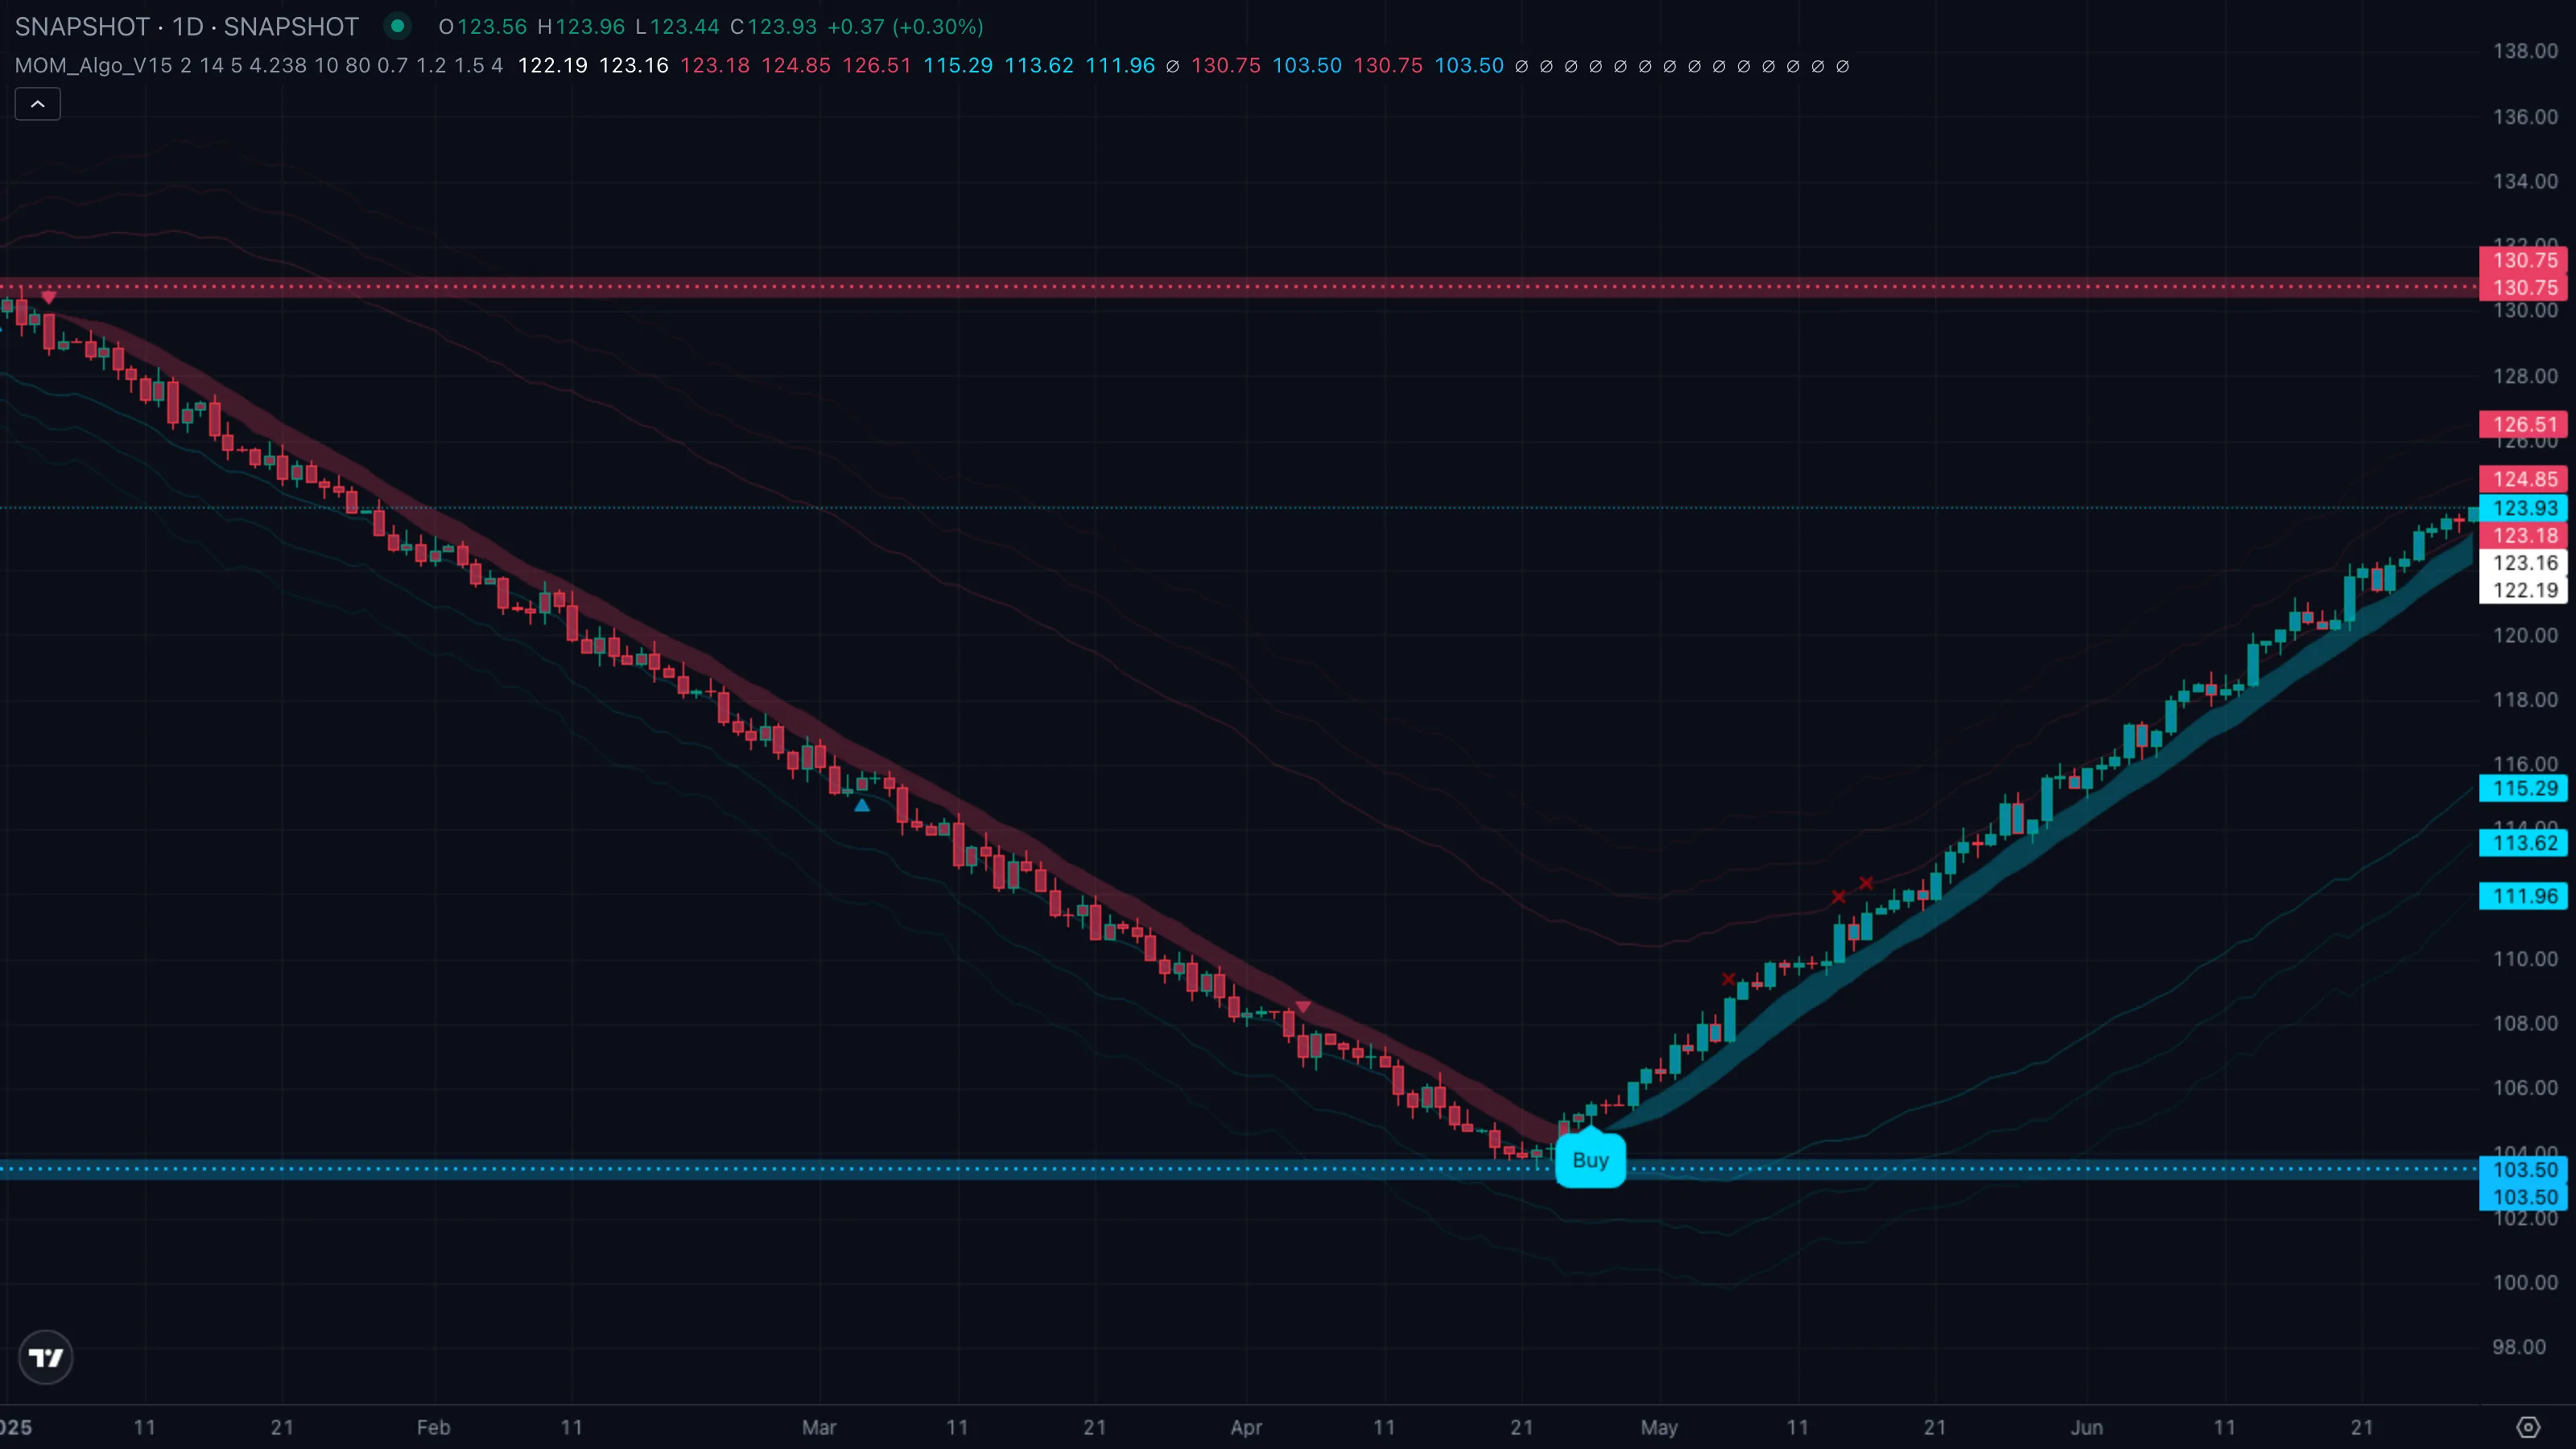
| What you see | ① Initial Buy pill kicks off the move ② diamond and triangle marks appear on shallow pullbacksPullback (Retracement)A short, counter-trend move within an established trend — buyers (or sellers) momentarily losing ground before the trend resumes. Often the lowest-risk place to enter the trend.Click for full definition → but no Sell pill prints ③ trend ribbon stays cyan throughout ④ price keeps tagging TP X marks well beyond TP3. |
| What it means | A real trending leg. The reversal layer is firing warning shots but the core engine is not flipping, so the plan stays alive. The runner is doing its job. |
| What to do | Trail your stop by taking partials at each X mark and leaving the rest. Resist the urge to short the diamond / triangle hints during a confirmed cyan regime — those are pullbackPullback (Retracement)A short, counter-trend move within an established trend — buyers (or sellers) momentarily losing ground before the trend resumes. Often the lowest-risk place to enter the trend.Click for full definition → alerts, not reversal triggers. The exit is the eventual Sell pill, not your nerves. |
5. Trade Walkthrough
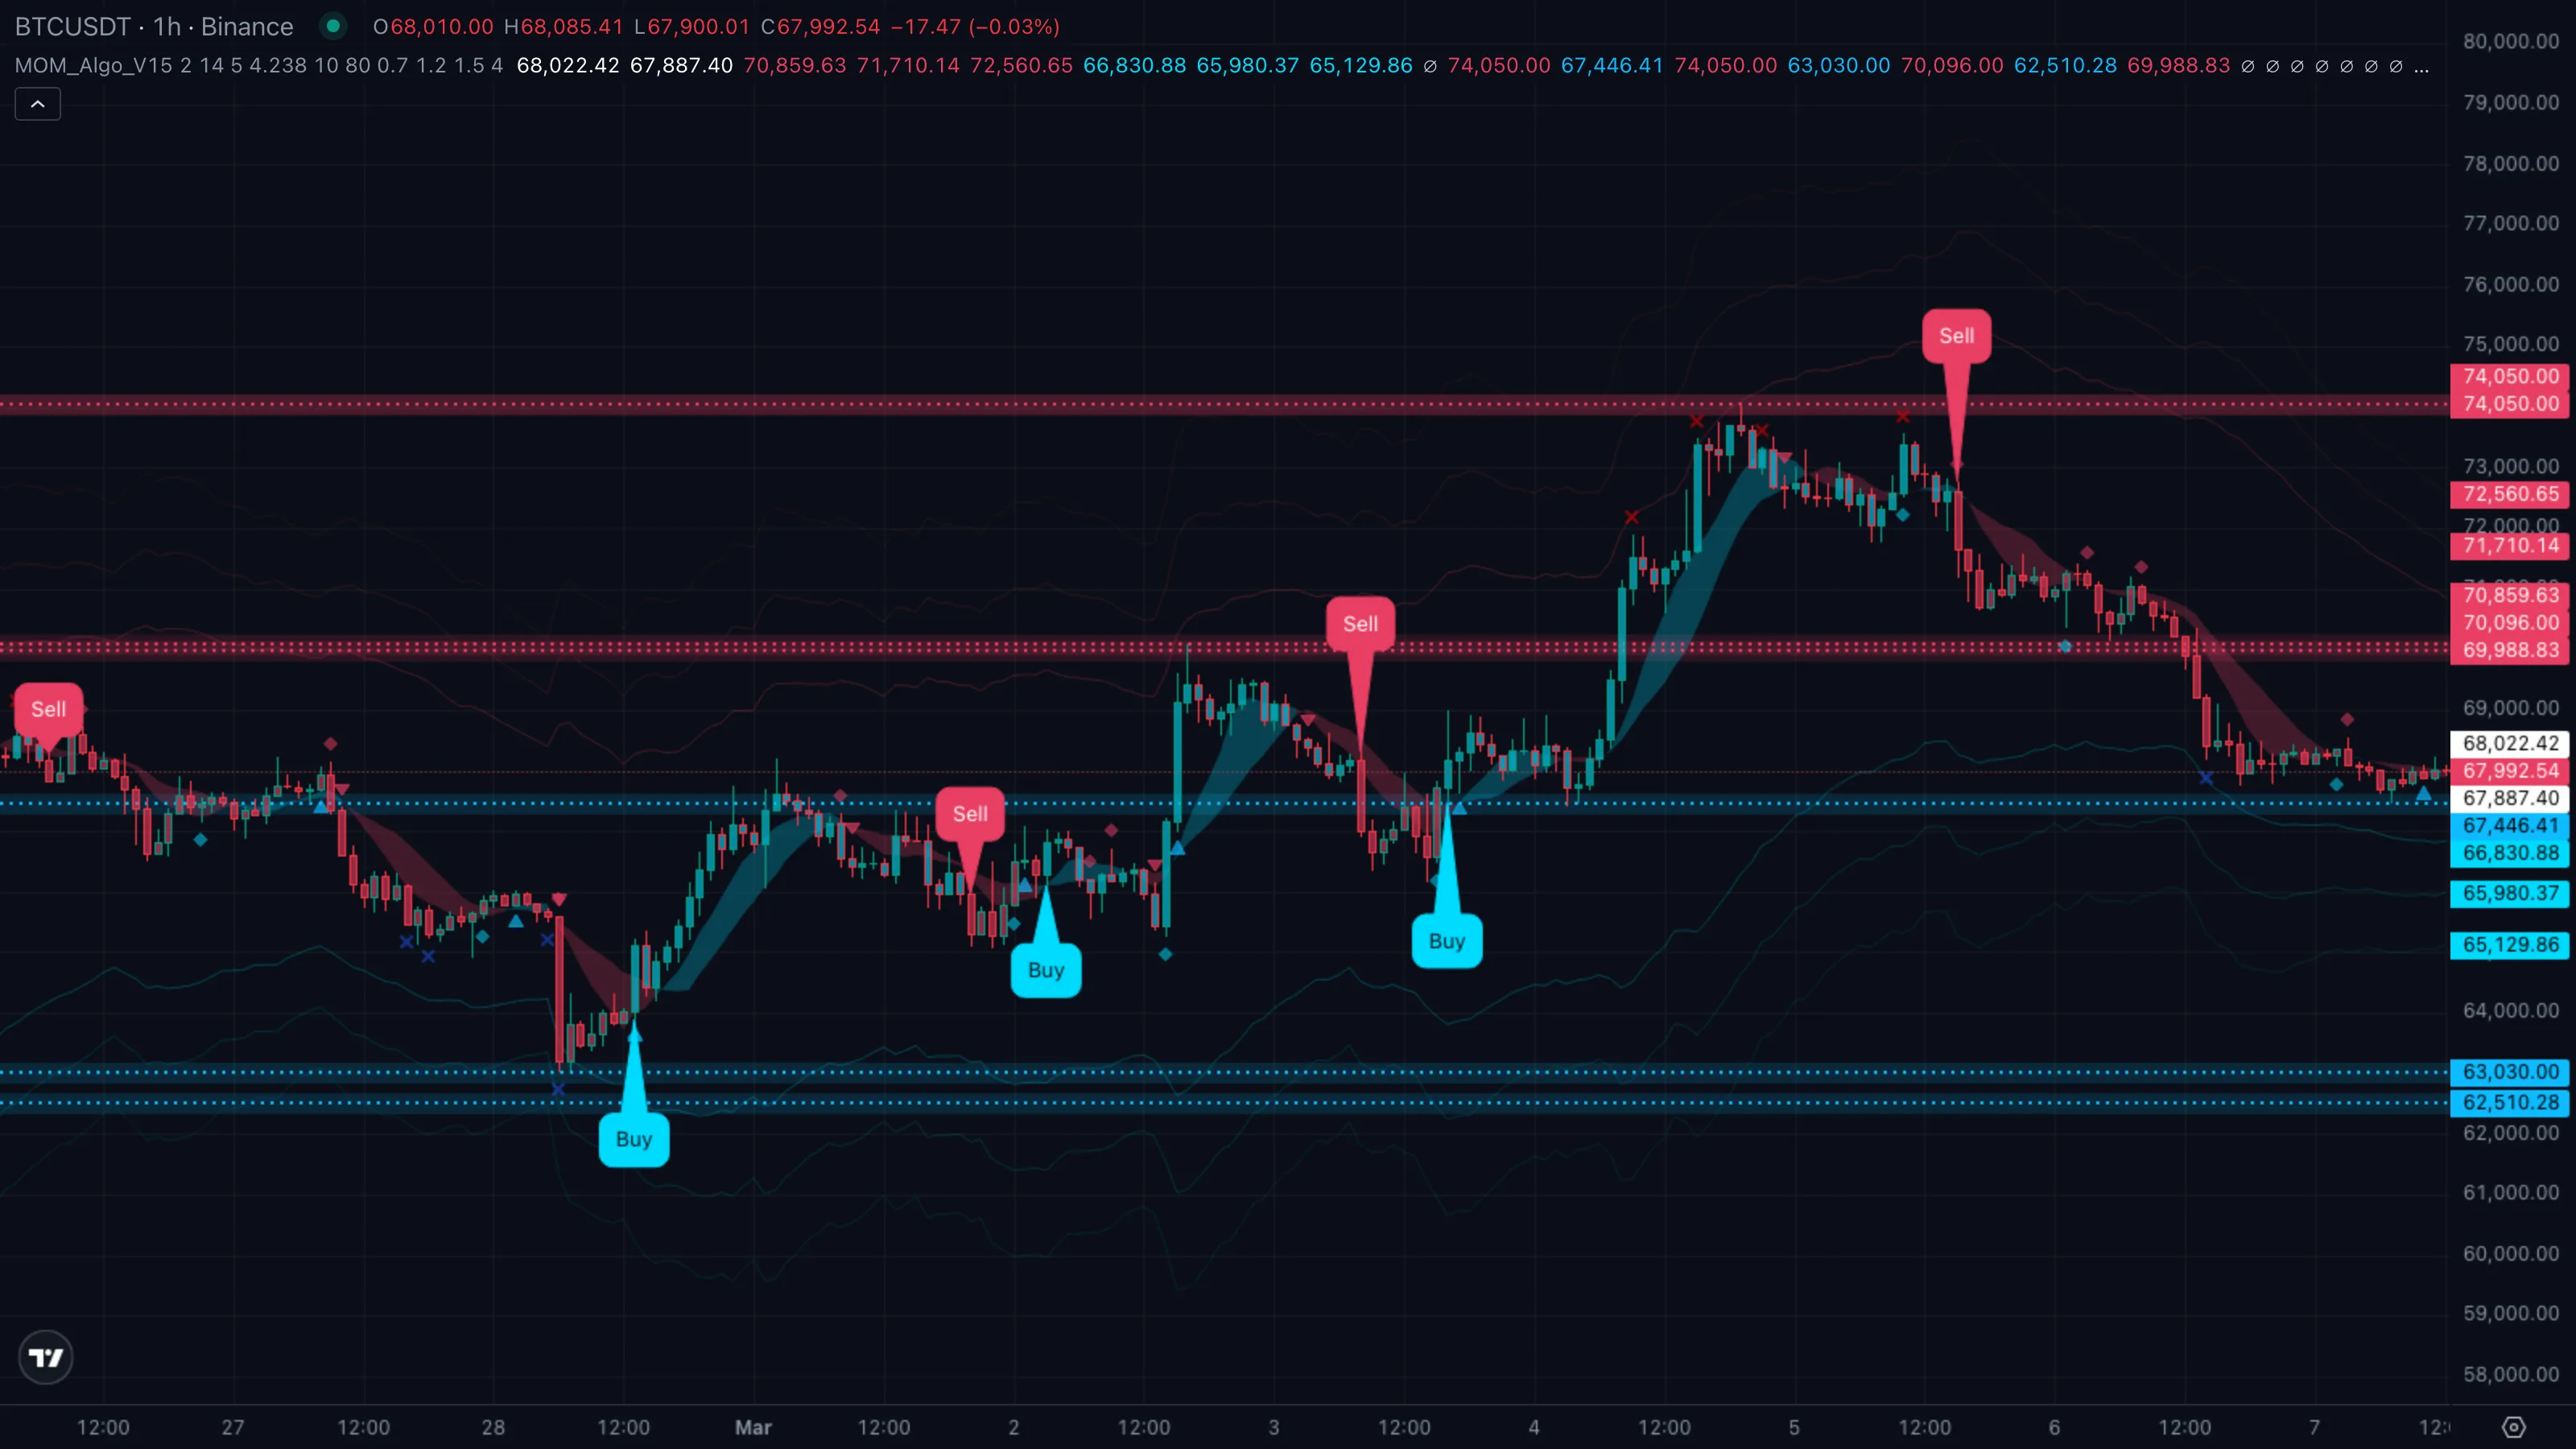
| Symbol | BTCUSDT |
|---|---|
| Timeframe | 1H |
| Venue | Binance |
| Window | 12 Mar to 18 Mar 2026 |
| Pattern | A — clean Buy with full TP ladder |
A textbook setup. BTC drifted lower into 12 Mar, base-built around the 78,000 zone, then printed a clean Buy pill on 13 Mar and ran roughly +5.4 % over the next 36 hours, clipping all three TP ladders. The numbered markers ①–④ map to the four phases of the trade below.
The sequence
| # | When | BTC price | Indicator state | What it tells you |
|---|---|---|---|---|
| ① | 12 Mar | ~78,200 base | red bars, red ribbon, sell pill still in view | The previous regime. Stand aside, no fresh trigger. |
| ② | 13 Mar | ~79,100 close | cyan Buy pill prints | Mechanical entry. Stop, TP1, TP2, TP3 all drawn instantly. |
| ③ | 14 Mar | ~80,400 | bars and ribbon both cyan, X mark on TP1 | First profit ladder hit. Book partials, trail the rest. |
| ④ | 15 Mar | ~83,400 high | X marks on TP2 and TP3, ribbon still cyan | Plan fully delivered. Exit the runner on the next sign of weakness. |
The trade in one card
| What you skipped | Trying to bottom-fish the 12 Mar drift. No pill, no plan. |
| What you took | Long at the 13 Mar Buy pill, stop sized by the drawn ATRAverage True RangeA measure of typical bar-to-bar volatility. ATR rises when bars get bigger; many indicators use it as a noise floor — they only fire when a move clears a multiple of ATR.Click for full definition → distance. |
| Where you exited | Booked partials at each TP X mark, closed the runner as the ribbon began to fade above TP3. |
| Move captured | ~ +5.4 % in roughly 36 hours, with stop-defined risk from the first bar. |
Lesson
The Buy pill gives you the trigger. The drawn stop and TP ladders give you the plan. The TP X marks tell you when to scale out and when to let the runner go.
6. Common Pitfalls
- Front-running the pill. The pill prints on the close of the trigger bar, not while it's still forming. The bar can recover before close and the pill never appears.
- Trading every diamond and triangle. Those are reversal hints, not entries. They earn their keep as exit warnings during a trend, or as confluence with a fresh pill — never on their own.
- Ignoring the KeltnerKeltner ChannelA price envelope built from a moving-average centreline with rails offset by multiples of ATR. Wider rails mark zones where price has historically run out of room before reverting.Click for full definition → bands. A Buy pill near the upper outer band is qualitatively different from one near the lower outer band. The first is chasing a stretched move; the second is buying a flush.
- Over-tuning the sensitivity. Cranking the sensitivity input below 2 makes the SupertrendSupertrendA trailing line set above or below price using an ATR multiple. When close crosses it, the line flips to the opposite side and signals a regime change.Click for full definition → whip and floods the chart with false pills. Change the default only when you have strong evidence the chop profile of the instrument is different.
- Treating a missed TP as a failure. Many strong setups stall at TP1 or TP2 then fade. Getting filled on TP1 and stopped on the runner at break-even is still a win, not a loss.