

Momentum Balance Finder
An anchoredAnchored VWAPA VWAP that begins at a chosen pivot bar (a swing high or swing low) and runs forward. Anchoring makes the absolute level meaningful instead of drifting with whatever bars happen to load.Click for full definition → running tally of buy-volume vs sell-volume, paired with its own long-run baseline, so you can see at a glance which side is genuinely accumulating since the start of the cycle.
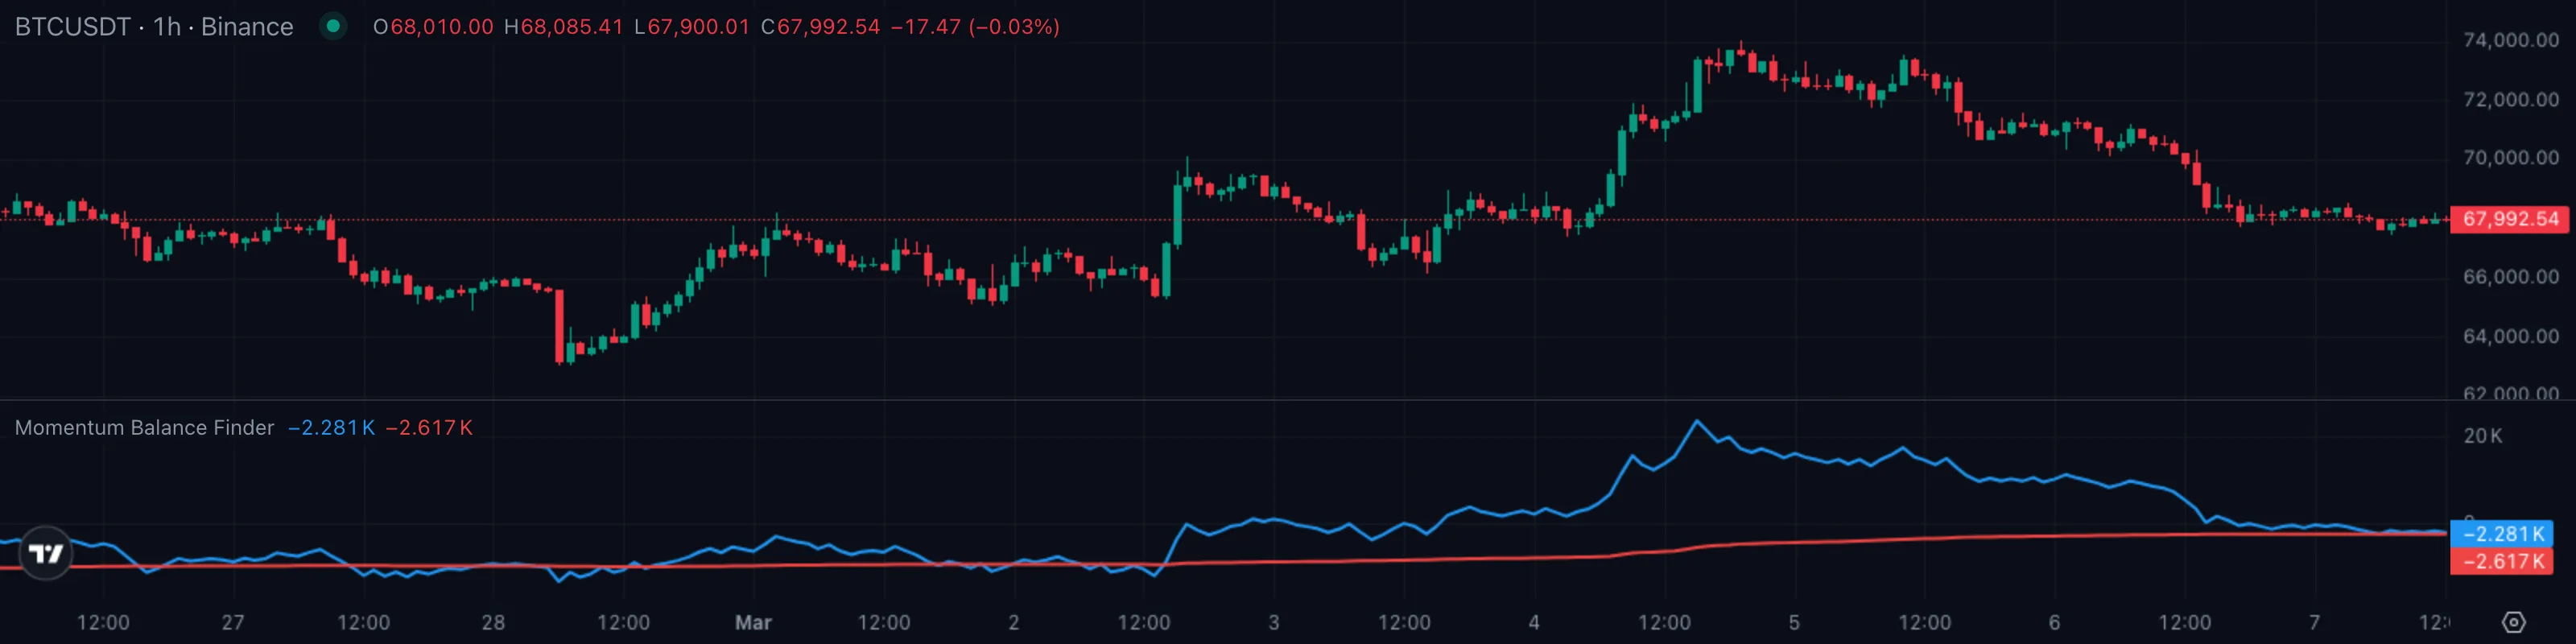
1. What This Indicator Watches For
Price tells you where the last trade happened. Volume tells you how hard people fought to get it there. A bar that closes up half a percent on tiny volume is a very different beast from a bar that closes up half a percent on the heaviest tape of the week — but the candlestick alone can't distinguish them.
That gap is what every volume-flow indicator tries to fill. The classic question a trader asks in front of any chart is the same one institutional desks have been asking for decades:
- Across the entire move I'm watching, is volume net flowing in or net flowing out? Are bulls or bears the ones actually committing capital?
- Where's the long-run centre of that flow? When today's tally drifts above or below its own historical average, who's winning the longer fight?
Momentum Balance Finder answers both with two cumulative lines that begin at a fixed anchorAnchored VWAPA VWAP that begins at a chosen pivot bar (a swing high or swing low) and runs forward. Anchoring makes the absolute level meaningful instead of drifting with whatever bars happen to load.Click for full definition → date and run forward from there. The first line scores every bar's volume by the direction of its close. The second line is the long-run volume-weighted mean of the first. When the scoreboard pulls away from its own baseline, one side is genuinely accumulating; when it crosses back, control is changing hands.
2. How It Works Under the Hood
Two cumulative series run side by side from a single anchorAnchored VWAPA VWAP that begins at a chosen pivot bar (a swing high or swing low) and runs forward. Anchoring makes the absolute level meaningful instead of drifting with whatever bars happen to load.Click for full definition → date (defaults to 1 January 2021 — the start of the current crypto cycle):
- The Balance line (blue). An anchoredAnchored VWAPA VWAP that begins at a chosen pivot bar (a swing high or swing low) and runs forward. Anchoring makes the absolute level meaningful instead of drifting with whatever bars happen to load.Click for full definition → on-balance volumeOn-Balance VolumeA running tally that adds a bar's volume on up-closes and subtracts it on down-closes. The slope shows whether net buying or net selling is accumulating.Click for full definition → tally. Every up-close bar adds that bar's volume to the running total; every down-close bar subtracts it. The total starts the day of the anchorAnchored VWAPA VWAP that begins at a chosen pivot bar (a swing high or swing low) and runs forward. Anchoring makes the absolute level meaningful instead of drifting with whatever bars happen to load.Click for full definition → and only grows or shrinks from there. Bars before the anchorAnchored VWAPA VWAP that begins at a chosen pivot bar (a swing high or swing low) and runs forward. Anchoring makes the absolute level meaningful instead of drifting with whatever bars happen to load.Click for full definition → are ignored, so the line shows you the whole story of who's been accumulating since the cycle began.
- The Volume baseline (red). The volume-weighted long-run average of the Balance line itself — a slow centre of gravity. Big-volume bars pull the baseline harder than tiny-volume ones, so it tracks where the meaningful flow has been spending most of its time. It moves like a heavy slow-period anchorAnchored VWAPA VWAP that begins at a chosen pivot bar (a swing high or swing low) and runs forward. Anchoring makes the absolute level meaningful instead of drifting with whatever bars happen to load.Click for full definition →, not a fast moving average.
The trick is the anchorAnchored VWAPA VWAP that begins at a chosen pivot bar (a swing high or swing low) and runs forward. Anchoring makes the absolute level meaningful instead of drifting with whatever bars happen to load.Click for full definition →. A regular OBVOn-Balance VolumeA running tally that adds a bar's volume on up-closes and subtracts it on down-closes. The slope shows whether net buying or net selling is accumulating.Click for full definition → restarts implicitly with whatever bars happen to be loaded — different chart, different number — so the absolute level is meaningless. By pinning both lines to a fixed historical date, the value at any later bar represents net cumulative flow since that date. Two traders looking at the same anchorAnchored VWAPA VWAP that begins at a chosen pivot bar (a swing high or swing low) and runs forward. Anchoring makes the absolute level meaningful instead of drifting with whatever bars happen to load.Click for full definition → see the same numbers. The level becomes meaningful, not just the slope.
How the indicator decides who's in control. Every bar, you ask two simple questions:
- Is the Balance line above or below its baseline? Above means cumulative flow is running stronger than its long-run average. Below means weaker.
- Are the two lines pulling apart, or coming back together? Widening separation means one side is actively accumulating; narrowing means the dominant side is losing steam.
The state falls out of those two answers:
| What you're seeing | State | Plain English |
|---|---|---|
| Balance line above baseline and the gap is widening | 🟢 Bullish accumulationAccumulation and DistributionAccumulation is sustained net buying that builds a position quietly. Distribution is the reverse — sustained net selling into strength.Click for full definition → | Buyers committing more capital than the long-run average |
| Two lines tangled together, neither pulling away | 🟡 Balanced | Buy-flow and sell-flow are roughly matched |
| Balance line below baseline and the gap is widening | 🔴 Bearish distributionAccumulation and DistributionAccumulation is sustained net buying that builds a position quietly. Distribution is the reverse — sustained net selling into strength.Click for full definition → | Sellers committing more capital than the long-run average |
The cross between the two lines is the headline event. Because the baseline is volume-weighted and slow-moving, a cross only happens when the tally has genuinely dragged its own long-run mean to the other side — not on a single noisy bar. That's what makes the cross worth treating as a regime change rather than a wiggle.
3. What You See on the Chart
| Element | Looks like | Means |
|---|---|---|
| Balance line | A blue line in a separate pane, plotted in volume units (M / B) | Cumulative net buy-minus-sell volume since the anchorAnchored VWAPA VWAP that begins at a chosen pivot bar (a swing high or swing low) and runs forward. Anchoring makes the absolute level meaningful instead of drifting with whatever bars happen to load.Click for full definition → date. Up = net accumulationAccumulation and DistributionAccumulation is sustained net buying that builds a position quietly. Distribution is the reverse — sustained net selling into strength.Click for full definition →. |
| Volume baseline | A red line in the same pane | Volume-weighted long-run mean of the Balance line. Acts as the slow centre of gravity. |
| Blue above red | Blue line floats above the red one, gap visible | Buyers are net winning since the anchorAnchored VWAPA VWAP that begins at a chosen pivot bar (a swing high or swing low) and runs forward. Anchoring makes the absolute level meaningful instead of drifting with whatever bars happen to load.Click for full definition → — bullish regime. |
| Blue below red | Blue line sits under the red one | Sellers are net winning since the anchorAnchored VWAPA VWAP that begins at a chosen pivot bar (a swing high or swing low) and runs forward. Anchoring makes the absolute level meaningful instead of drifting with whatever bars happen to load.Click for full definition → — bearish regime. |
| The cross | The two lines meet and switch positions | Regime change. The cumulative scoreboard has flipped. |
| DivergenceDivergenceWhen price makes a new extreme but a momentum indicator (RSI, MACD, etc.) does not — a sign that the move is losing internal force even though it's still going.Click for full definition → with price | Price makes a new high but Balance does not (or vice versa) | The move on price is not being backed by fresh net volume — early warning. |
Both lines render in the indicator's own pane below price, formatted as volume (so a Balance reading might read 23.4 M or 1.85 B depending on the symbol). The y-axis numbers themselves don't matter much — what matters is the relative position of the two lines and the slope of each.
4. Reading It in 3 Patterns
Pattern A — Blue above red, both rising
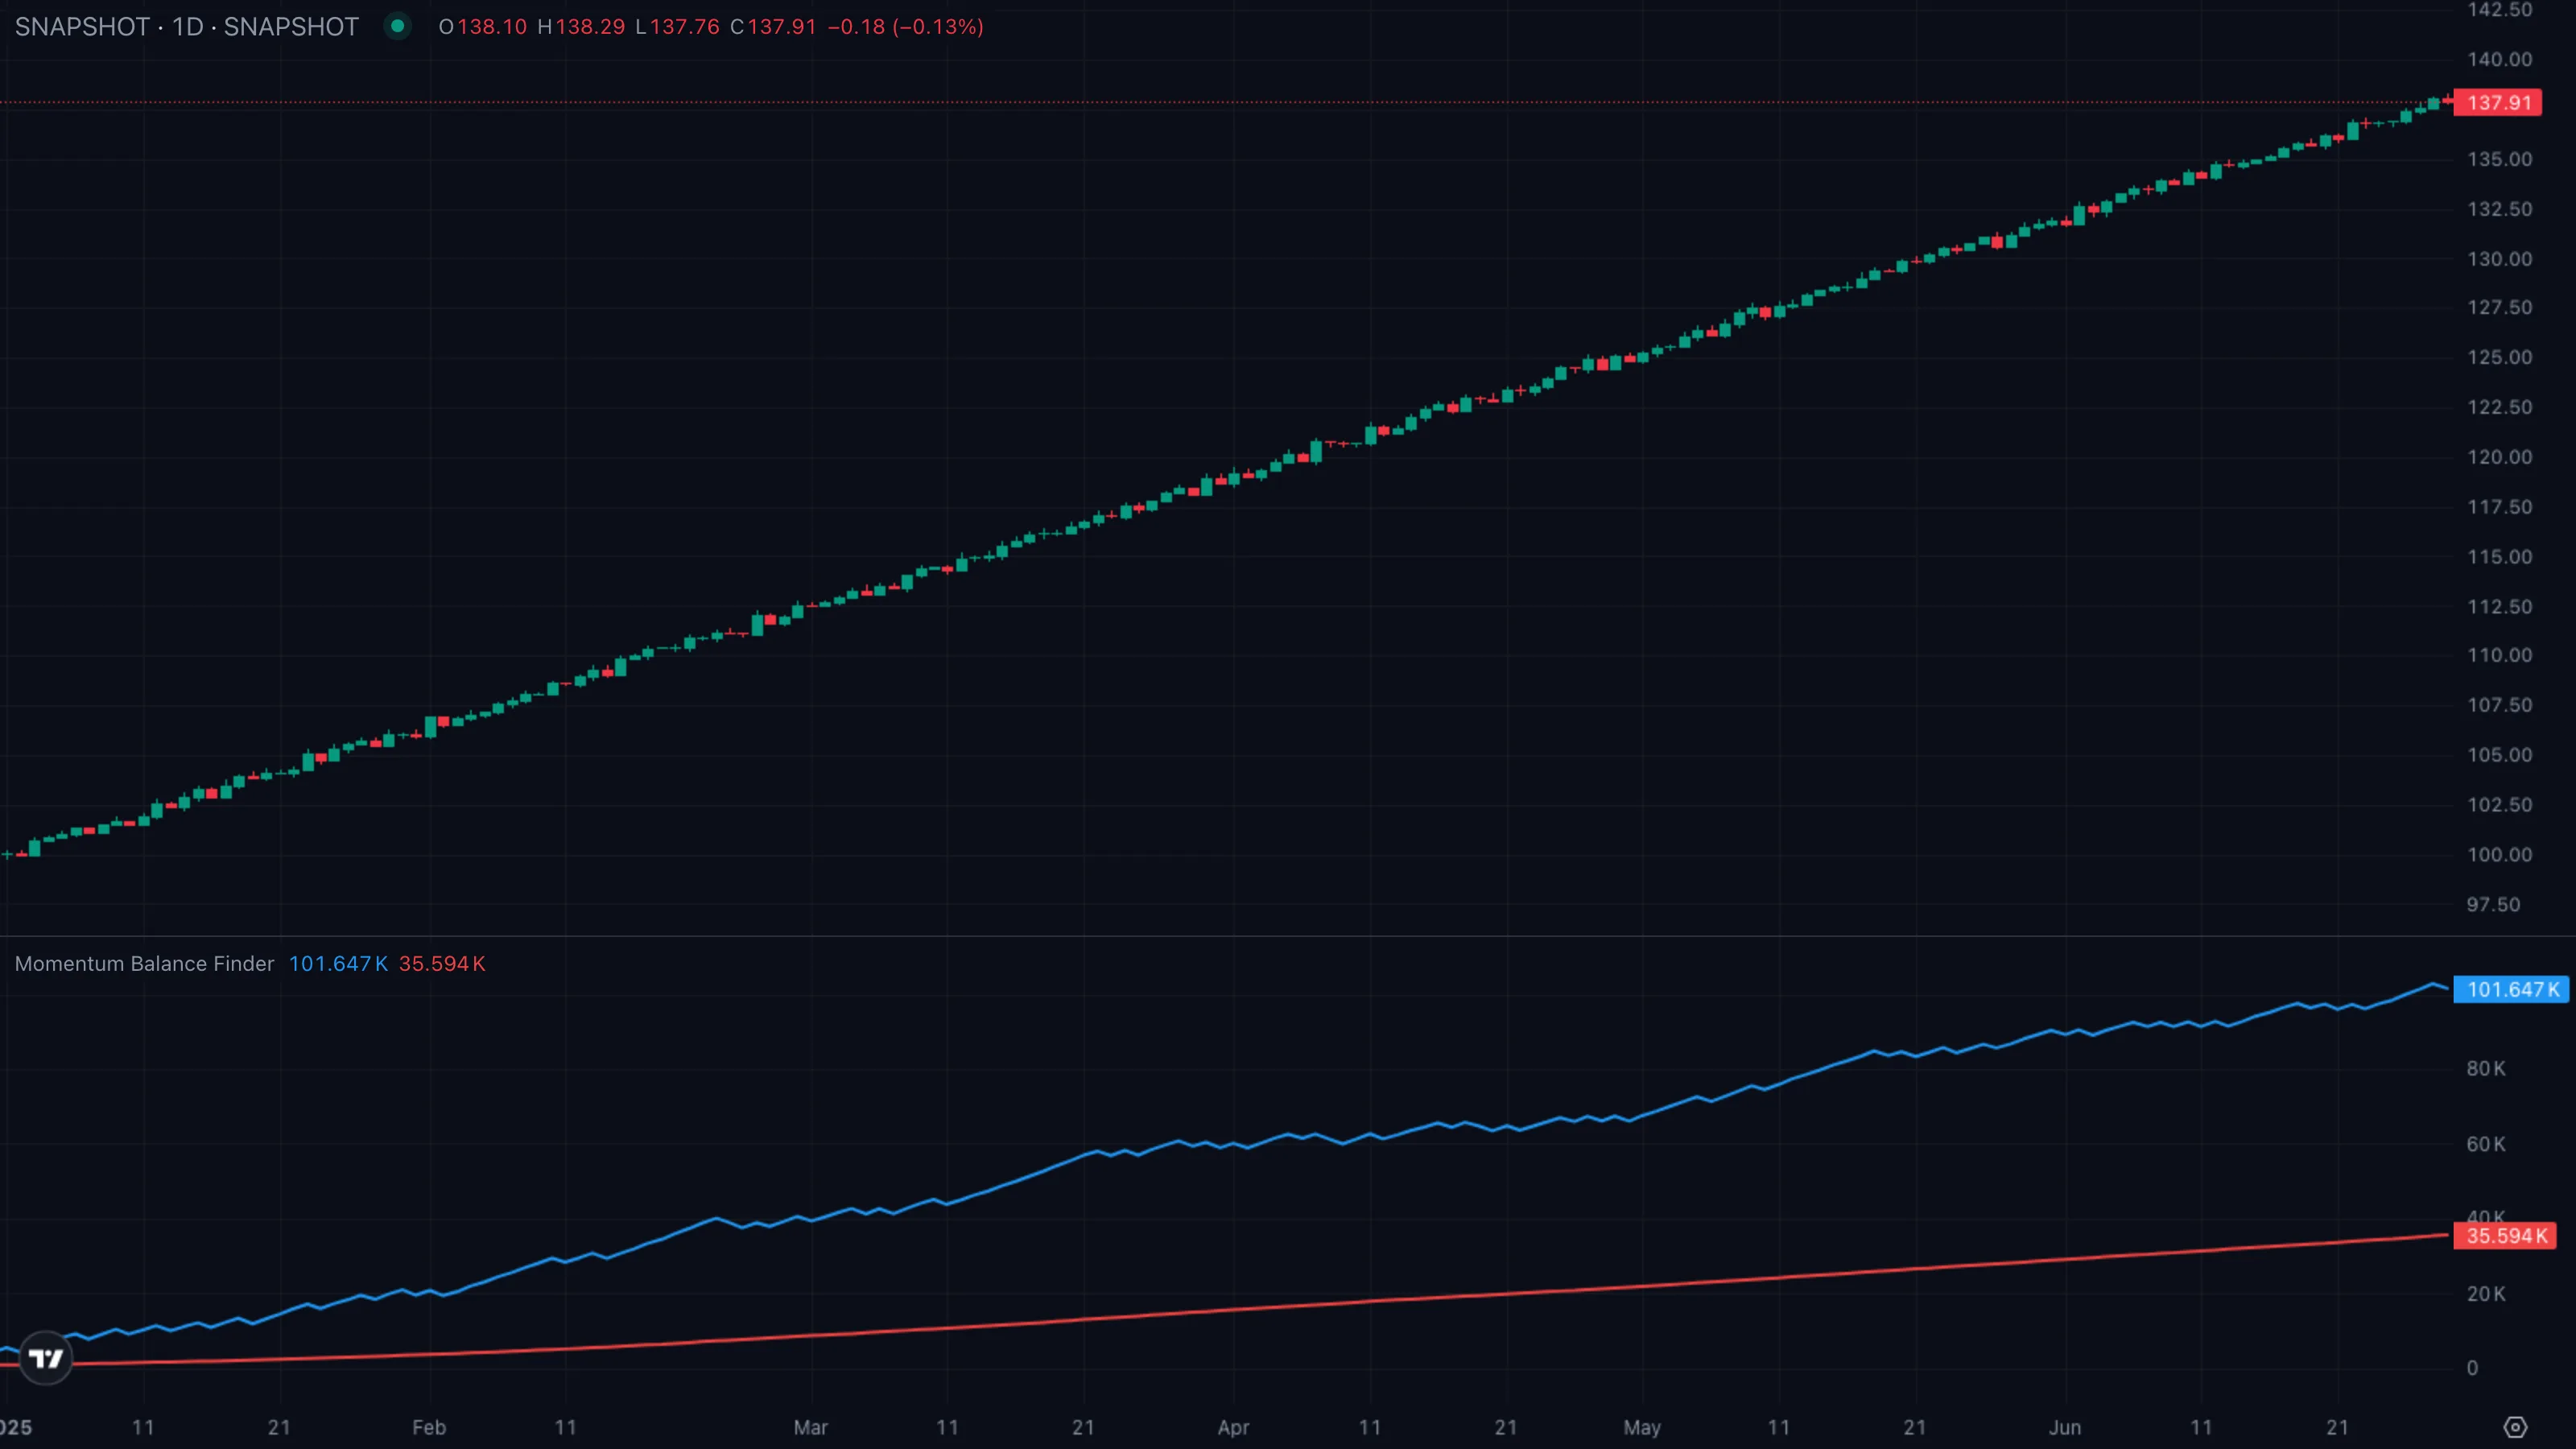
| What you see | ① Price stair-steps higher ② the Balance line sits clearly above its baseline ③ both lines slope up together with the gap holding steady or widening. |
| What it means | Genuine accumulationAccumulation and DistributionAccumulation is sustained net buying that builds a position quietly. Distribution is the reverse — sustained net selling into strength.Click for full definition →. Every up-bar's volume is bigger than every down-bar's, and the imbalanceFair Value GapA gap between three consecutive bars where price moved so fast it left an unfilled zone. Markets often revisit it before continuing the trend.Click for full definition → has been persistent enough to drag even the slow baseline upward. The trend on price is being paid for. |
| What to do | Bias long. Treat pullbacksPullback (Retracement)A short, counter-trend move within an established trend — buyers (or sellers) momentarily losing ground before the trend resumes. Often the lowest-risk place to enter the trend.Click for full definition → toward the baseline as buy-the-dip opportunities rather than reversals. Don't fade strength; the volume tape is on the bull side. |
Pattern B — Lines tangled, no separation
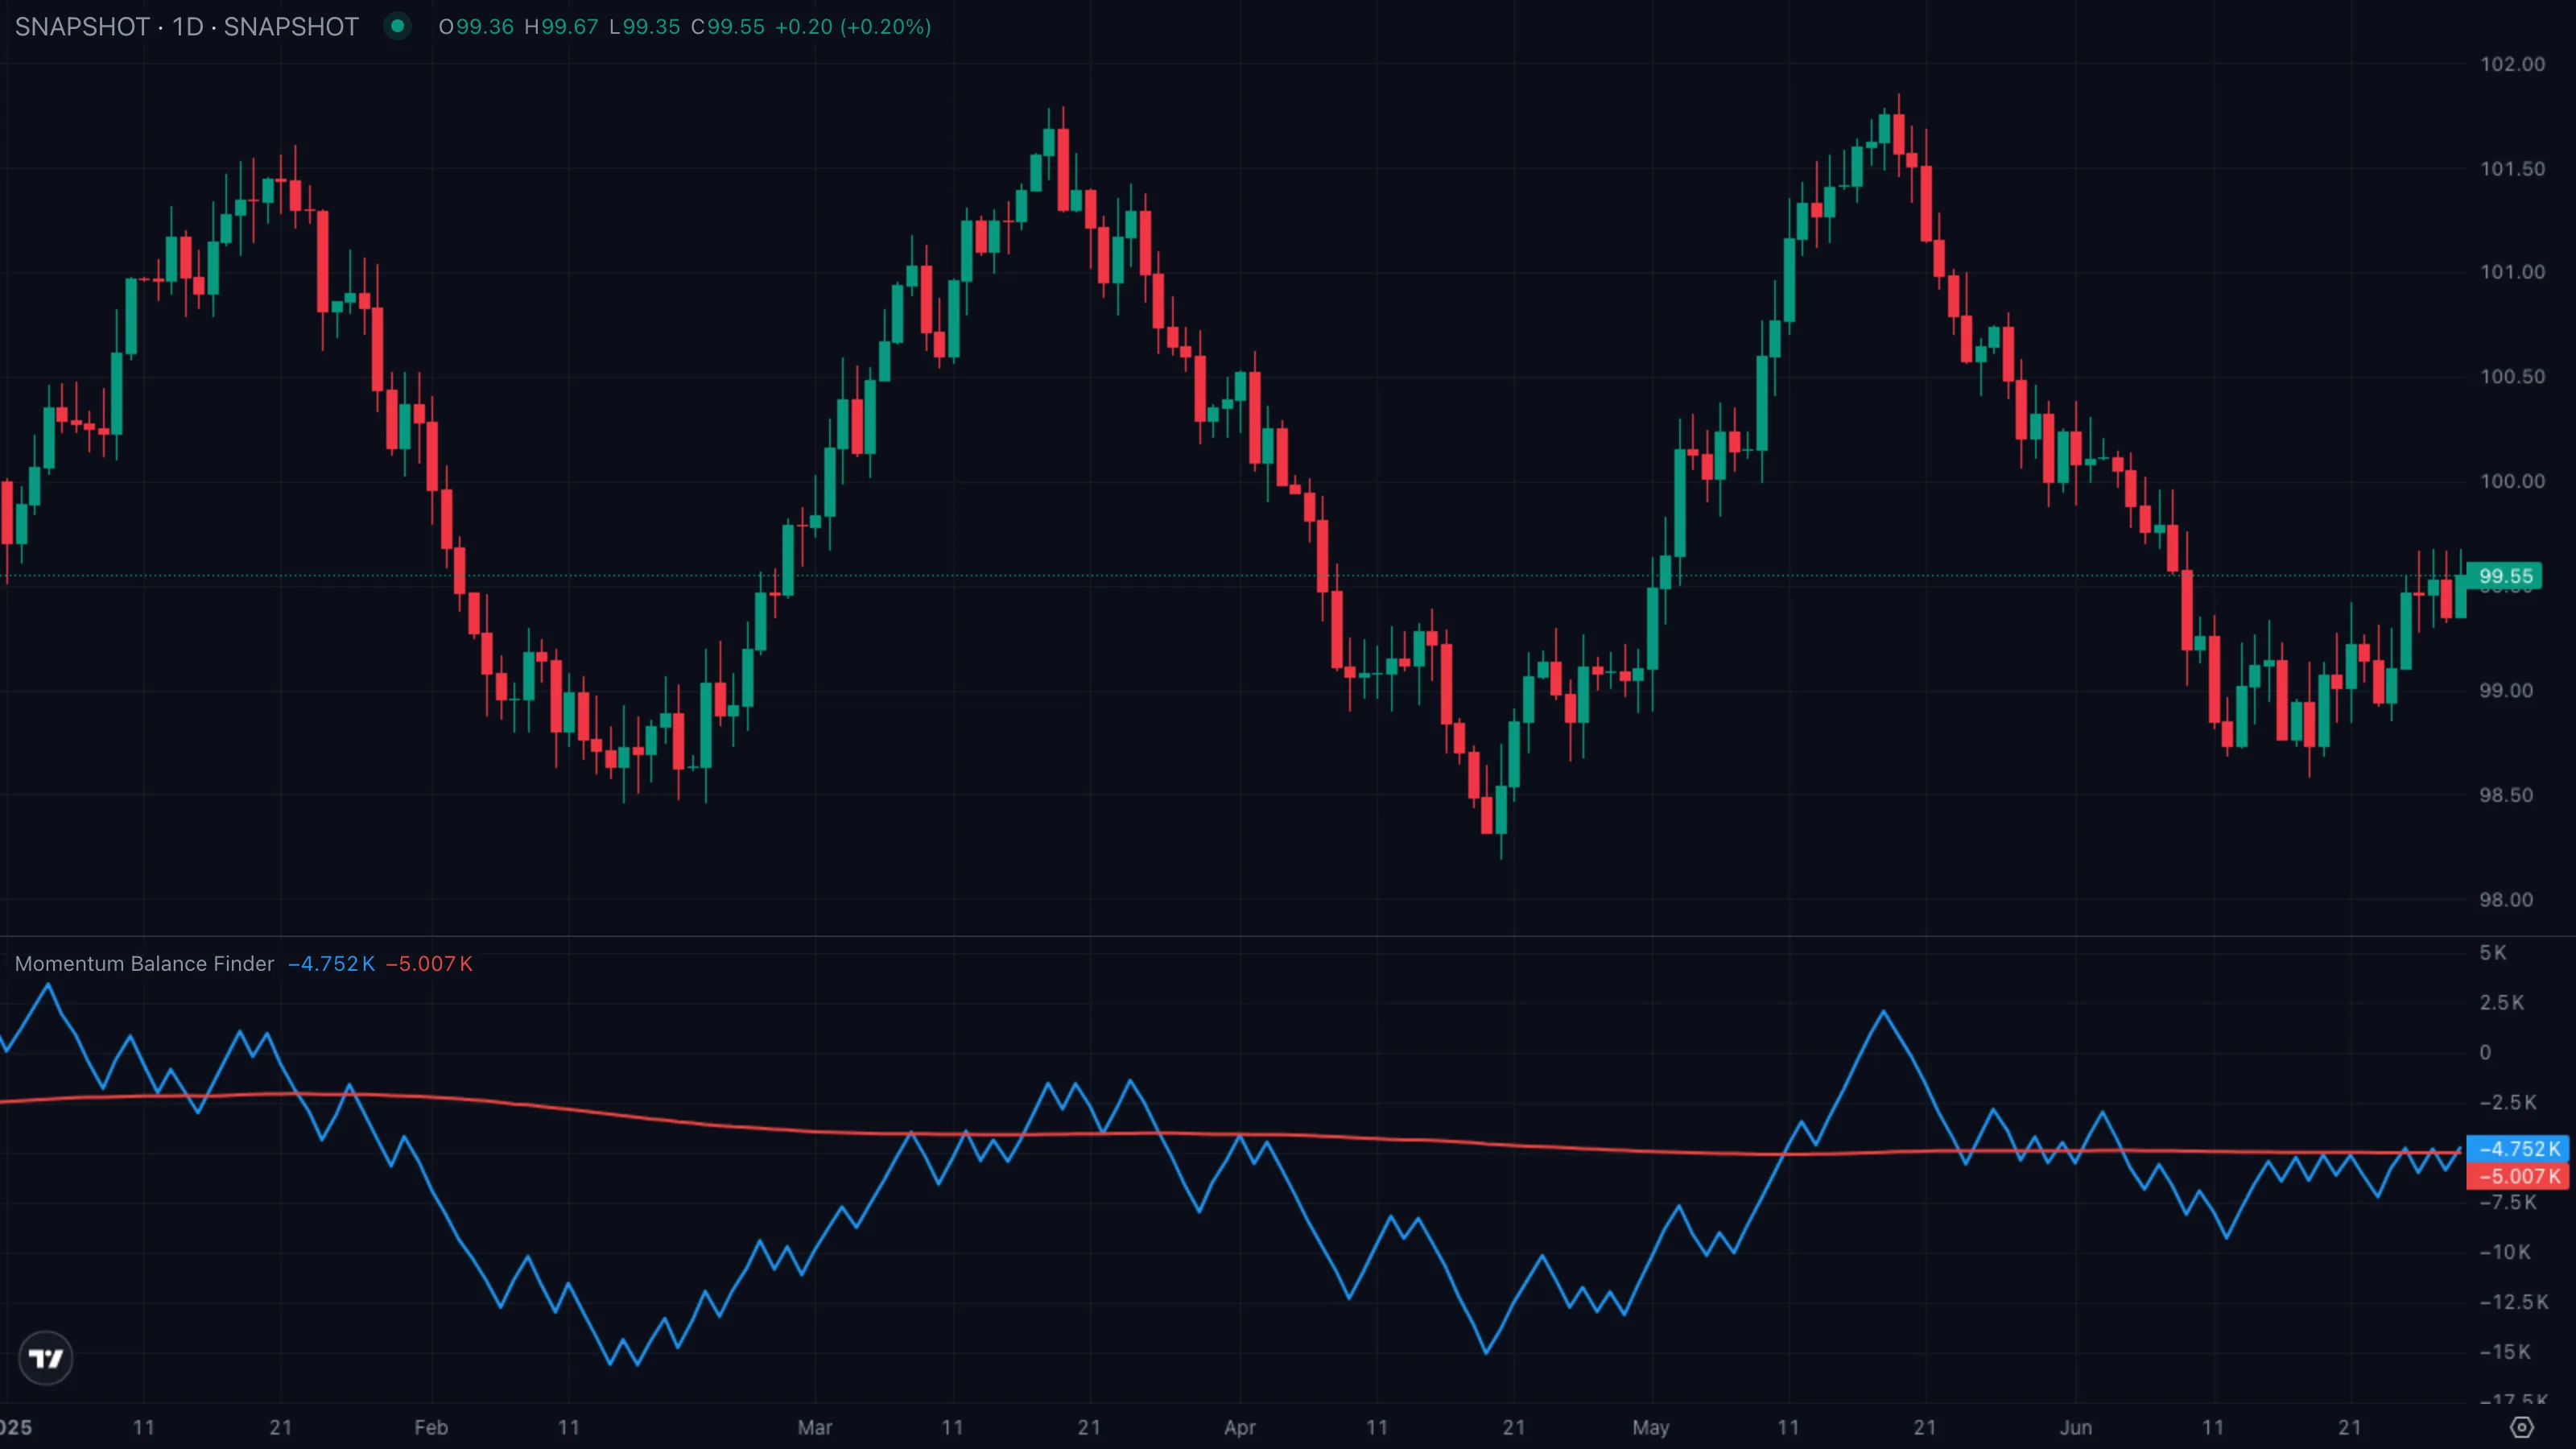
| What you see | ① Price oscillates inside a range ② the Balance line crisscrosses its baseline repeatedly ③ neither line has a meaningful slope. |
| What it means | Buy-flow and sell-flow are roughly matched. Every up-bar is being neutralised by a down-bar of similar size. There's no edge in either direction. |
| What to do | Stand aside on trend trades. This is the regime where mean reversionMean ReversionThe expectation that price, after stretching far from a baseline (a moving average, prior range), will snap back toward it. Works best in chop and range-bound markets.Click for full definition → strategies inside the price range can work, but anyone trying to ride a directional move will get chopped. Wait for one line to clearly pull away from the other. |
Pattern C — Bearish divergenceDivergenceWhen price makes a new extreme but a momentum indicator (RSI, MACD, etc.) does not — a sign that the move is losing internal force even though it's still going.Click for full definition → at the highs
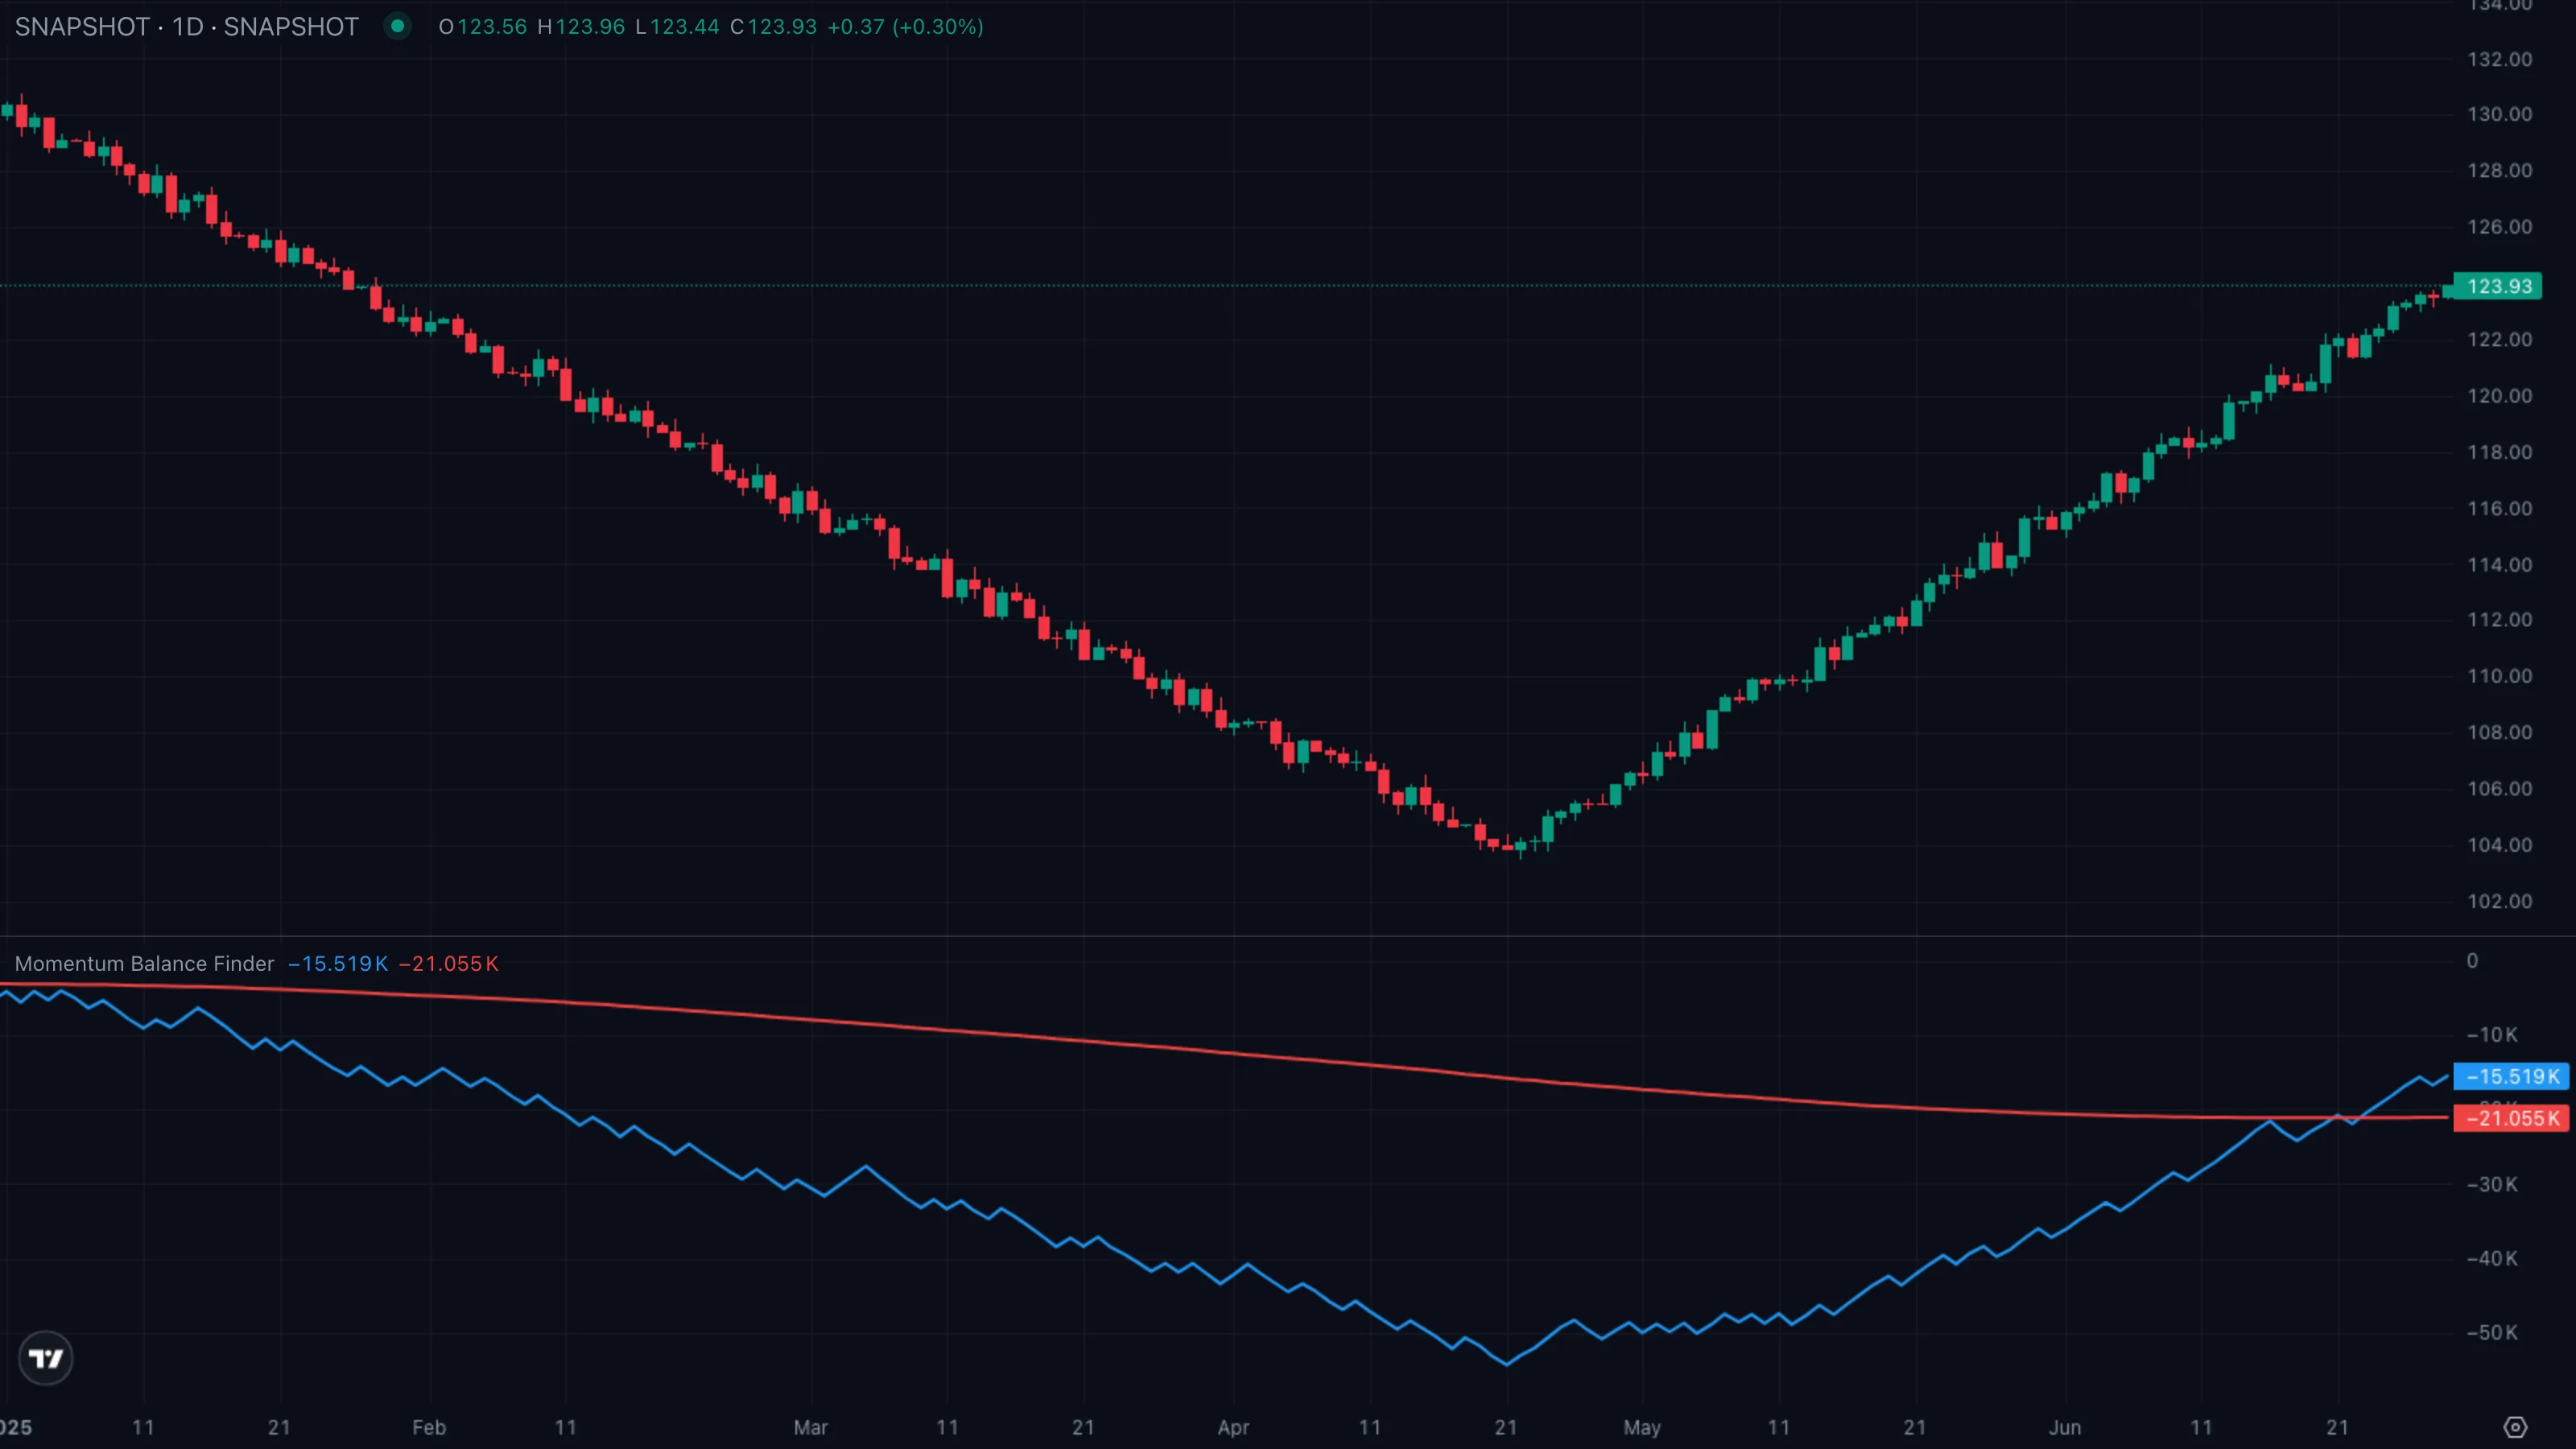
| What you see | ① Price prints a fresh swing highSwing High and Swing LowThe most recent confirmed pivot in either direction. Swing highs cap rallies until broken; swing lows support pullbacks until broken.Click for full definition → ② the Balance line fails to print a new high alongside it, leaving a lower peak ③ shortly after, the Balance line crosses below its baseline. |
| What it means | A classic divergenceDivergenceWhen price makes a new extreme but a momentum indicator (RSI, MACD, etc.) does not — a sign that the move is losing internal force even though it's still going.Click for full definition →. Price is still going up but fewer net buyers are paying for the move than at the previous high. The cross under the baseline confirms the regime has flipped from accumulationAccumulation and DistributionAccumulation is sustained net buying that builds a position quietly. Distribution is the reverse — sustained net selling into strength.Click for full definition → to distributionAccumulation and DistributionAccumulation is sustained net buying that builds a position quietly. Distribution is the reverse — sustained net selling into strength.Click for full definition →. |
| What to do | Wait for the cross — divergenceDivergenceWhen price makes a new extreme but a momentum indicator (RSI, MACD, etc.) does not — a sign that the move is losing internal force even though it's still going.Click for full definition → alone is a heads-up, not a signal. Once Balance crosses below baseline, treat that as the regime change. Pull stops up tight on longs, look for short setups on the next rally back into resistance. |
5. Trade Walkthrough
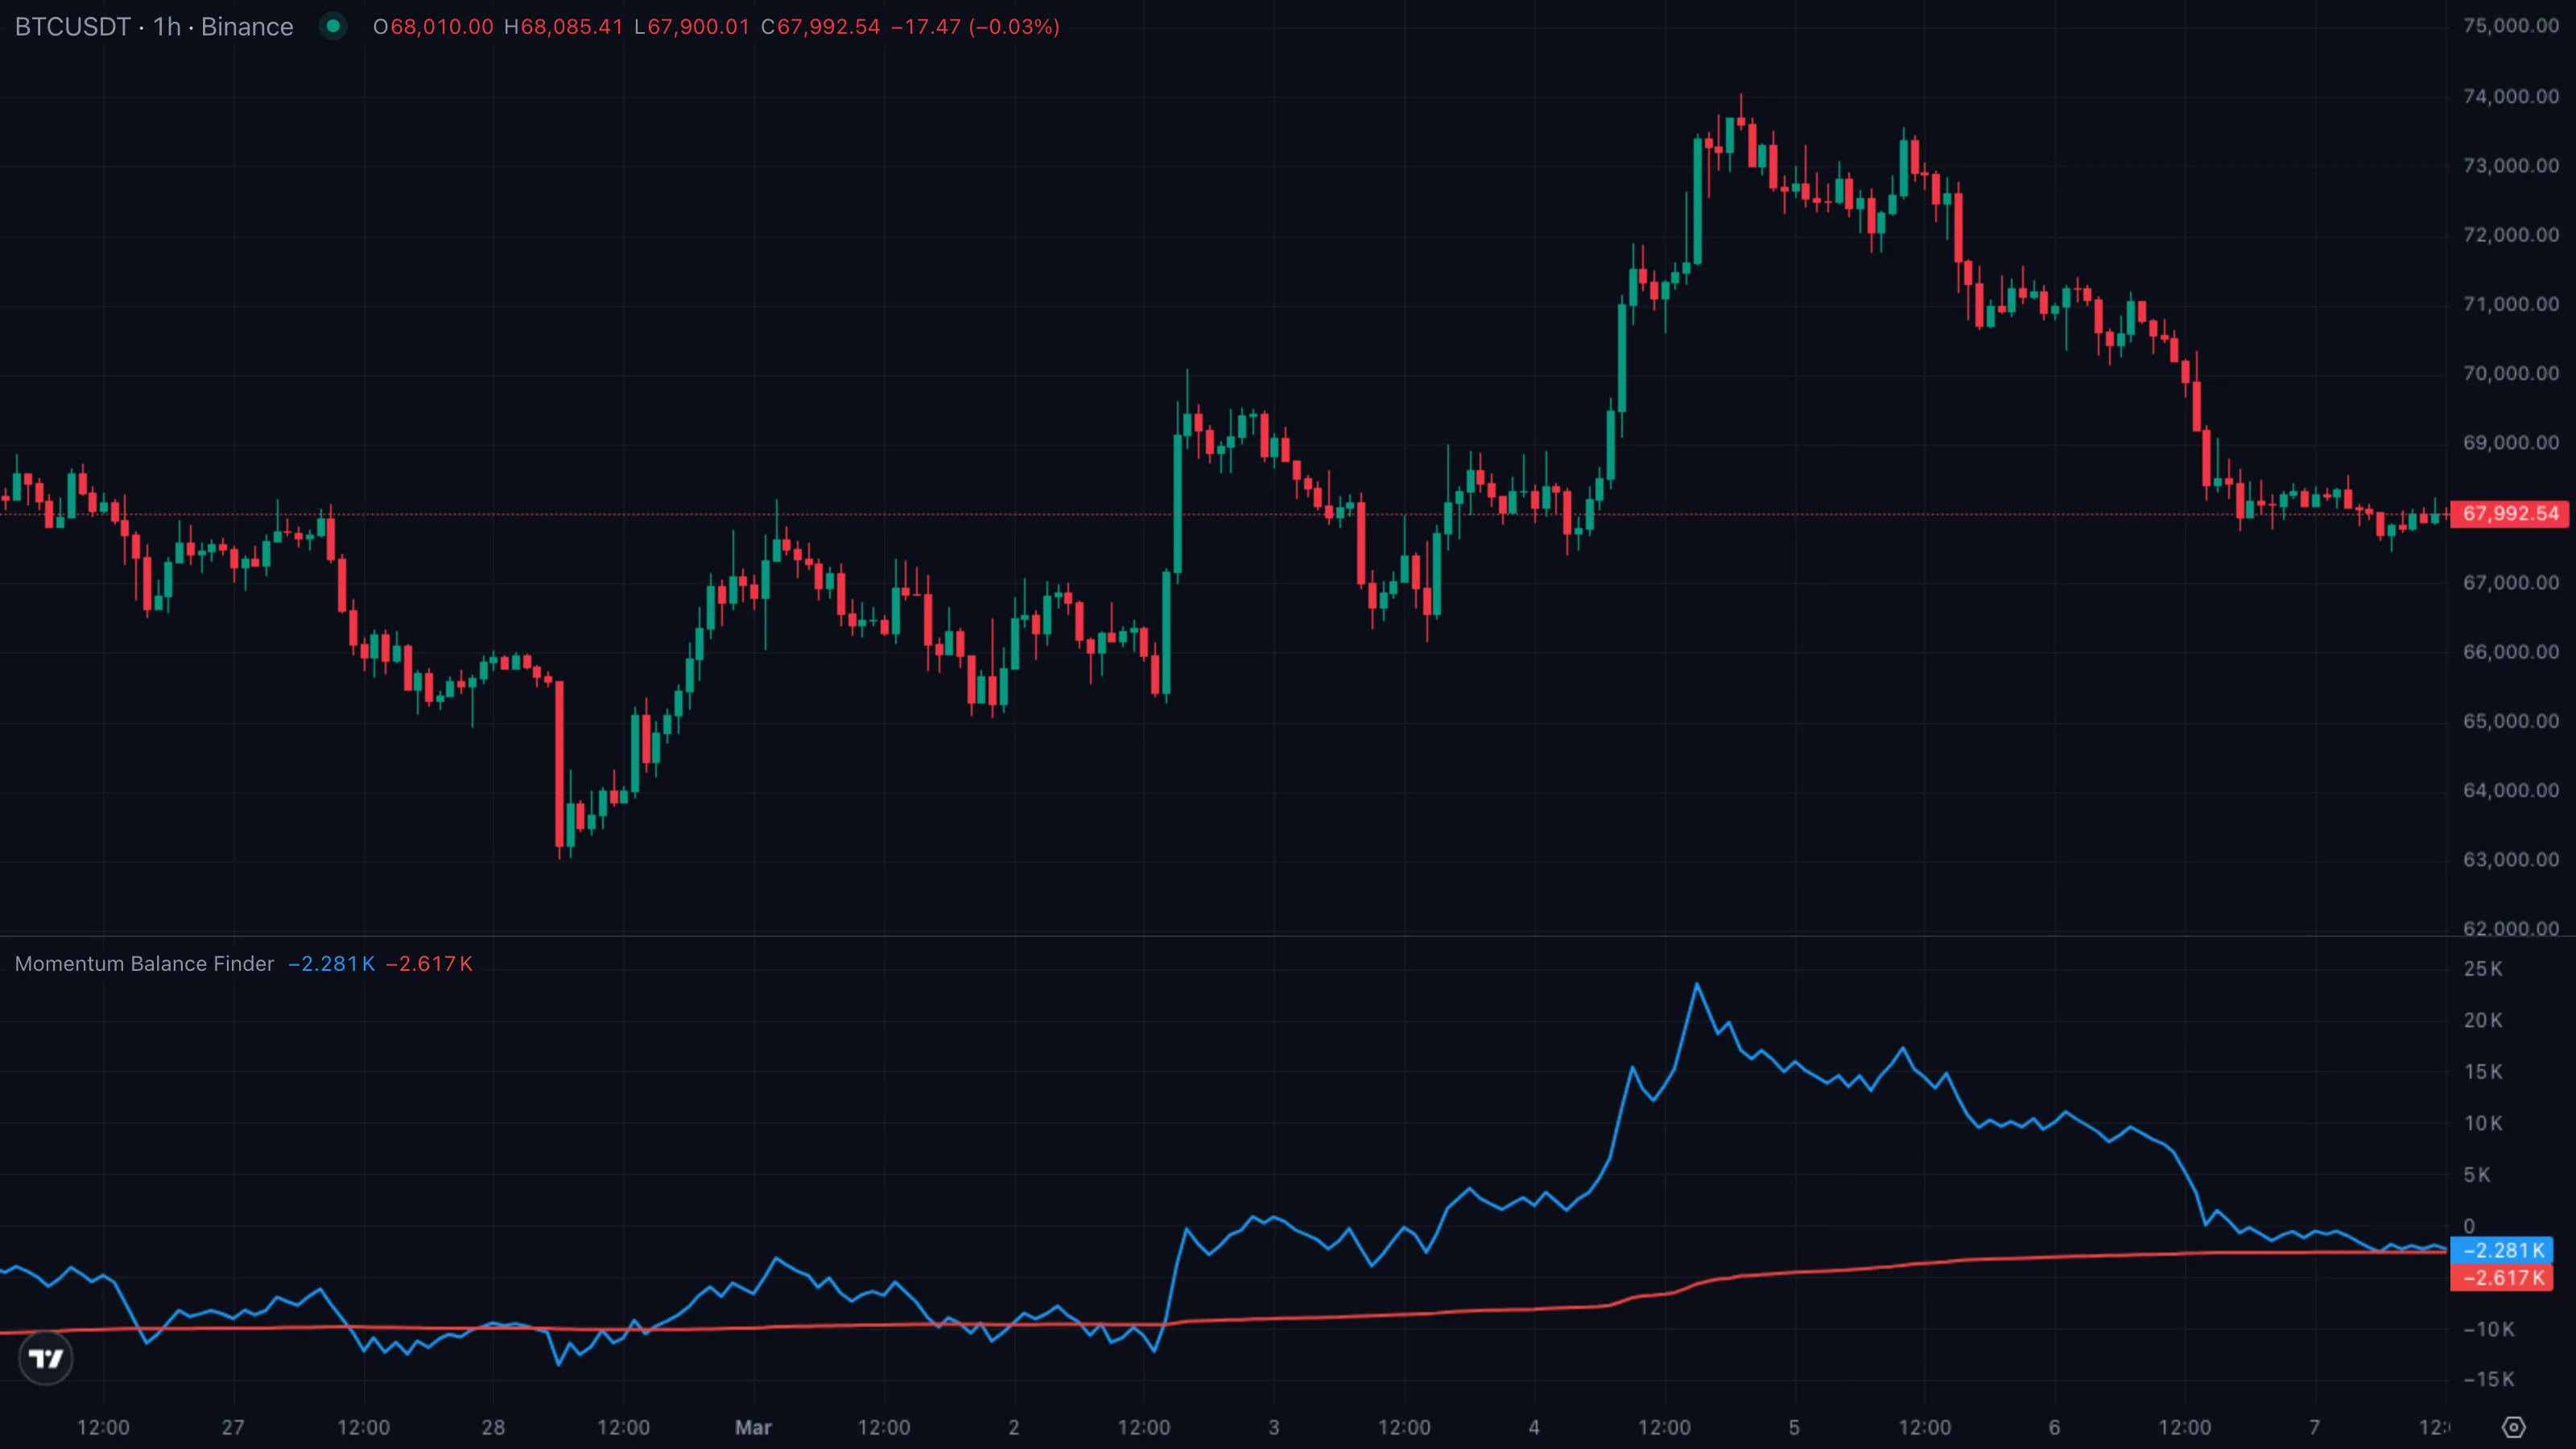
| Symbol | BTCUSDT |
|---|---|
| Timeframe | 4H |
| Venue | Binance |
| Window | 10 Mar to 22 Mar 2026 |
| Pattern | C — bearish divergenceDivergenceWhen price makes a new extreme but a momentum indicator (RSI, MACD, etc.) does not — a sign that the move is losing internal force even though it's still going.Click for full definition → + baseline cross |
A textbook Pattern C. BTC had been grinding higher through the back half of February and into early March 2026, eventually stretching to a new local high around $78,400 on 14 March. To eyes on price alone, the rally looked clean. The Momentum Balance Finder told a quieter, more honest story: each new price high through that stretch was being met with a smaller push on the Balance line, and on 18 March the blue line finally crossed under the red baseline — confirming that net flow had flipped from accumulationAccumulation and DistributionAccumulation is sustained net buying that builds a position quietly. Distribution is the reverse — sustained net selling into strength.Click for full definition → to distributionAccumulation and DistributionAccumulation is sustained net buying that builds a position quietly. Distribution is the reverse — sustained net selling into strength.Click for full definition →. The numbered markers ①–④ on the chart map to the four phases below.
The sequence
| # | When | BTC price | Indicator state | What it tells you |
|---|---|---|---|---|
| ① | 10 Mar | ~74,200 | Blue above red, both rising | Healthy uptrend. Volume is paying for the move. |
| ② | 14 Mar | ~78,400 high | Price prints higher high; Balance prints lower high | Bearish divergenceDivergenceWhen price makes a new extreme but a momentum indicator (RSI, MACD, etc.) does not — a sign that the move is losing internal force even though it's still going.Click for full definition →. The rally is being made on lighter net buying. |
| ③ | 18 Mar | ~75,800 | Balance line crosses below baseline | The real entry. Regime confirmed flipped. |
| ④ | 21 Mar | ~70,300 | Blue clearly under red, gap widening | Trend taking hold. Cue to trail stops on shorts or take partial profit. |
The trade in one card
| What you skipped | Trying to short the swing highSwing High and Swing LowThe most recent confirmed pivot in either direction. Swing highs cap rallies until broken; swing lows support pullbacks until broken.Click for full definition → at 78,400 on the divergenceDivergenceWhen price makes a new extreme but a momentum indicator (RSI, MACD, etc.) does not — a sign that the move is losing internal force even though it's still going.Click for full definition → alone — would have been stopped out on the next push. |
| What you took | Short on the cross under baseline near 75,800, with a stop just above the failed high. |
| Where you exited | Trailed down as the Balance line kept pulling further below the baseline; partial cover near 70,300. |
| Move captured | ~ +7.2 % short in roughly three days. |
Lesson
The divergenceDivergenceWhen price makes a new extreme but a momentum indicator (RSI, MACD, etc.) does not — a sign that the move is losing internal force even though it's still going.Click for full definition → gives you the alert. The cross under the baseline gives you the trade. The widening gap between the two lines tells you the new regime is real and the move has room to run.
6. Common Pitfalls
- Trading the absolute number. The Balance line might read 2.4 B on BTC and 45 M on a small-cap. Those numbers mean nothing on their own. What matters is the position of Balance relative to its baseline and the slope of each — never the raw level.
- Treating every micro-cross as a signal. In genuinely balanced regimes (Pattern B), the two lines will cross back and forth several times in a few days. Wait for a cross to hold across multiple bars and ideally for the gap to start widening before treating it as a real flip.
- Acting on divergenceDivergenceWhen price makes a new extreme but a momentum indicator (RSI, MACD, etc.) does not — a sign that the move is losing internal force even though it's still going.Click for full definition → alone. A new price high without a confirming Balance high is a warning, not a signal. The trade is the cross that follows — without it, the divergenceDivergenceWhen price makes a new extreme but a momentum indicator (RSI, MACD, etc.) does not — a sign that the move is losing internal force even though it's still going.Click for full definition → can persist for many bars while price keeps grinding.
- Switching the anchorAnchored VWAPA VWAP that begins at a chosen pivot bar (a swing high or swing low) and runs forward. Anchoring makes the absolute level meaningful instead of drifting with whatever bars happen to load.Click for full definition → mid-analysis. The whole power of the indicator comes from the fixed reference point. If you re-anchorAnchored VWAPA VWAP that begins at a chosen pivot bar (a swing high or swing low) and runs forward. Anchoring makes the absolute level meaningful instead of drifting with whatever bars happen to load.Click for full definition → every time you change timeframe, you lose the long-run context that makes the level meaningful in the first place.
- Forgetting that mean reversionMean ReversionThe expectation that price, after stretching far from a baseline (a moving average, prior range), will snap back toward it. Works best in chop and range-bound markets.Click for full definition → fails in strong regimes. When the Balance line is pulling clearly away from its baseline, fade trades on price will lose. Save the mean reversionMean ReversionThe expectation that price, after stretching far from a baseline (a moving average, prior range), will snap back toward it. Works best in chop and range-bound markets.Click for full definition → plays for Pattern B — when the lines are tangled and the regime is genuinely balanced, that's when the range is real.