

Momentum Insider with DivergencesDivergenceWhen price makes a new extreme but a momentum indicator (RSI, MACD, etc.) does not — a sign that the move is losing internal force even though it's still going.Click for full definition →
A volume-weighted momentum ribbon that automatically flags four kinds of price-versus-momentum divergenceDivergenceWhen price makes a new extreme but a momentum indicator (RSI, MACD, etc.) does not — a sign that the move is losing internal force even though it's still going.Click for full definition → — the earliest heads-up that a trend is running on fumes.
1. What This Indicator Watches For
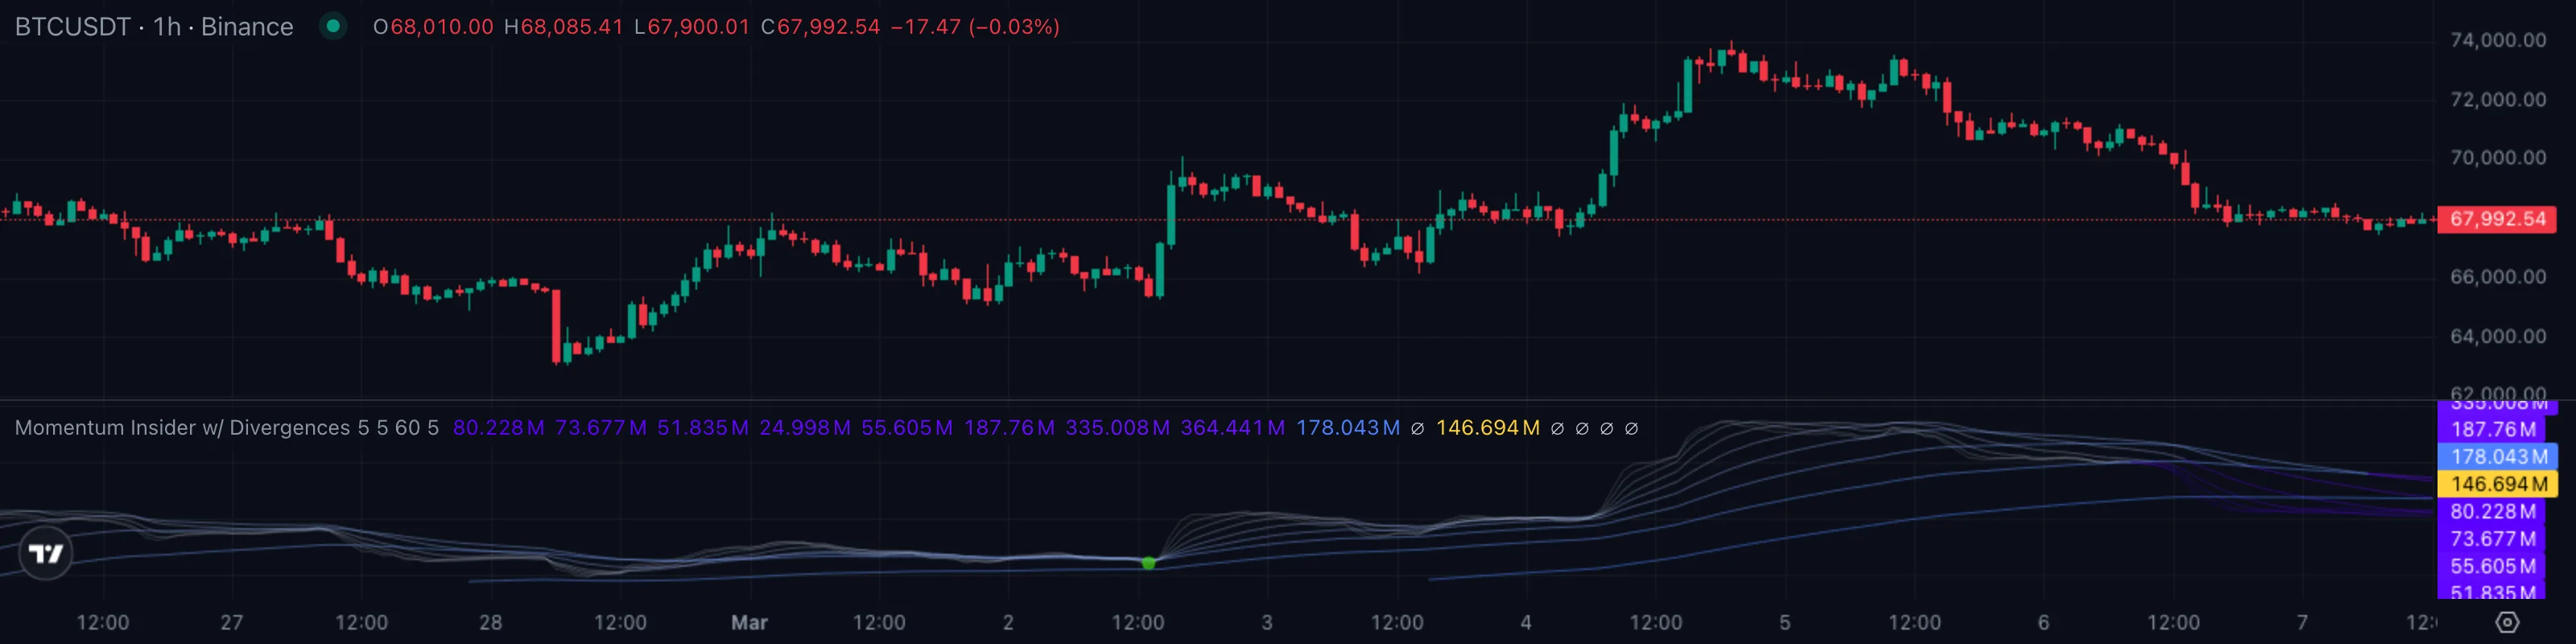
Every trend ends the same way. Price keeps printing new highs (or new lows), but the force behind those new prints is quietly fading. Volume thins out, each push takes longer, the bars get smaller. By the time price actually reverses, anyone watching the underlying momentum already had a warning — sometimes for many bars.
That gap between what price is doing and what momentum says price should be doing is what traders call divergenceDivergenceWhen price makes a new extreme but a momentum indicator (RSI, MACD, etc.) does not — a sign that the move is losing internal force even though it's still going.Click for full definition →. It's the single most reliable early-warning signal in technical analysis, and it's also the most easily miscounted by eye. Two questions you ask in front of every chart with an existing trend:
- Is this new high (or low) actually backed by strong volume-weighted momentum, or is it a hollow push?
- If momentum is fading, where exactly is the divergenceDivergenceWhen price makes a new extreme but a momentum indicator (RSI, MACD, etc.) does not — a sign that the move is losing internal force even though it's still going.Click for full definition →, and is it the kind that warns of a reversal or the kind that says the pullbackPullback (Retracement)A short, counter-trend move within an established trend — buyers (or sellers) momentarily losing ground before the trend resumes. Often the lowest-risk place to enter the trend.Click for full definition → is over?
Momentum Insider does the bookkeeping for you. It runs an OBVOn-Balance VolumeA running tally that adds a bar's volume on up-closes and subtracts it on down-closes. The slope shows whether net buying or net selling is accumulating.Click for full definition →-style volume-and-direction engine, smooths it through a fan of ten ribbons, and then automatically marks every confirmed pivotPivot High / Pivot LowA bar that is higher (or lower) than a defined number of bars on both sides. Confirmed only after the right-hand bars print without breaking it.Click for full definition → where price and momentum disagree.
2. How It Works Under the Hood
Three engines run in parallel:
- The OBVADOn-Balance VolumeA running tally that adds a bar's volume on up-closes and subtracts it on down-closes. The slope shows whether net buying or net selling is accumulating.Click for full definition → core — every bar contributes
volume × (close − open) ÷ (high − low) × hlcc4to a running total. In plain English, each bar's volume is signed by where it closed inside its range and weighted by a close-heavy typical price. Bars that close strong on big volume add a lot; bars that close weak subtract; flat-range bars contribute nothing. The running total is a deeper, smoother cousin of classic OBVOn-Balance VolumeA running tally that adds a bar's volume on up-closes and subtracts it on down-closes. The slope shows whether net buying or net selling is accumulating.Click for full definition →. - The DEMA ribbon fan — ten DEMAs of that running total at lengths 5, 8, 13, 21, 34, 55, 89, 144, 233, 377 (FibonacciFibonacci Retracement and ExtensionPullback depths (50, 61.8, 76.4 %) and projection multiples (1.618, 2.0, 2.618 of an initial leg) used to gauge whether retraces are healthy and to project realistic targets.Click for full definition → sequence). Faster ribbons sit on top of the bundle, slower ribbons anchorAnchored VWAPA VWAP that begins at a chosen pivot bar (a swing high or swing low) and runs forward. Anchoring makes the absolute level meaningful instead of drifting with whatever bars happen to load.Click for full definition → the bottom. Each ribbon flips between a violet "down" shade and a pale-blue "up" shade based on whether it's stretched above or below its neighbours.
- The divergenceDivergenceWhen price makes a new extreme but a momentum indicator (RSI, MACD, etc.) does not — a sign that the move is losing internal force even though it's still going.Click for full definition → detector — averages the first eight ribbons into a single oscillator (Dema11), then watches the oscillator for pivotPivot High / Pivot LowA bar that is higher (or lower) than a defined number of bars on both sides. Confirmed only after the right-hand bars print without breaking it.Click for full definition → highs and pivotPivot High / Pivot LowA bar that is higher (or lower) than a defined number of bars on both sides. Confirmed only after the right-hand bars print without breaking it.Click for full definition → lows. When a pivotPivot High / Pivot LowA bar that is higher (or lower) than a defined number of bars on both sides. Confirmed only after the right-hand bars print without breaking it.Click for full definition → confirms, it compares that pivotPivot High / Pivot LowA bar that is higher (or lower) than a defined number of bars on both sides. Confirmed only after the right-hand bars print without breaking it.Click for full definition → to the previous one and labels any mismatch with price as one of four divergenceDivergenceWhen price makes a new extreme but a momentum indicator (RSI, MACD, etc.) does not — a sign that the move is losing internal force even though it's still going.Click for full definition → types.
How the detector picks its signal. Every confirmed pivotPivot High / Pivot LowA bar that is higher (or lower) than a defined number of bars on both sides. Confirmed only after the right-hand bars print without breaking it.Click for full definition →, the indicator asks two questions:
- Did price make a new extreme that momentum didn't match (or vice versa)? That's the divergenceDivergenceWhen price makes a new extreme but a momentum indicator (RSI, MACD, etc.) does not — a sign that the move is losing internal force even though it's still going.Click for full definition → definition.
- Was the previous pivotPivot High / Pivot LowA bar that is higher (or lower) than a defined number of bars on both sides. Confirmed only after the right-hand bars print without breaking it.Click for full definition → recent enough to compare against? Default range is 5 to 60 bars between pivotsPivot High / Pivot LowA bar that is higher (or lower) than a defined number of bars on both sides. Confirmed only after the right-hand bars print without breaking it.Click for full definition →. Anything outside that window is ignored — too close is noise, too far is a different market regime.
| What you're seeing | Marker | Plain English |
|---|---|---|
| Price prints a lower low, oscillator prints a higher low | 🟢 Green up-triangle | Regular bullish divergenceDivergenceWhen price makes a new extreme but a momentum indicator (RSI, MACD, etc.) does not — a sign that the move is losing internal force even though it's still going.Click for full definition → — selling is exhausted |
| Price prints a higher low, oscillator prints a lower low | 🟢 Green circle | Hidden bullish divergenceDivergenceWhen price makes a new extreme but a momentum indicator (RSI, MACD, etc.) does not — a sign that the move is losing internal force even though it's still going.Click for full definition → — pullbackPullback (Retracement)A short, counter-trend move within an established trend — buyers (or sellers) momentarily losing ground before the trend resumes. Often the lowest-risk place to enter the trend.Click for full definition → in an uptrend is finishing |
| Price prints a higher high, oscillator prints a lower high | 🔴 Yellow down-triangle | Regular bearish divergenceDivergenceWhen price makes a new extreme but a momentum indicator (RSI, MACD, etc.) does not — a sign that the move is losing internal force even though it's still going.Click for full definition → — buying is exhausted |
| Price prints a lower high, oscillator prints a higher high | 🔴 Yellow circle | Hidden bearish divergenceDivergenceWhen price makes a new extreme but a momentum indicator (RSI, MACD, etc.) does not — a sign that the move is losing internal force even though it's still going.Click for full definition → — pullbackPullback (Retracement)A short, counter-trend move within an established trend — buyers (or sellers) momentarily losing ground before the trend resumes. Often the lowest-risk place to enter the trend.Click for full definition → in a downtrend is finishing |
The pivotPivot High / Pivot LowA bar that is higher (or lower) than a defined number of bars on both sides. Confirmed only after the right-hand bars print without breaking it.Click for full definition → lookback (default 5 left and 5 right) is what stops the indicator from flagging every minor wiggle. A pivotPivot High / Pivot LowA bar that is higher (or lower) than a defined number of bars on both sides. Confirmed only after the right-hand bars print without breaking it.Click for full definition → doesn't exist until five bars have passed without a higher high — so every marker on the chart is a confirmed swing, not a guess.
3. What You See on the Chart
| Element | Looks like | Means |
|---|---|---|
| Inner ribbons (fast) | Tight bundle of pale-blue or violet lines | Short-term volume-weighted momentum, length 5 to 21 |
| Middle ribbons | Wider bundle of the same lines | Medium-term momentum, length 34 to 89 |
| Outer ribbons (slow) | Darker, more opaque lines | Long-term momentum, length 144 to 377 |
| Ribbon colour pale-blue / white | Up state | That ribbon is leading its neighbours higher |
| Ribbon colour violet | Down state | That ribbon is lagging its neighbours, momentum cooling |
| Yellow tag on right axis | Last-value label only | Dema11 oscillator value (line itself is hidden by design) |
| Green up-triangle | Small triangle below the ribbon fan | Regular bullish divergenceDivergenceWhen price makes a new extreme but a momentum indicator (RSI, MACD, etc.) does not — a sign that the move is losing internal force even though it's still going.Click for full definition → at a pivot lowPivot High / Pivot LowA bar that is higher (or lower) than a defined number of bars on both sides. Confirmed only after the right-hand bars print without breaking it.Click for full definition → |
| Green circle | Small dot below the ribbon fan | Hidden bullish divergenceDivergenceWhen price makes a new extreme but a momentum indicator (RSI, MACD, etc.) does not — a sign that the move is losing internal force even though it's still going.Click for full definition → at a pivot lowPivot High / Pivot LowA bar that is higher (or lower) than a defined number of bars on both sides. Confirmed only after the right-hand bars print without breaking it.Click for full definition → |
| Yellow down-triangle | Small triangle above the ribbon fan | Regular bearish divergenceDivergenceWhen price makes a new extreme but a momentum indicator (RSI, MACD, etc.) does not — a sign that the move is losing internal force even though it's still going.Click for full definition → at a pivot highPivot High / Pivot LowA bar that is higher (or lower) than a defined number of bars on both sides. Confirmed only after the right-hand bars print without breaking it.Click for full definition → |
| Yellow circle | Small dot above the ribbon fan | Hidden bearish divergenceDivergenceWhen price makes a new extreme but a momentum indicator (RSI, MACD, etc.) does not — a sign that the move is losing internal force even though it's still going.Click for full definition → at a pivot highPivot High / Pivot LowA bar that is higher (or lower) than a defined number of bars on both sides. Confirmed only after the right-hand bars print without breaking it.Click for full definition → |
Default colour scheme: pale-blue / violet for the ribbon fan, green for bullish markers, yellow for bearish markers. Triangles mark the regular (reversal-warning) divergencesDivergenceWhen price makes a new extreme but a momentum indicator (RSI, MACD, etc.) does not — a sign that the move is losing internal force even though it's still going.Click for full definition →. Circles mark the hidden (trend-continuation) divergencesDivergenceWhen price makes a new extreme but a momentum indicator (RSI, MACD, etc.) does not — a sign that the move is losing internal force even though it's still going.Click for full definition →.
4. Reading It in 3 Patterns
Pattern A — Regular bearish divergenceDivergenceWhen price makes a new extreme but a momentum indicator (RSI, MACD, etc.) does not — a sign that the move is losing internal force even though it's still going.Click for full definition → at a top
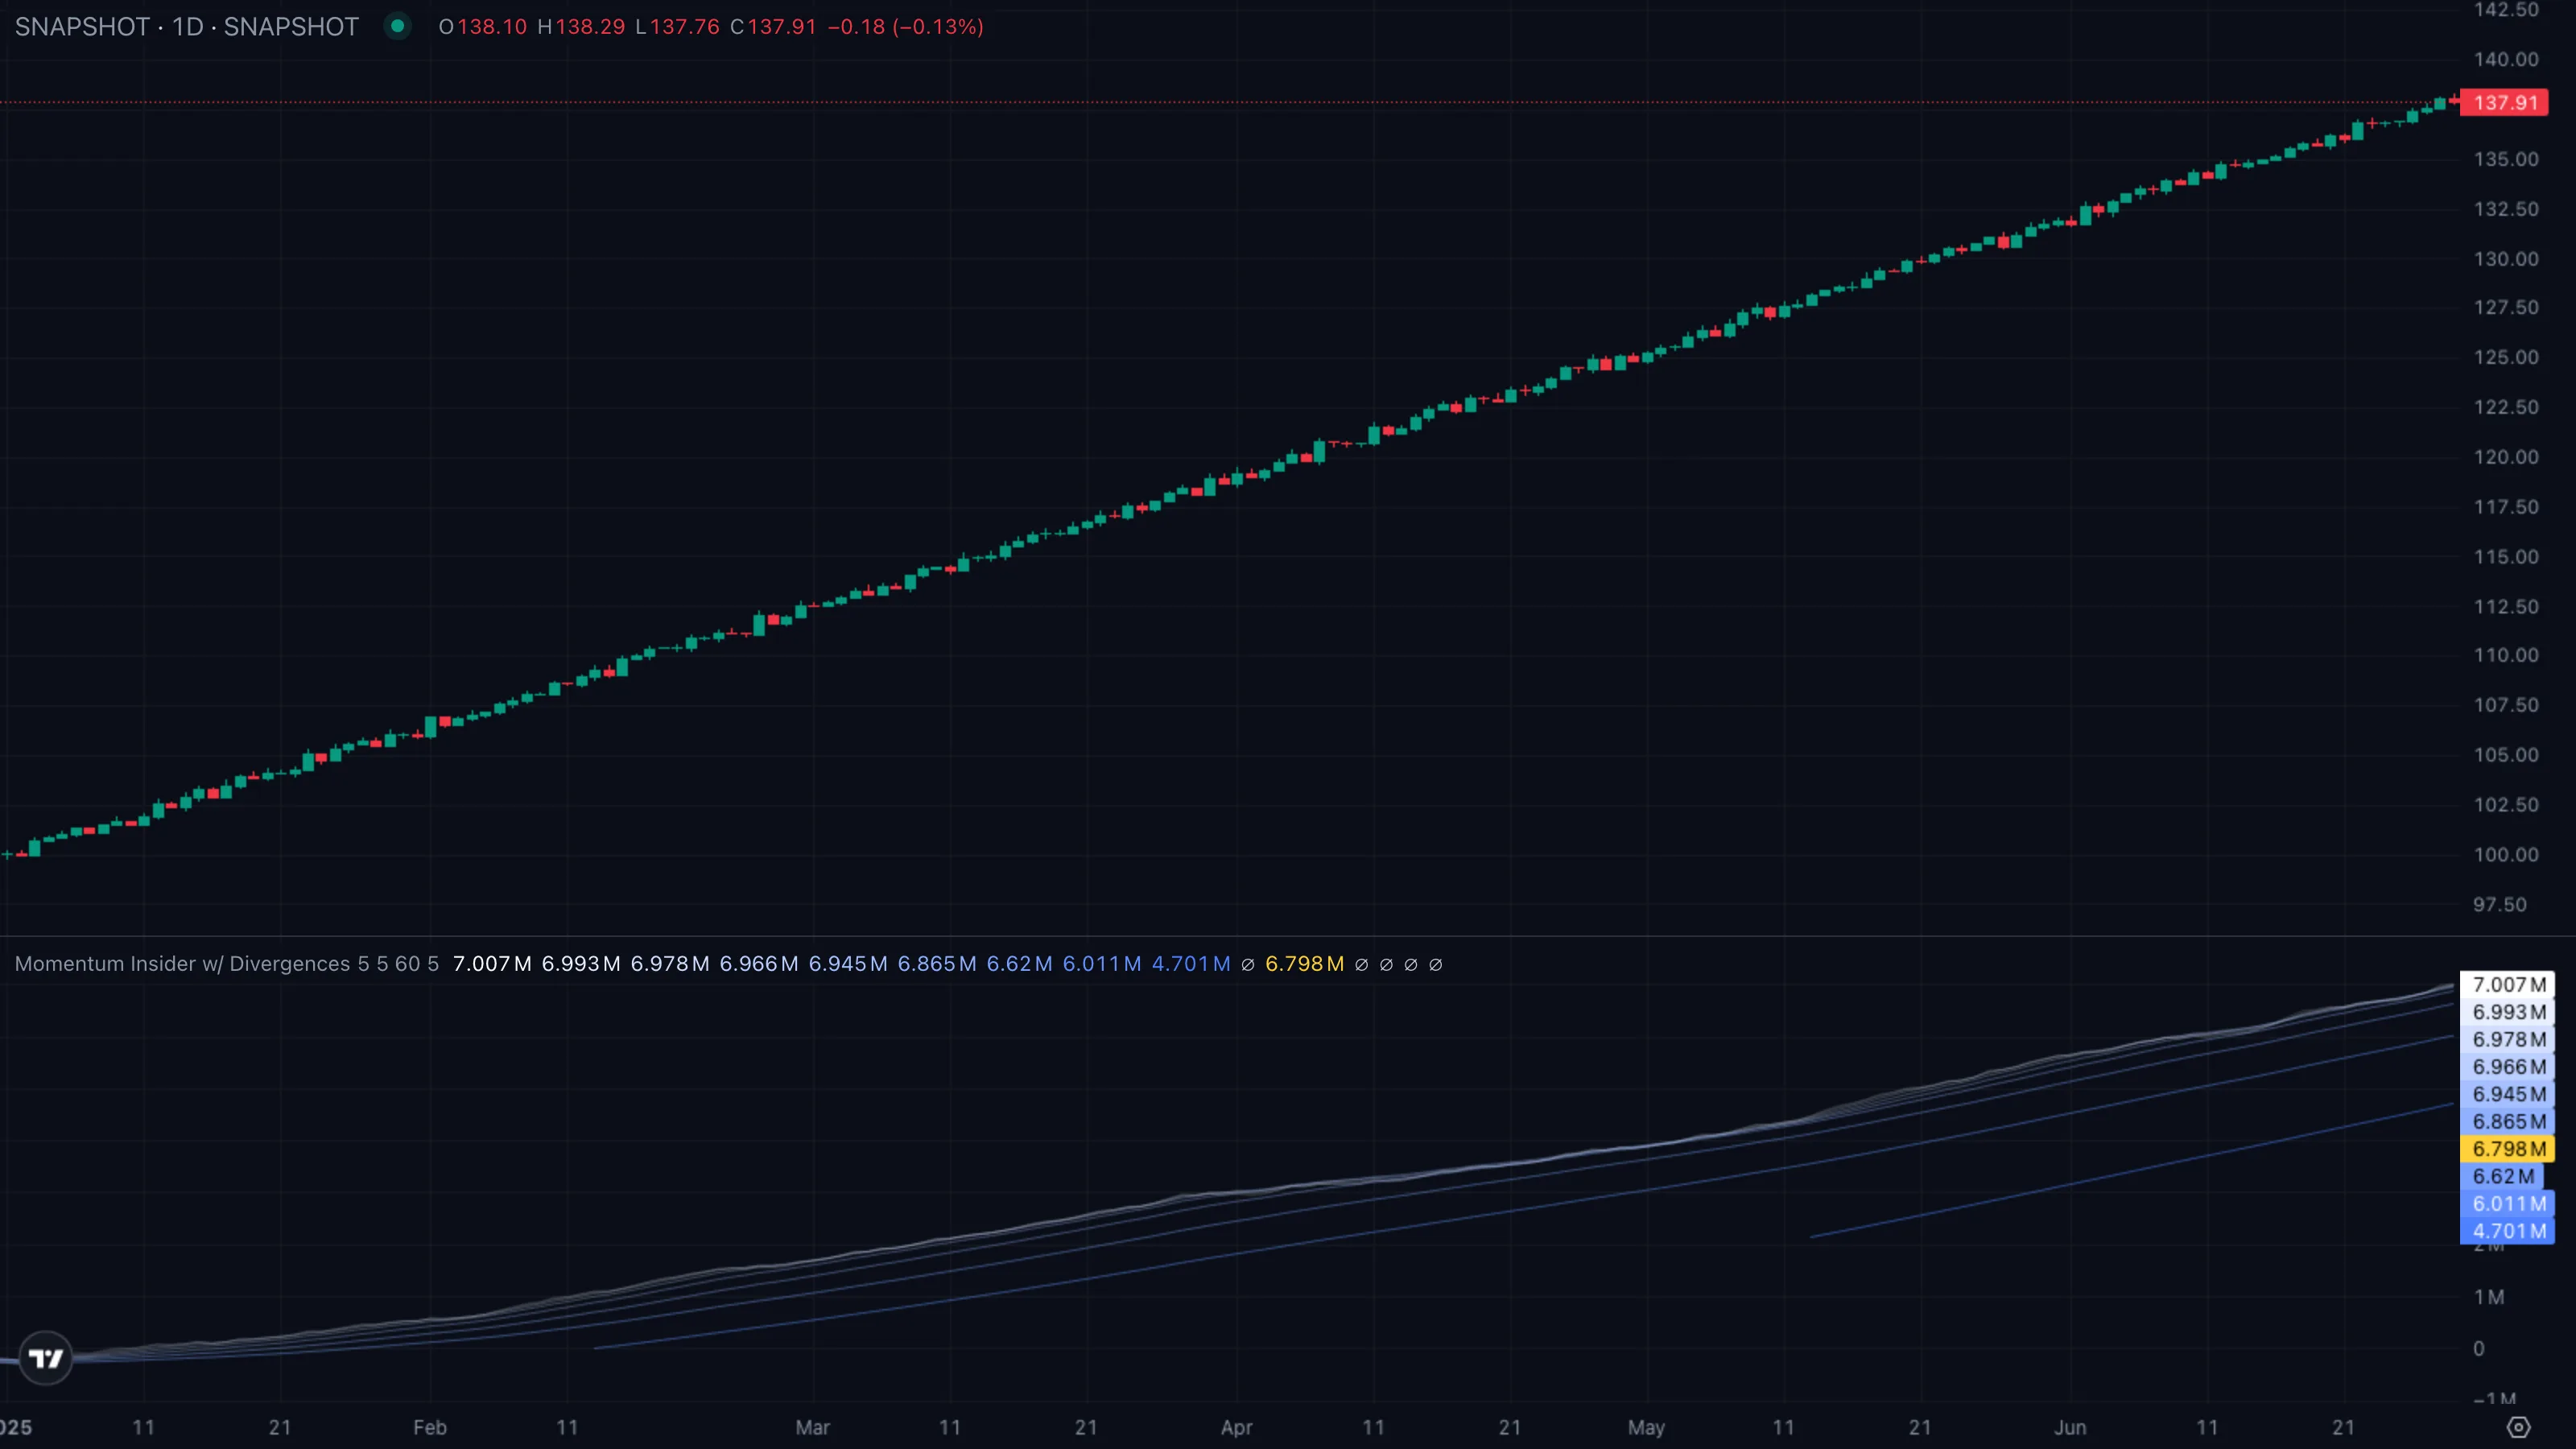
| What you see | ① Price prints a clear higher high ② ribbon fan stops expanding upward, more ribbons turn violet ③ a yellow down-triangle prints at the pivot highPivot High / Pivot LowA bar that is higher (or lower) than a defined number of bars on both sides. Confirmed only after the right-hand bars print without breaking it.Click for full definition →. |
| What it means | Price went up but the volume-weighted engine didn't. Buyers are pushing the price marker but the underlying flow has stopped following. This is the textbook setup for a reversal warning. |
| What to do | Tighten longs and stop adding to them. Wait for a structureMarket StructureThe pattern of swing highs and lows price prints as it moves. Healthy uptrends print higher highs and higher lows; healthy downtrends print the mirror.Click for full definition → break (a lower low on price action) before considering shorts — divergenceDivergenceWhen price makes a new extreme but a momentum indicator (RSI, MACD, etc.) does not — a sign that the move is losing internal force even though it's still going.Click for full definition → alone is a heads-up, not an entry. |
Pattern B — Regular bullish divergenceDivergenceWhen price makes a new extreme but a momentum indicator (RSI, MACD, etc.) does not — a sign that the move is losing internal force even though it's still going.Click for full definition → at a bottom
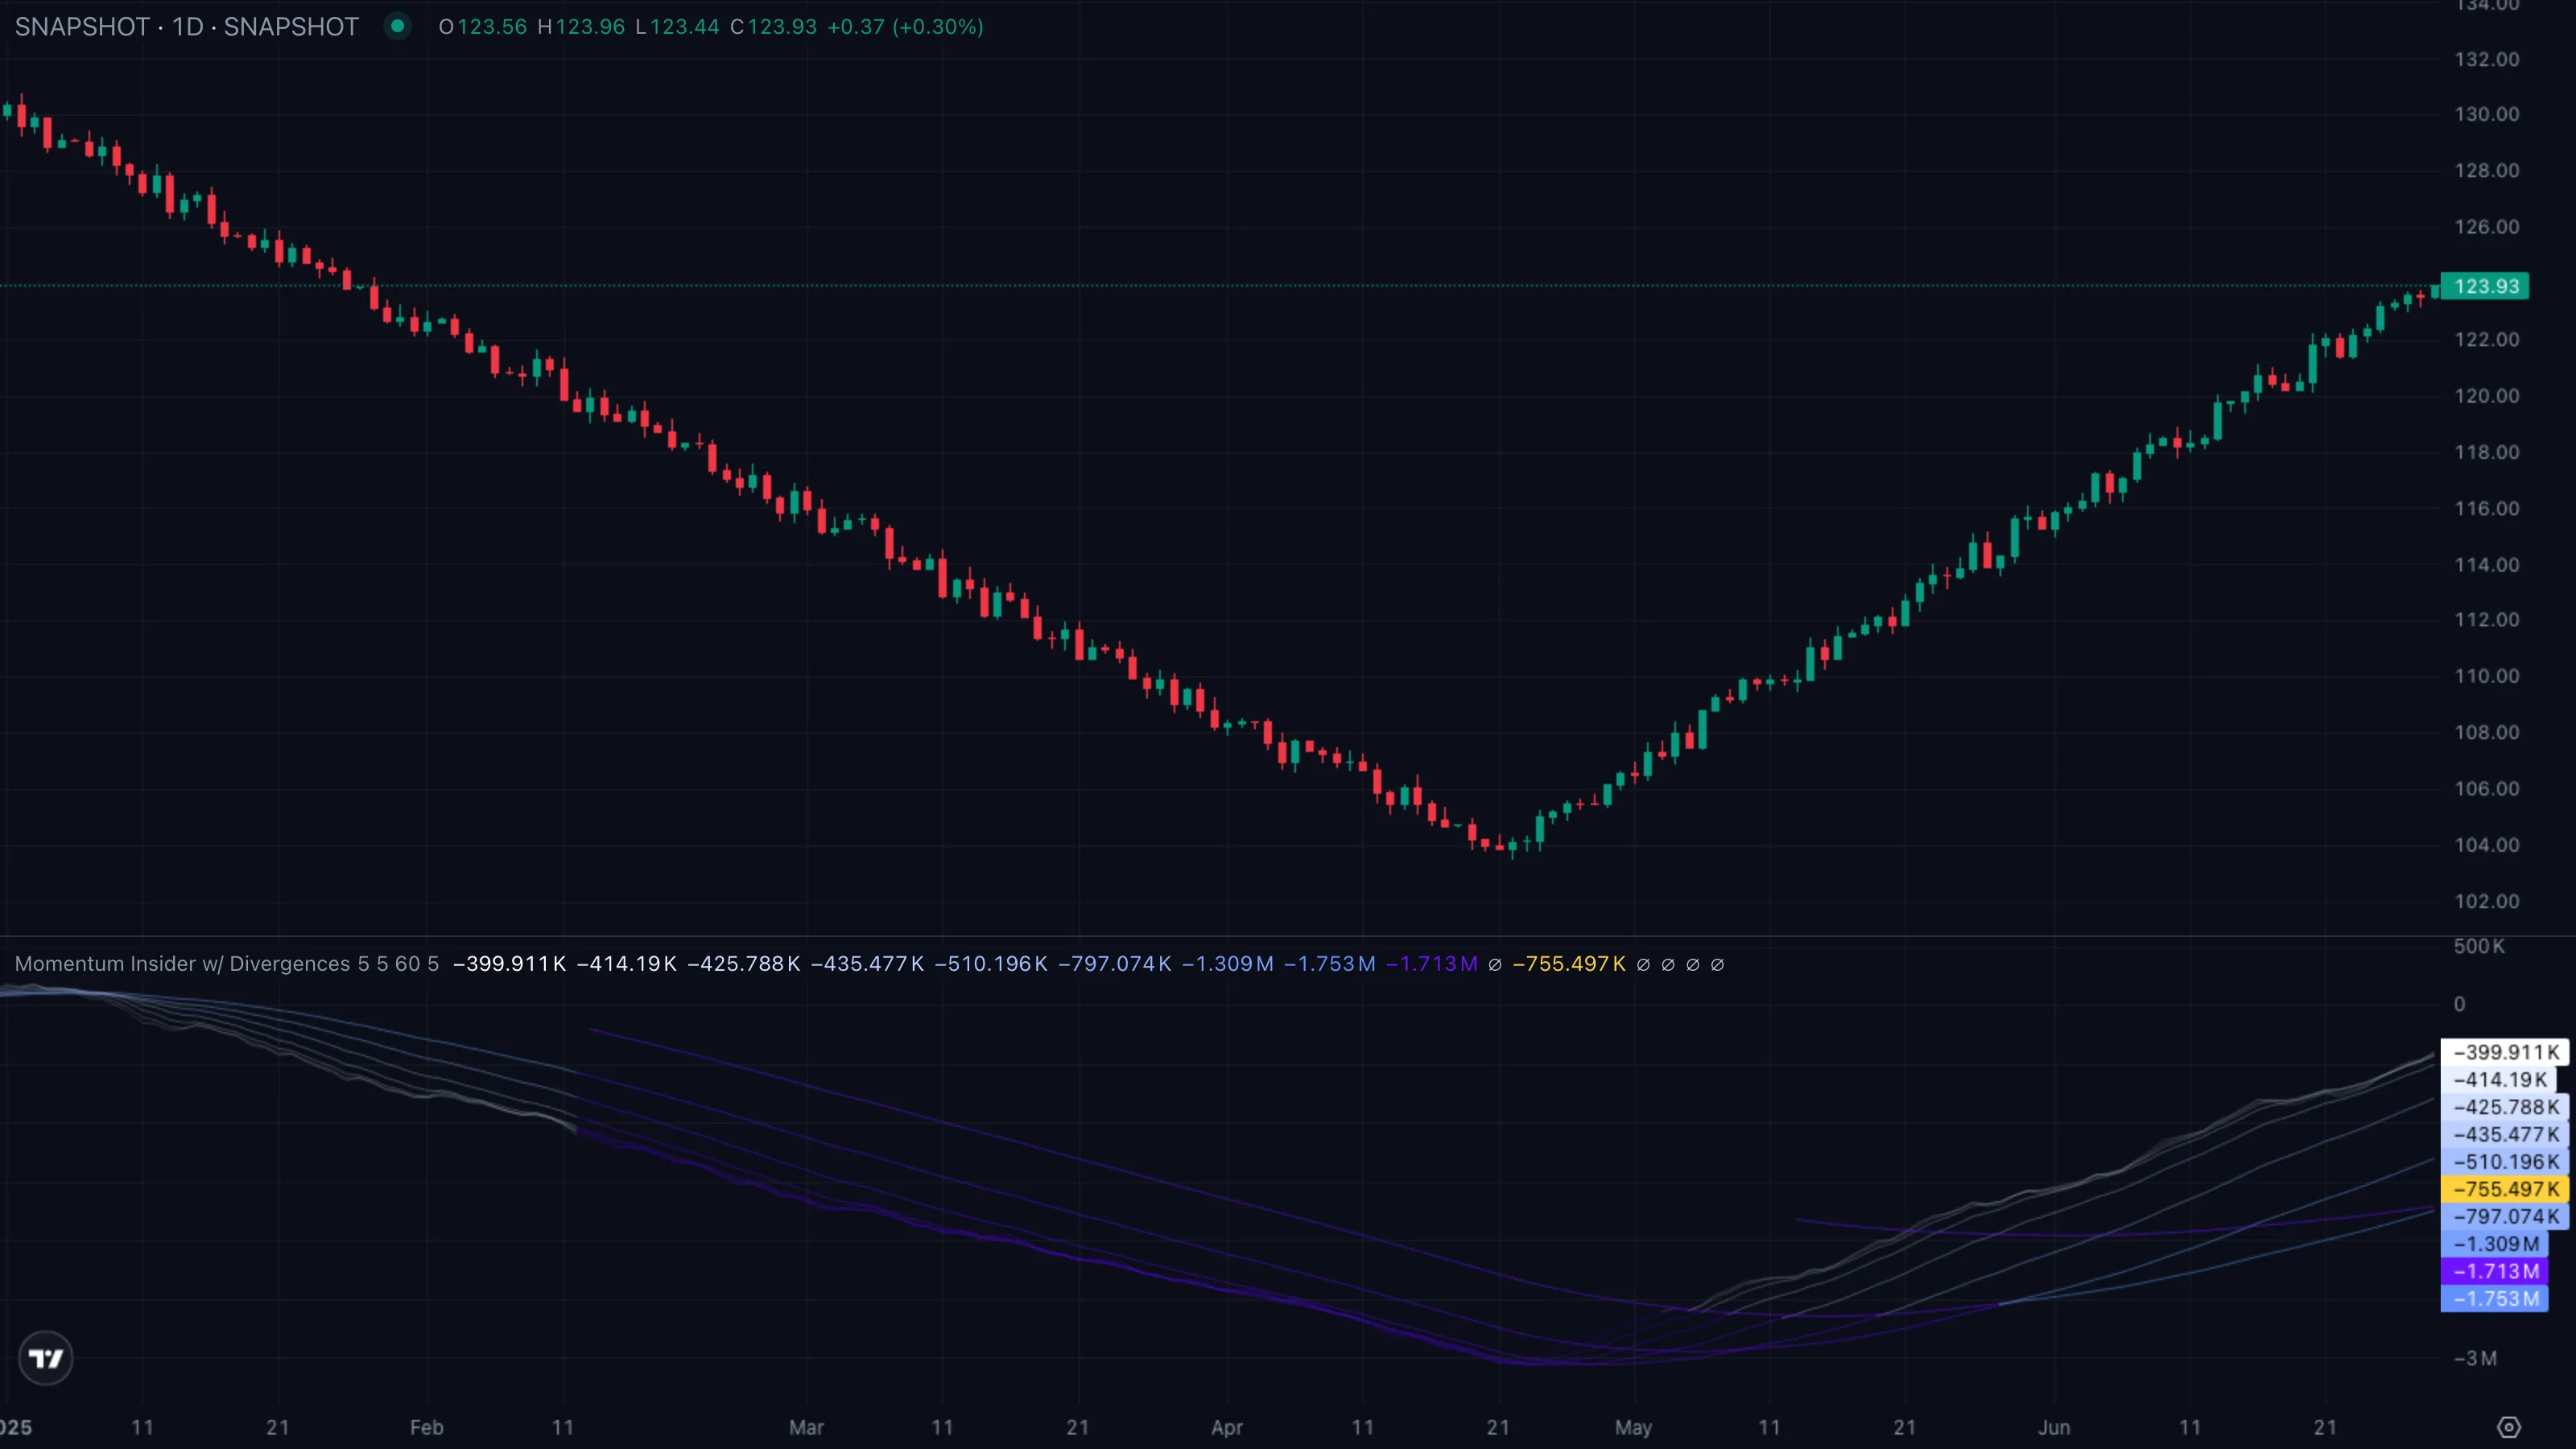
| What you see | ① Price prints a lower low ② ribbon fan stops collapsing, inner ribbons start flipping pale-blue ③ a green up-triangle prints at the pivot lowPivot High / Pivot LowA bar that is higher (or lower) than a defined number of bars on both sides. Confirmed only after the right-hand bars print without breaking it.Click for full definition →. |
| What it means | Sellers can still drive a new low on price but the flow underneath has stopped following them down. The selling impulse is exhausted even though the price chart hasn't shown it yet. |
| What to do | Stop fading rallies. Watch for the ribbon fan to roll up and a higher low to confirm — that's where the trade lives, not at the divergenceDivergenceWhen price makes a new extreme but a momentum indicator (RSI, MACD, etc.) does not — a sign that the move is losing internal force even though it's still going.Click for full definition → marker itself. |
Pattern C — Hidden bullish divergenceDivergenceWhen price makes a new extreme but a momentum indicator (RSI, MACD, etc.) does not — a sign that the move is losing internal force even though it's still going.Click for full definition → inside an uptrend
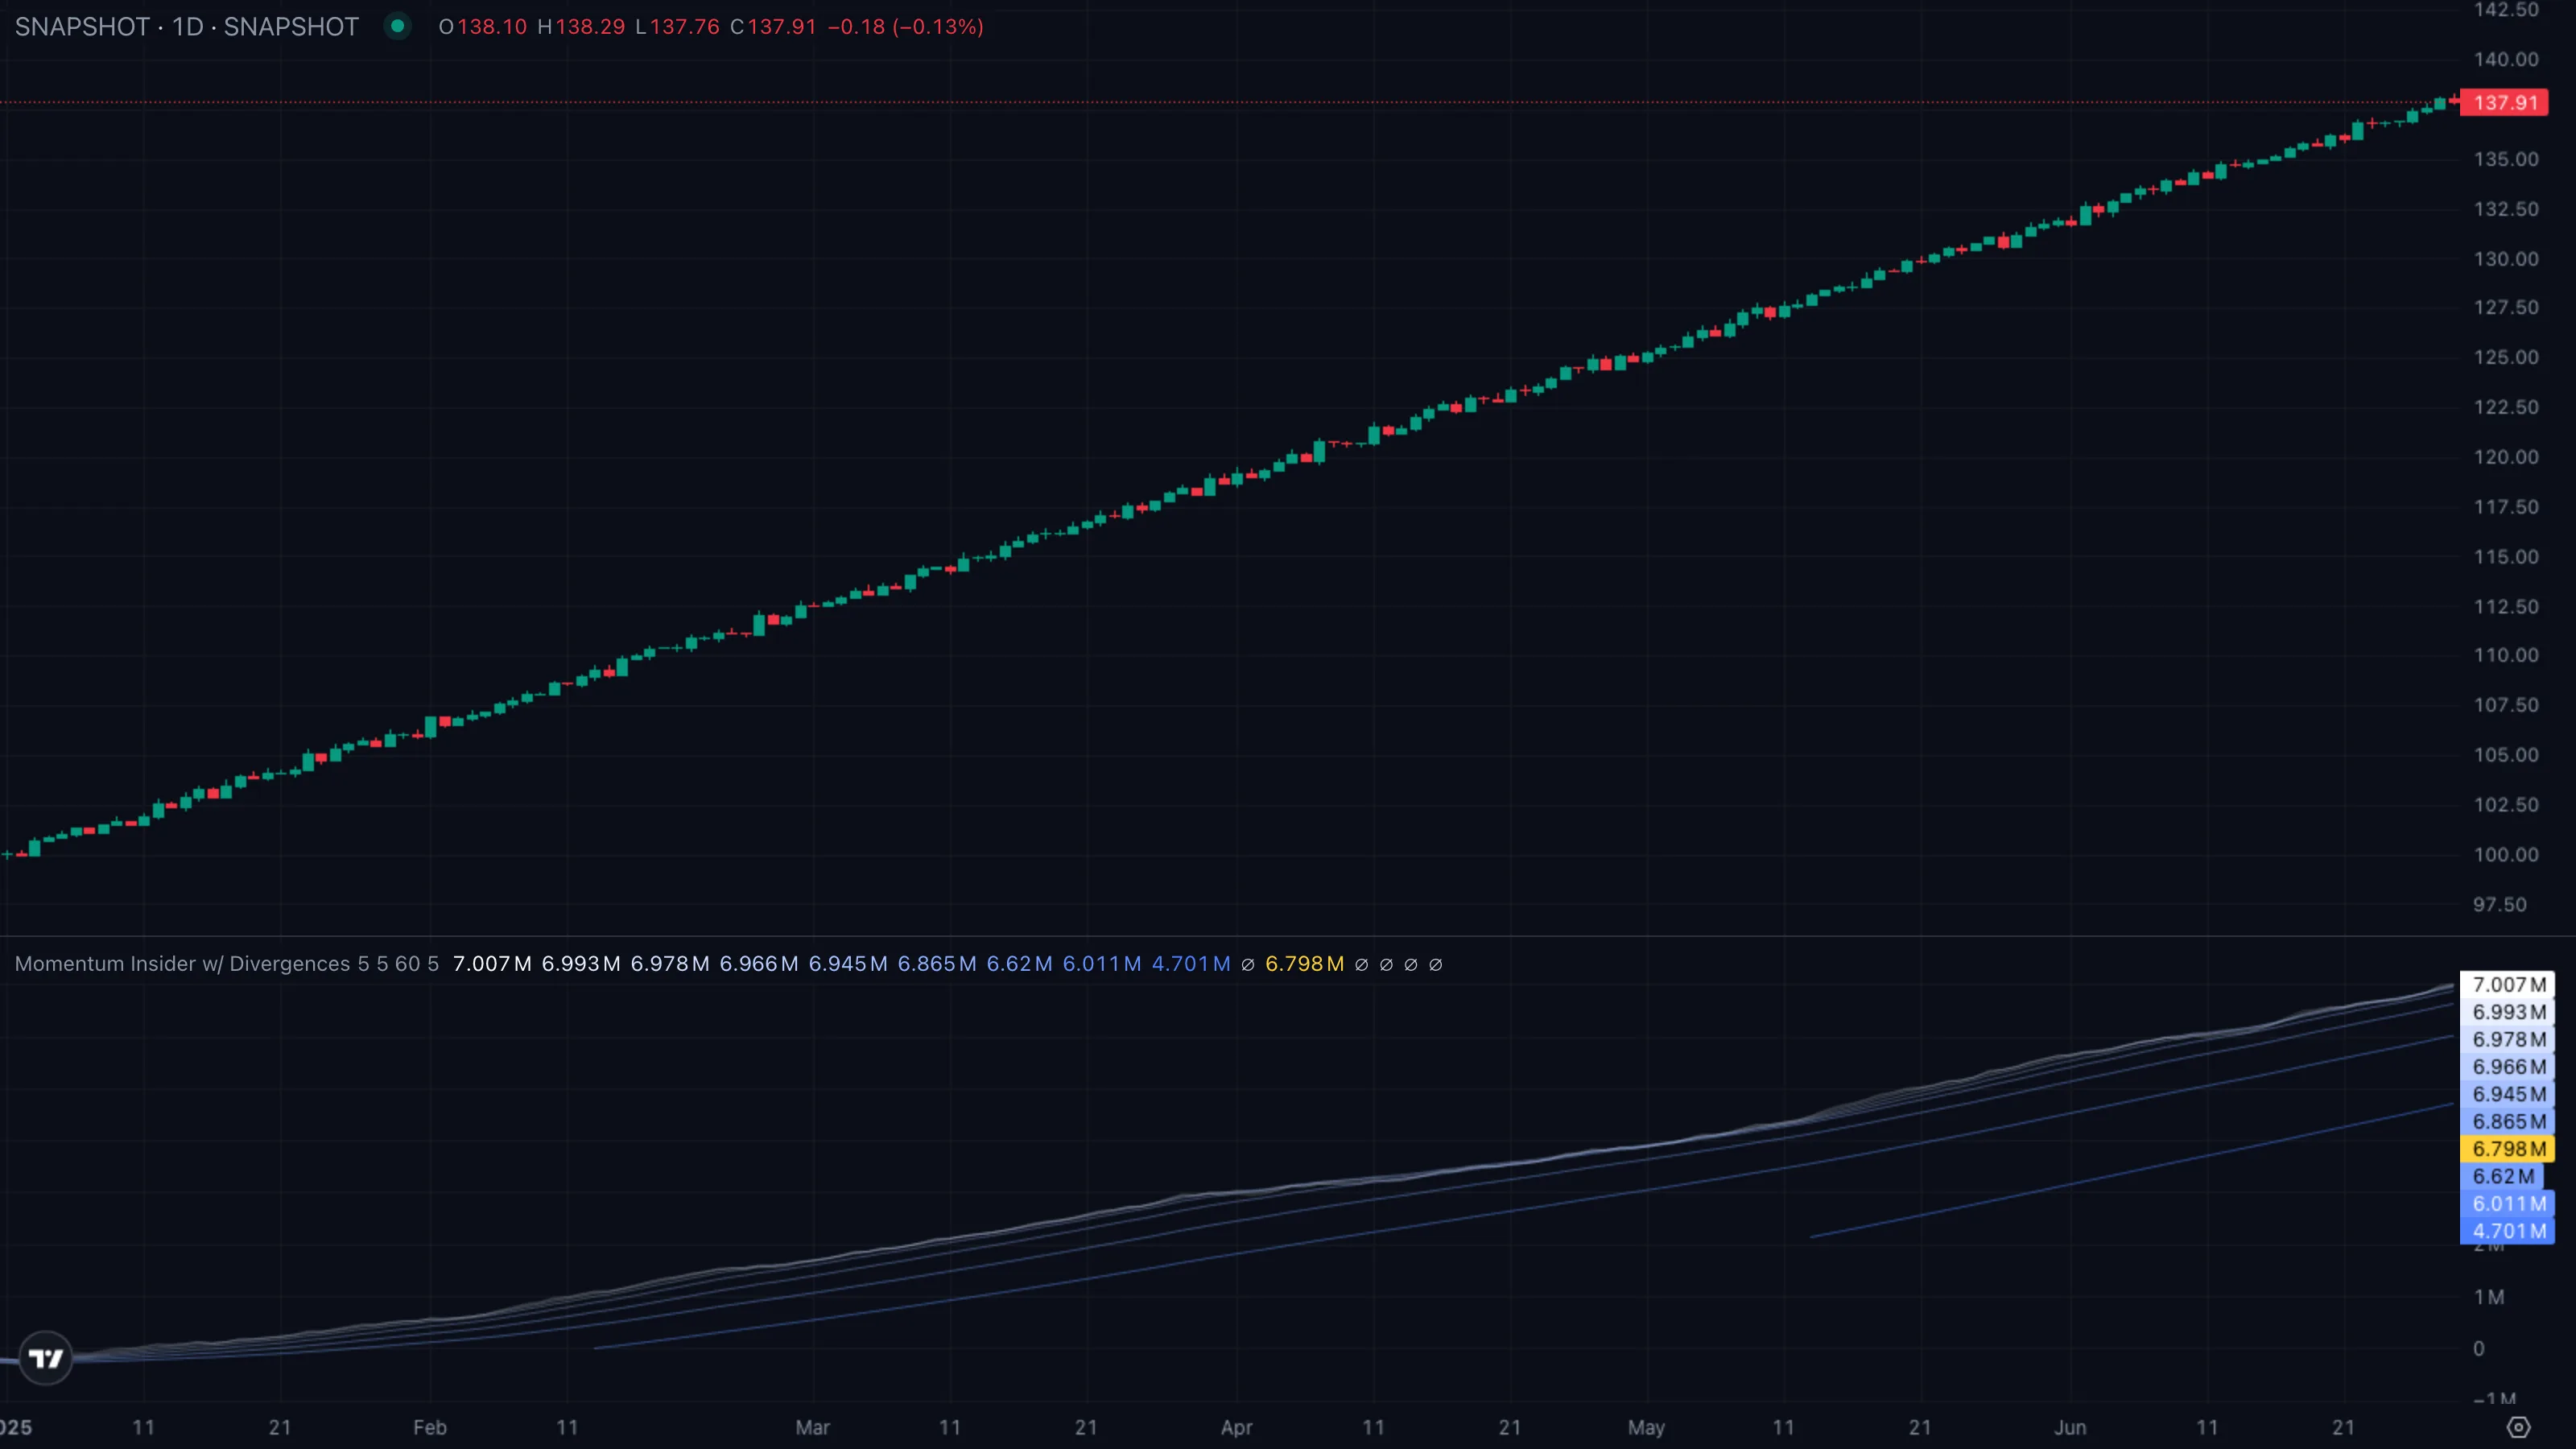
| What you see | ① Uptrend already in place, ribbon fan tilted up ② price pulls back to a higher low ③ oscillator dips deeper than its previous low and prints a green circle at that pivotPivot High / Pivot LowA bar that is higher (or lower) than a defined number of bars on both sides. Confirmed only after the right-hand bars print without breaking it.Click for full definition →. |
| What it means | The pullbackPullback (Retracement)A short, counter-trend move within an established trend — buyers (or sellers) momentarily losing ground before the trend resumes. Often the lowest-risk place to enter the trend.Click for full definition → shook out more momentum than price let on, but price held its higher-low structureMarket StructureThe pattern of swing highs and lows price prints as it moves. Healthy uptrends print higher highs and higher lows; healthy downtrends print the mirror.Click for full definition →. That's the classic "shakeout finished" footprint — trend should resume. |
| What to do | Bias long. The hidden bullish circle is the green light to take the pullbackPullback (Retracement)A short, counter-trend move within an established trend — buyers (or sellers) momentarily losing ground before the trend resumes. Often the lowest-risk place to enter the trend.Click for full definition → entry; stop goes just under the higher low that printed the marker. |
5. Trade Walkthrough
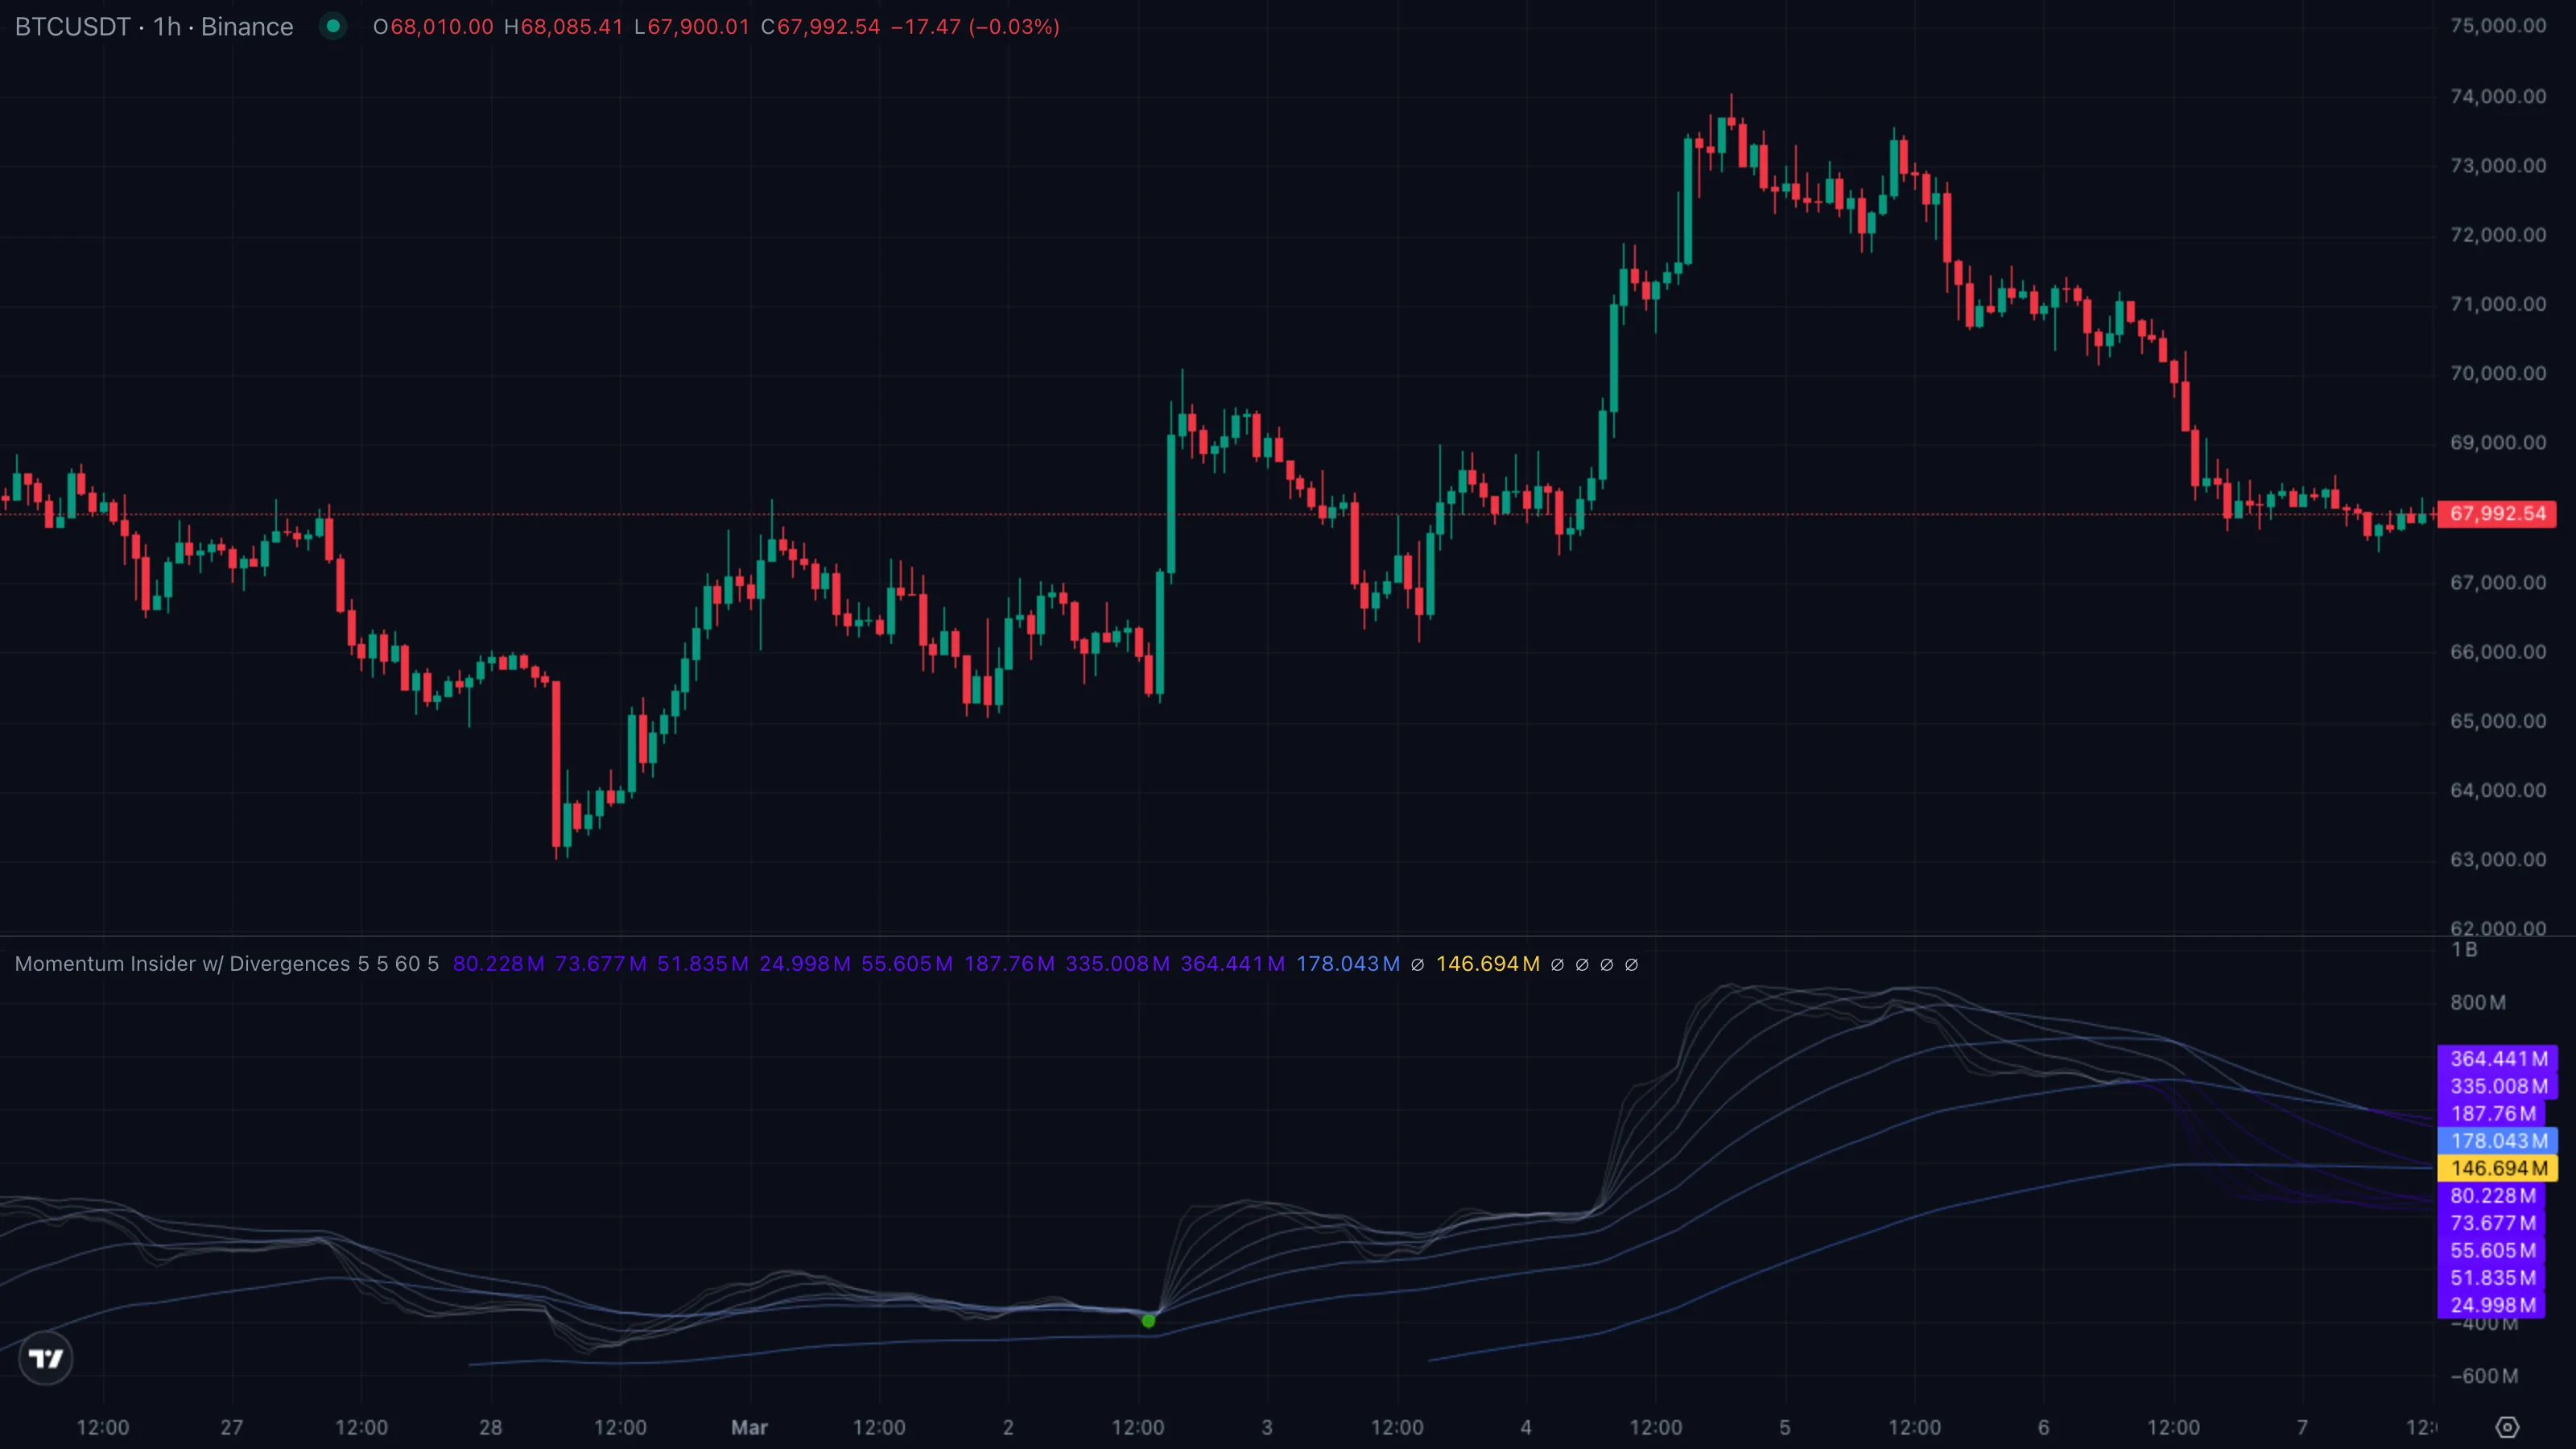
| Symbol | BTCUSDT |
|---|---|
| Timeframe | 1H |
| Venue | Binance |
| Window | 10 Mar to 22 Mar 2026 |
| Pattern | A — regular bearish divergenceDivergenceWhen price makes a new extreme but a momentum indicator (RSI, MACD, etc.) does not — a sign that the move is losing internal force even though it's still going.Click for full definition → at a top |
A clean reversal setup. BTC ground higher from 82,400 to roughly 91,200 through mid-March on shrinking volume bars, then printed a regular bearish divergenceDivergenceWhen price makes a new extreme but a momentum indicator (RSI, MACD, etc.) does not — a sign that the move is losing internal force even though it's still going.Click for full definition → on 17 March at the local top. Price rolled over for a 6 % unwind into the back half of the window. The numbered markers ①–④ on the chart map to the four phases of the trade below.
The sequence
| # | When | BTC price | Indicator state | What it tells you |
|---|---|---|---|---|
| ① | 10 Mar to 14 Mar | 82,400 to 88,500 push | ribbon fan opening up, pale-blue dominant | Healthy uptrend, no divergenceDivergenceWhen price makes a new extreme but a momentum indicator (RSI, MACD, etc.) does not — a sign that the move is losing internal force even though it's still going.Click for full definition → yet. Stay long if already positioned. |
| ② | 17 Mar | ~91,200 high | yellow down-triangle prints | Pattern A trigger. Price made a higher high vs the 14 Mar pivotPivot High / Pivot LowA bar that is higher (or lower) than a defined number of bars on both sides. Confirmed only after the right-hand bars print without breaking it.Click for full definition → but the oscillator made a lower high. Reversal warning is now on the chart. |
| ③ | 18 Mar | ~89,800 close | inner ribbons flip violet, fan compressing | StructureMarket StructureThe pattern of swing highs and lows price prints as it moves. Healthy uptrends print higher highs and higher lows; healthy downtrends print the mirror.Click for full definition → break confirms the divergenceDivergenceWhen price makes a new extreme but a momentum indicator (RSI, MACD, etc.) does not — a sign that the move is losing internal force even though it's still going.Click for full definition →. The real exit / short entry. |
| ④ | 21 Mar | ~85,700 low | fan still tilted down | Move played out. Cue to take profit on shorts before the next pivot lowPivot High / Pivot LowA bar that is higher (or lower) than a defined number of bars on both sides. Confirmed only after the right-hand bars print without breaking it.Click for full definition → forms. |
The trade in one card
| What you skipped | Shorting the divergenceDivergenceWhen price makes a new extreme but a momentum indicator (RSI, MACD, etc.) does not — a sign that the move is losing internal force even though it's still going.Click for full definition → bar at 91,200 — premature, with no confirmation. Easily stopped out on the next push. |
| What you took | Exit longs on the structureMarket StructureThe pattern of swing highs and lows price prints as it moves. Healthy uptrends print higher highs and higher lows; healthy downtrends print the mirror.Click for full definition → break at ~89,800; opportunistic short on the same break, ribbon fan flipping violet. |
| Where you exited | Took profit near 85,700 as the fan stabilised and a new pivot lowPivot High / Pivot LowA bar that is higher (or lower) than a defined number of bars on both sides. Confirmed only after the right-hand bars print without breaking it.Click for full definition → looked likely. |
| Move captured | ~ +4.6 % short side over roughly three days, plus the saved drawdown on longs. |
Lesson
The divergenceDivergenceWhen price makes a new extreme but a momentum indicator (RSI, MACD, etc.) does not — a sign that the move is losing internal force even though it's still going.Click for full definition → triangle gives you the alert. The first structureMarket StructureThe pattern of swing highs and lows price prints as it moves. Healthy uptrends print higher highs and higher lows; healthy downtrends print the mirror.Click for full definition → break with the ribbons flipping colour gives you the trade. The fan stabilising at the next pivotPivot High / Pivot LowA bar that is higher (or lower) than a defined number of bars on both sides. Confirmed only after the right-hand bars print without breaking it.Click for full definition → tells you the reversal is mostly done and it's time to step out.
6. Common Pitfalls
- Trading the marker bar itself. A divergenceDivergenceWhen price makes a new extreme but a momentum indicator (RSI, MACD, etc.) does not — a sign that the move is losing internal force even though it's still going.Click for full definition → triangle or circle is not an entry signal — it's a heads-up. The marker prints at a confirmed pivotPivot High / Pivot LowA bar that is higher (or lower) than a defined number of bars on both sides. Confirmed only after the right-hand bars print without breaking it.Click for full definition →, but the trend can still grind one or two more bars in the original direction before structureMarket StructureThe pattern of swing highs and lows price prints as it moves. Healthy uptrends print higher highs and higher lows; healthy downtrends print the mirror.Click for full definition → actually breaks. Always wait for confirmation.
- Counting divergencesDivergenceWhen price makes a new extreme but a momentum indicator (RSI, MACD, etc.) does not — a sign that the move is losing internal force even though it's still going.Click for full definition → across regimes. The 5-to-60-bar range filter is there to keep comparisons honest. If you eyeball a divergenceDivergenceWhen price makes a new extreme but a momentum indicator (RSI, MACD, etc.) does not — a sign that the move is losing internal force even though it's still going.Click for full definition → between two pivotsPivot High / Pivot LowA bar that is higher (or lower) than a defined number of bars on both sides. Confirmed only after the right-hand bars print without breaking it.Click for full definition → that are 200 bars apart, you're comparing two different markets — the indicator deliberately does not flag that for you.
- Confusing regular and hidden divergenceDivergenceWhen price makes a new extreme but a momentum indicator (RSI, MACD, etc.) does not — a sign that the move is losing internal force even though it's still going.Click for full definition →. Triangles warn of reversal (trend ending). Circles confirm continuation (pullbackPullback (Retracement)A short, counter-trend move within an established trend — buyers (or sellers) momentarily losing ground before the trend resumes. Often the lowest-risk place to enter the trend.Click for full definition → ending). Trading them backwards is the single most common mistake — circles are not weaker triangles, they mean the opposite thing.
- Ignoring ribbon colour after the marker. A regular bearish triangle followed by ribbons that stay pale-blue is a failed signal. The fan flipping violet across multiple ribbons is what turns the warning into a tradeable read.
- Using it on illiquid pairs. OBVADOn-Balance VolumeA running tally that adds a bar's volume on up-closes and subtracts it on down-closes. The slope shows whether net buying or net selling is accumulating.Click for full definition → relies on volume. On thin alts where volume prints in clumps, the running total gets distorted by single fat bars and the ribbons can't smooth that out. Stick to BTC, ETH, and the top-volume pairs for execution.