

Momentum Levels V3
Auto-drawn support and resistance pulled from the previous higher-timeframe bar's range, projected forward as a price ladder so you know where this period is likely to react.
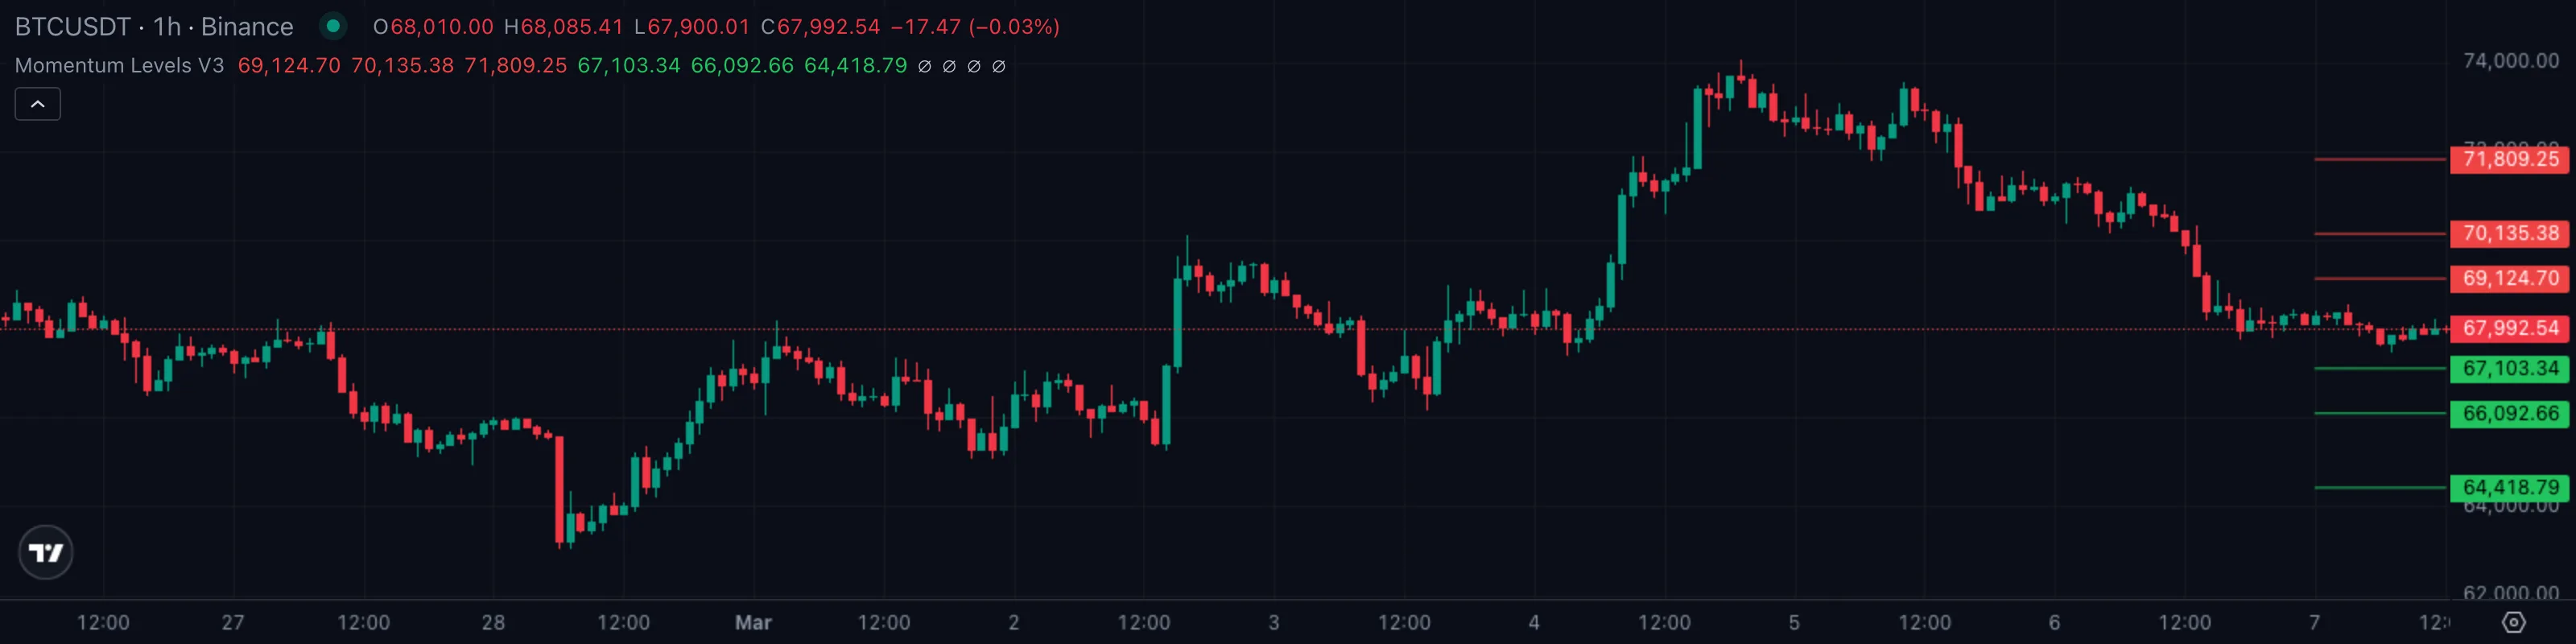
1. What This Indicator Watches For
Price doesn't just drift — it ricochets between specific prices, pauses at them, reverses off them, snaps back after stretching too far. Yesterday's high becomes today's ceiling. Last week's low becomes next week's floor. The previous period's range quietly maps the current period's playing field, and the traders who can see that map have an edge over the traders who can't.
Drawing it cleanly is the hard part. Manually plotting the prior bar's high, low, midpoint and a few extension targets every morning across ten different charts is impossible — and the moment a new period rolls over, the old levels are stale and have to be redrawn.
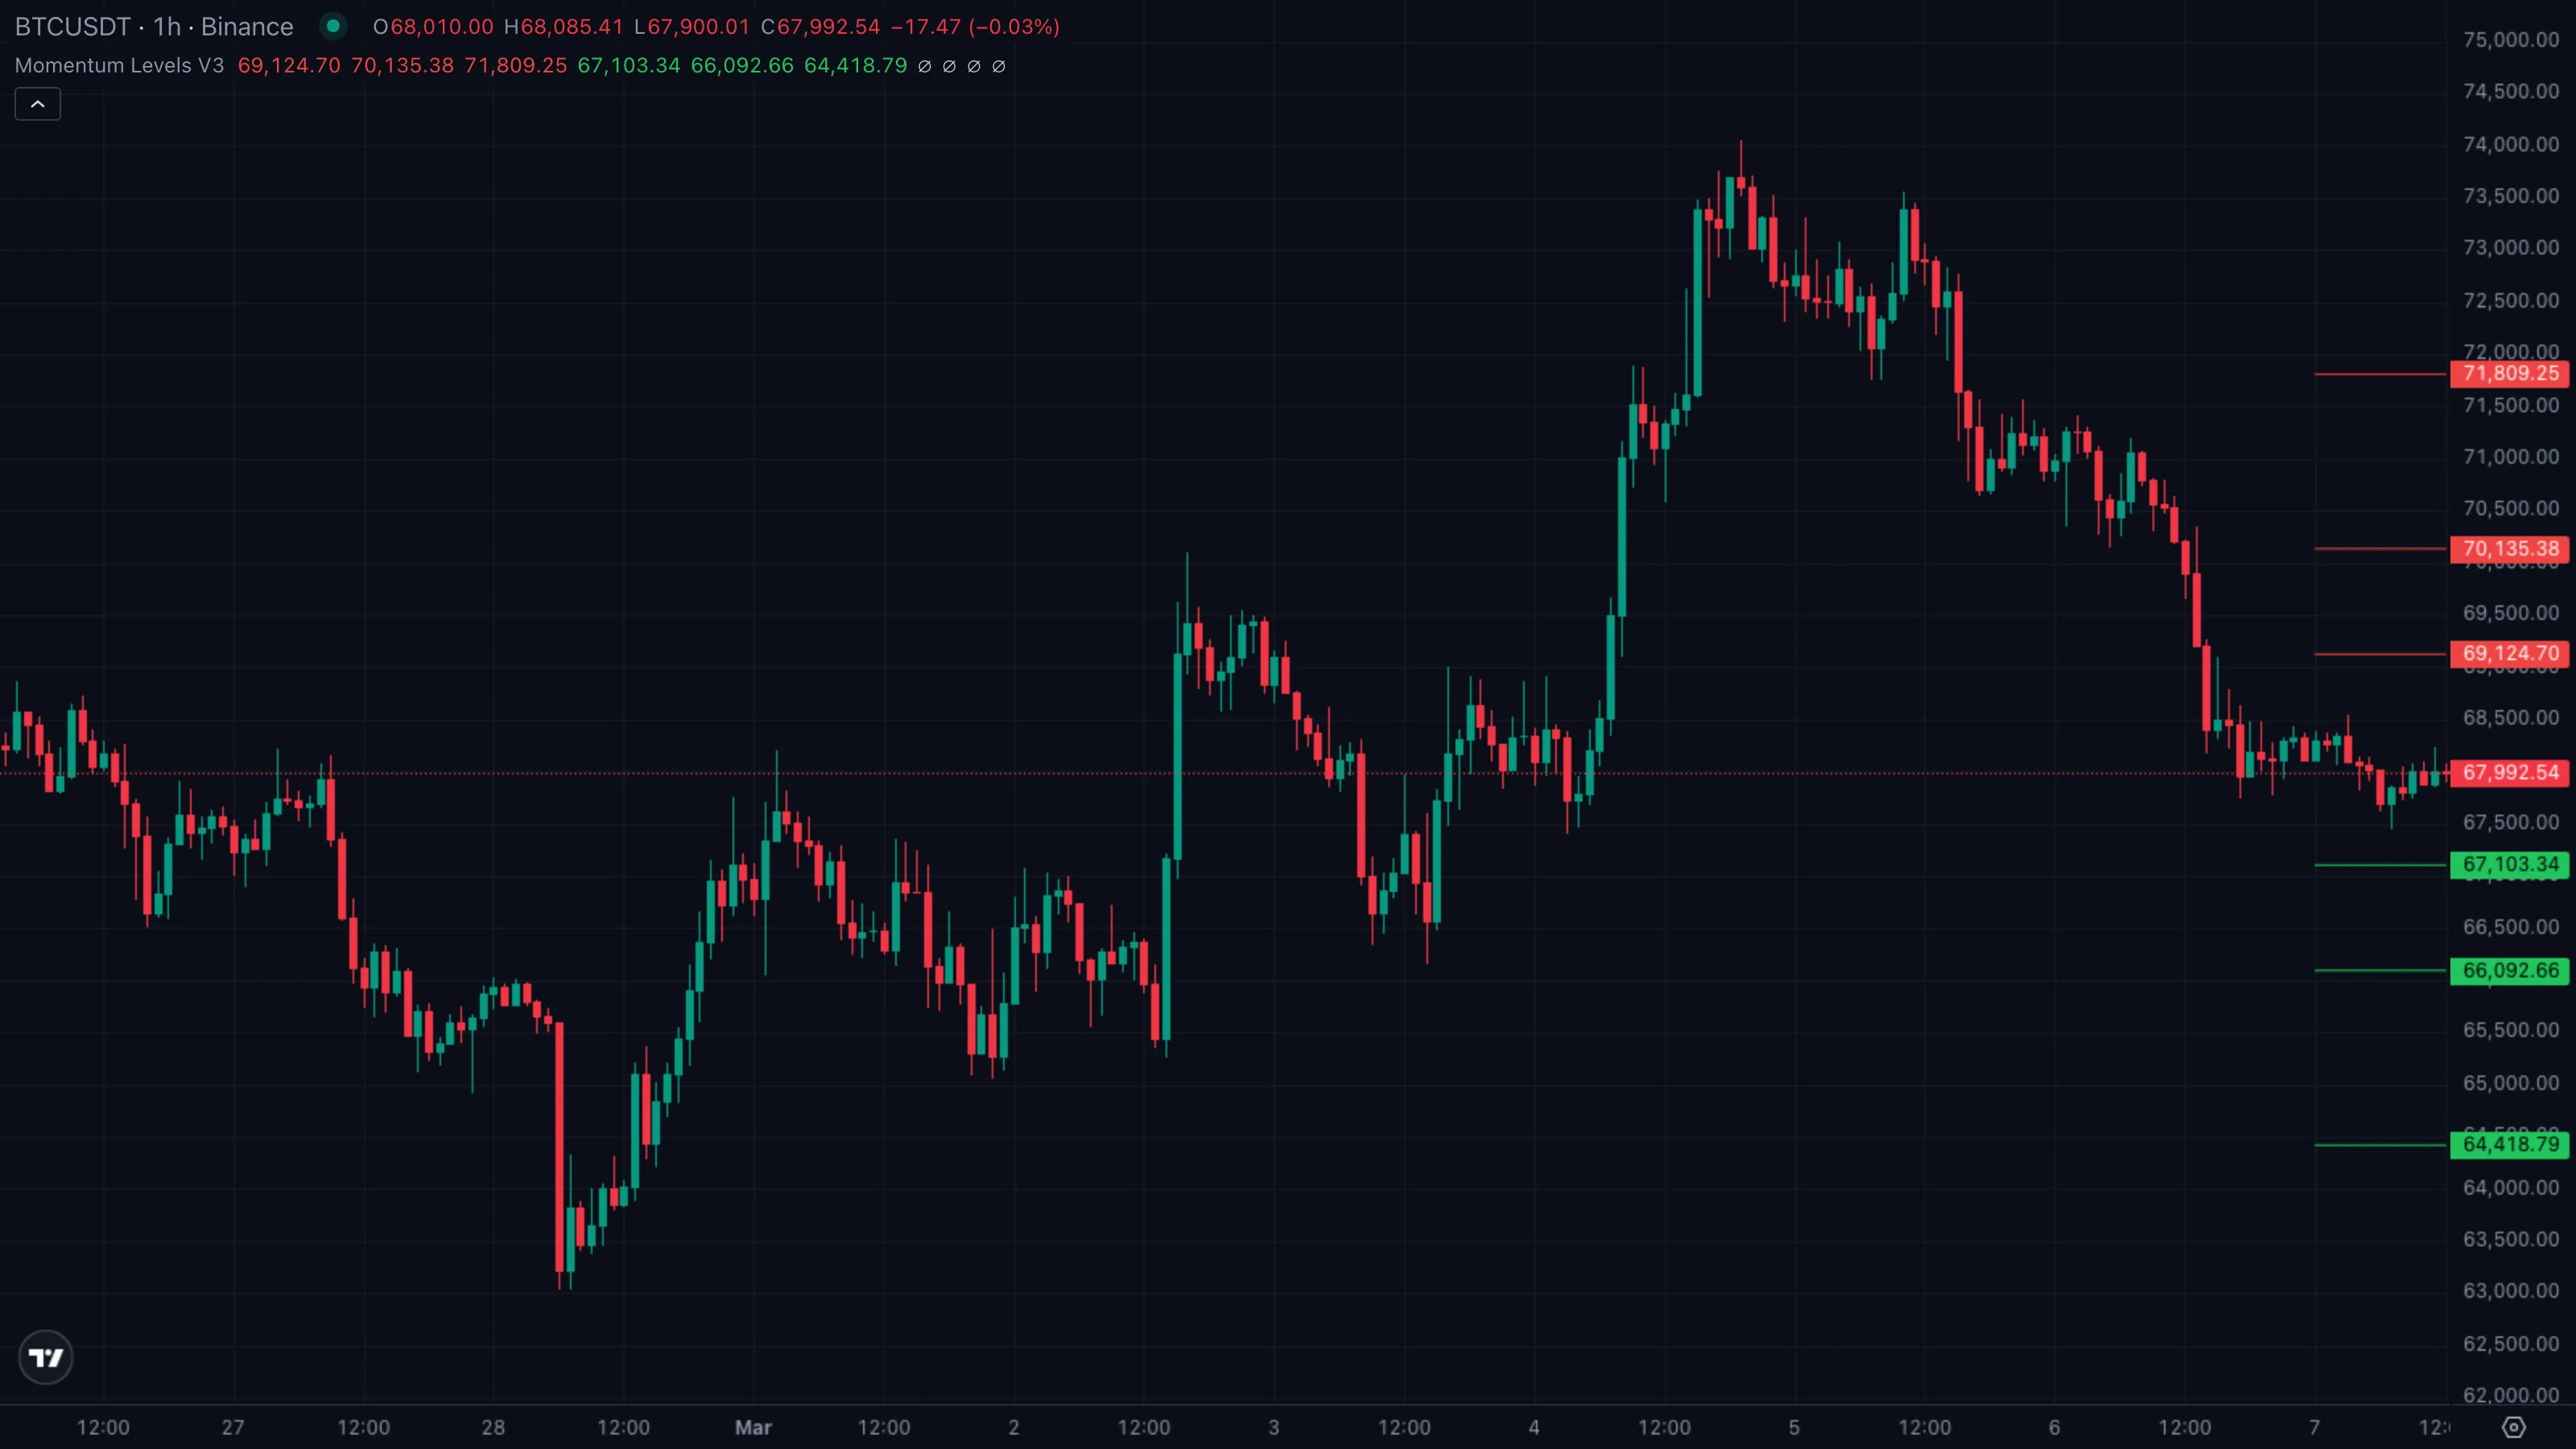
Momentum Levels V3 does all of that for you, every bar, in real time. It looks back one higher timeframe (HTF) period — the previous day on a 1H chart, the previous week on a daily chart — pulls that period's high, low and close, then projects ten horizontal price levels forward into the current period.
2. How It Works Under the Hood
Two ideas are stitched together under the hood.
- The HTF anchorAnchored VWAPA VWAP that begins at a chosen pivot bar (a swing high or swing low) and runs forward. Anchoring makes the absolute level meaningful instead of drifting with whatever bars happen to load.Click for full definition →. The indicator decides which higher timeframe to read from based on your chart. A 15-minute to 4-hour chart anchors to the previous daily bar; a daily chart anchors to the previous weekly bar; a weekly chart anchors to the previous 4-week block. From that anchorAnchored VWAPA VWAP that begins at a chosen pivot bar (a swing high or swing low) and runs forward. Anchoring makes the absolute level meaningful instead of drifting with whatever bars happen to load.Click for full definition → period it grabs three numbers — the high, the low, and the close — and uses them as the seed for the current period's grid.
- The level ladder. Ten levels fan out around the close. Six "outer" levels (H3, H4, H5 above and L3, L4, L5 below) are always on. Four "inner" levels (H1/L1 and H2/L2) are optional fine-grained references, off by default. Levels are spaced by progressively larger fractions of the prior period's range, so H3 sits closer to the close than H4, which sits closer than H5.
How each level picks its distance. Every new period, the indicator asks two simple questions.
- How wide was the last period's range? Wider range gives wider levels. A tight range stacks them closer together. The grid scales with the instrument's recent behaviour rather than fixed dollar amounts.
- How aggressive is this level meant to be? The inner levels sit just above and below the anchorAnchored VWAPA VWAP that begins at a chosen pivot bar (a swing high or swing low) and runs forward. Anchoring makes the absolute level meaningful instead of drifting with whatever bars happen to load.Click for full definition → close — small targets, frequent reactions. The outer levels sit further out — bigger targets, rarer reactions but often stronger ones when price gets there.
| What you're seeing | Level state | Plain English |
|---|---|---|
| Price holds inside the H3 / L3 envelope | 🟡 Neutral / inside day | Range-bound, no decisive break either side |
| Price pushes above H3 and grinds toward H4 / H5 | 🟢 Bullish extension | Buyers in control, upper levels become magnets |
| Price drops through L3 and stretches toward L4 / L5 | 🔴 Bearish extension | Sellers in control, lower levels become magnets |
The grid itself doesn't predict direction — it tells you where reactions are likely to happen when direction picks a side. That's why this indicator pairs naturally with a trend gauge like Momentum Wave: the trend tells you the bias, the levels tell you the prices.
3. What You See on the Chart
| Element | Looks like | Means |
|---|---|---|
| H3 / H4 / H5 | Red horizontal lines above price with red callout tags on the right | Resistance ladder for the current period — H3 closest, H5 the stretch target |
| L3 / L4 / L5 | Lime horizontal lines below price with lime callout tags on the right | Support ladder for the current period — L3 closest, L5 the stretch target |
| H1 / L1 (optional) | Inner red / lime lines very close to the anchorAnchored VWAPA VWAP that begins at a chosen pivot bar (a swing high or swing low) and runs forward. Anchoring makes the absolute level meaningful instead of drifting with whatever bars happen to load.Click for full definition → close, off by default | Fine-grained reference for tight ranges — toggle on for inside-day setups |
| H2 / L2 (optional) | Inner red / lime lines slightly further from close, off by default | Mid-distance references between the inner and outer rungs |
| Right-edge callouts | Coloured bubbles labelled "H3=", "L4=" with the exact price | The callout block sits 20 bars to the right of the latest bar so it doesn't obscure live candles |
Default colour scheme. Red for every level above the anchorAnchored VWAPA VWAP that begins at a chosen pivot bar (a swing high or swing low) and runs forward. Anchoring makes the absolute level meaningful instead of drifting with whatever bars happen to load.Click for full definition → close (resistance), lime green for every level below (support). The grid is locked to the previous HTF period's H/L/C, so the level prices stay still through the entire current period — as soon as a new HTF bar opens, the ladder jumps to the new prices and stale labels are cleared.
4. Reading It in 3 Patterns
Pattern A — Inside-day hold between L3 and H3
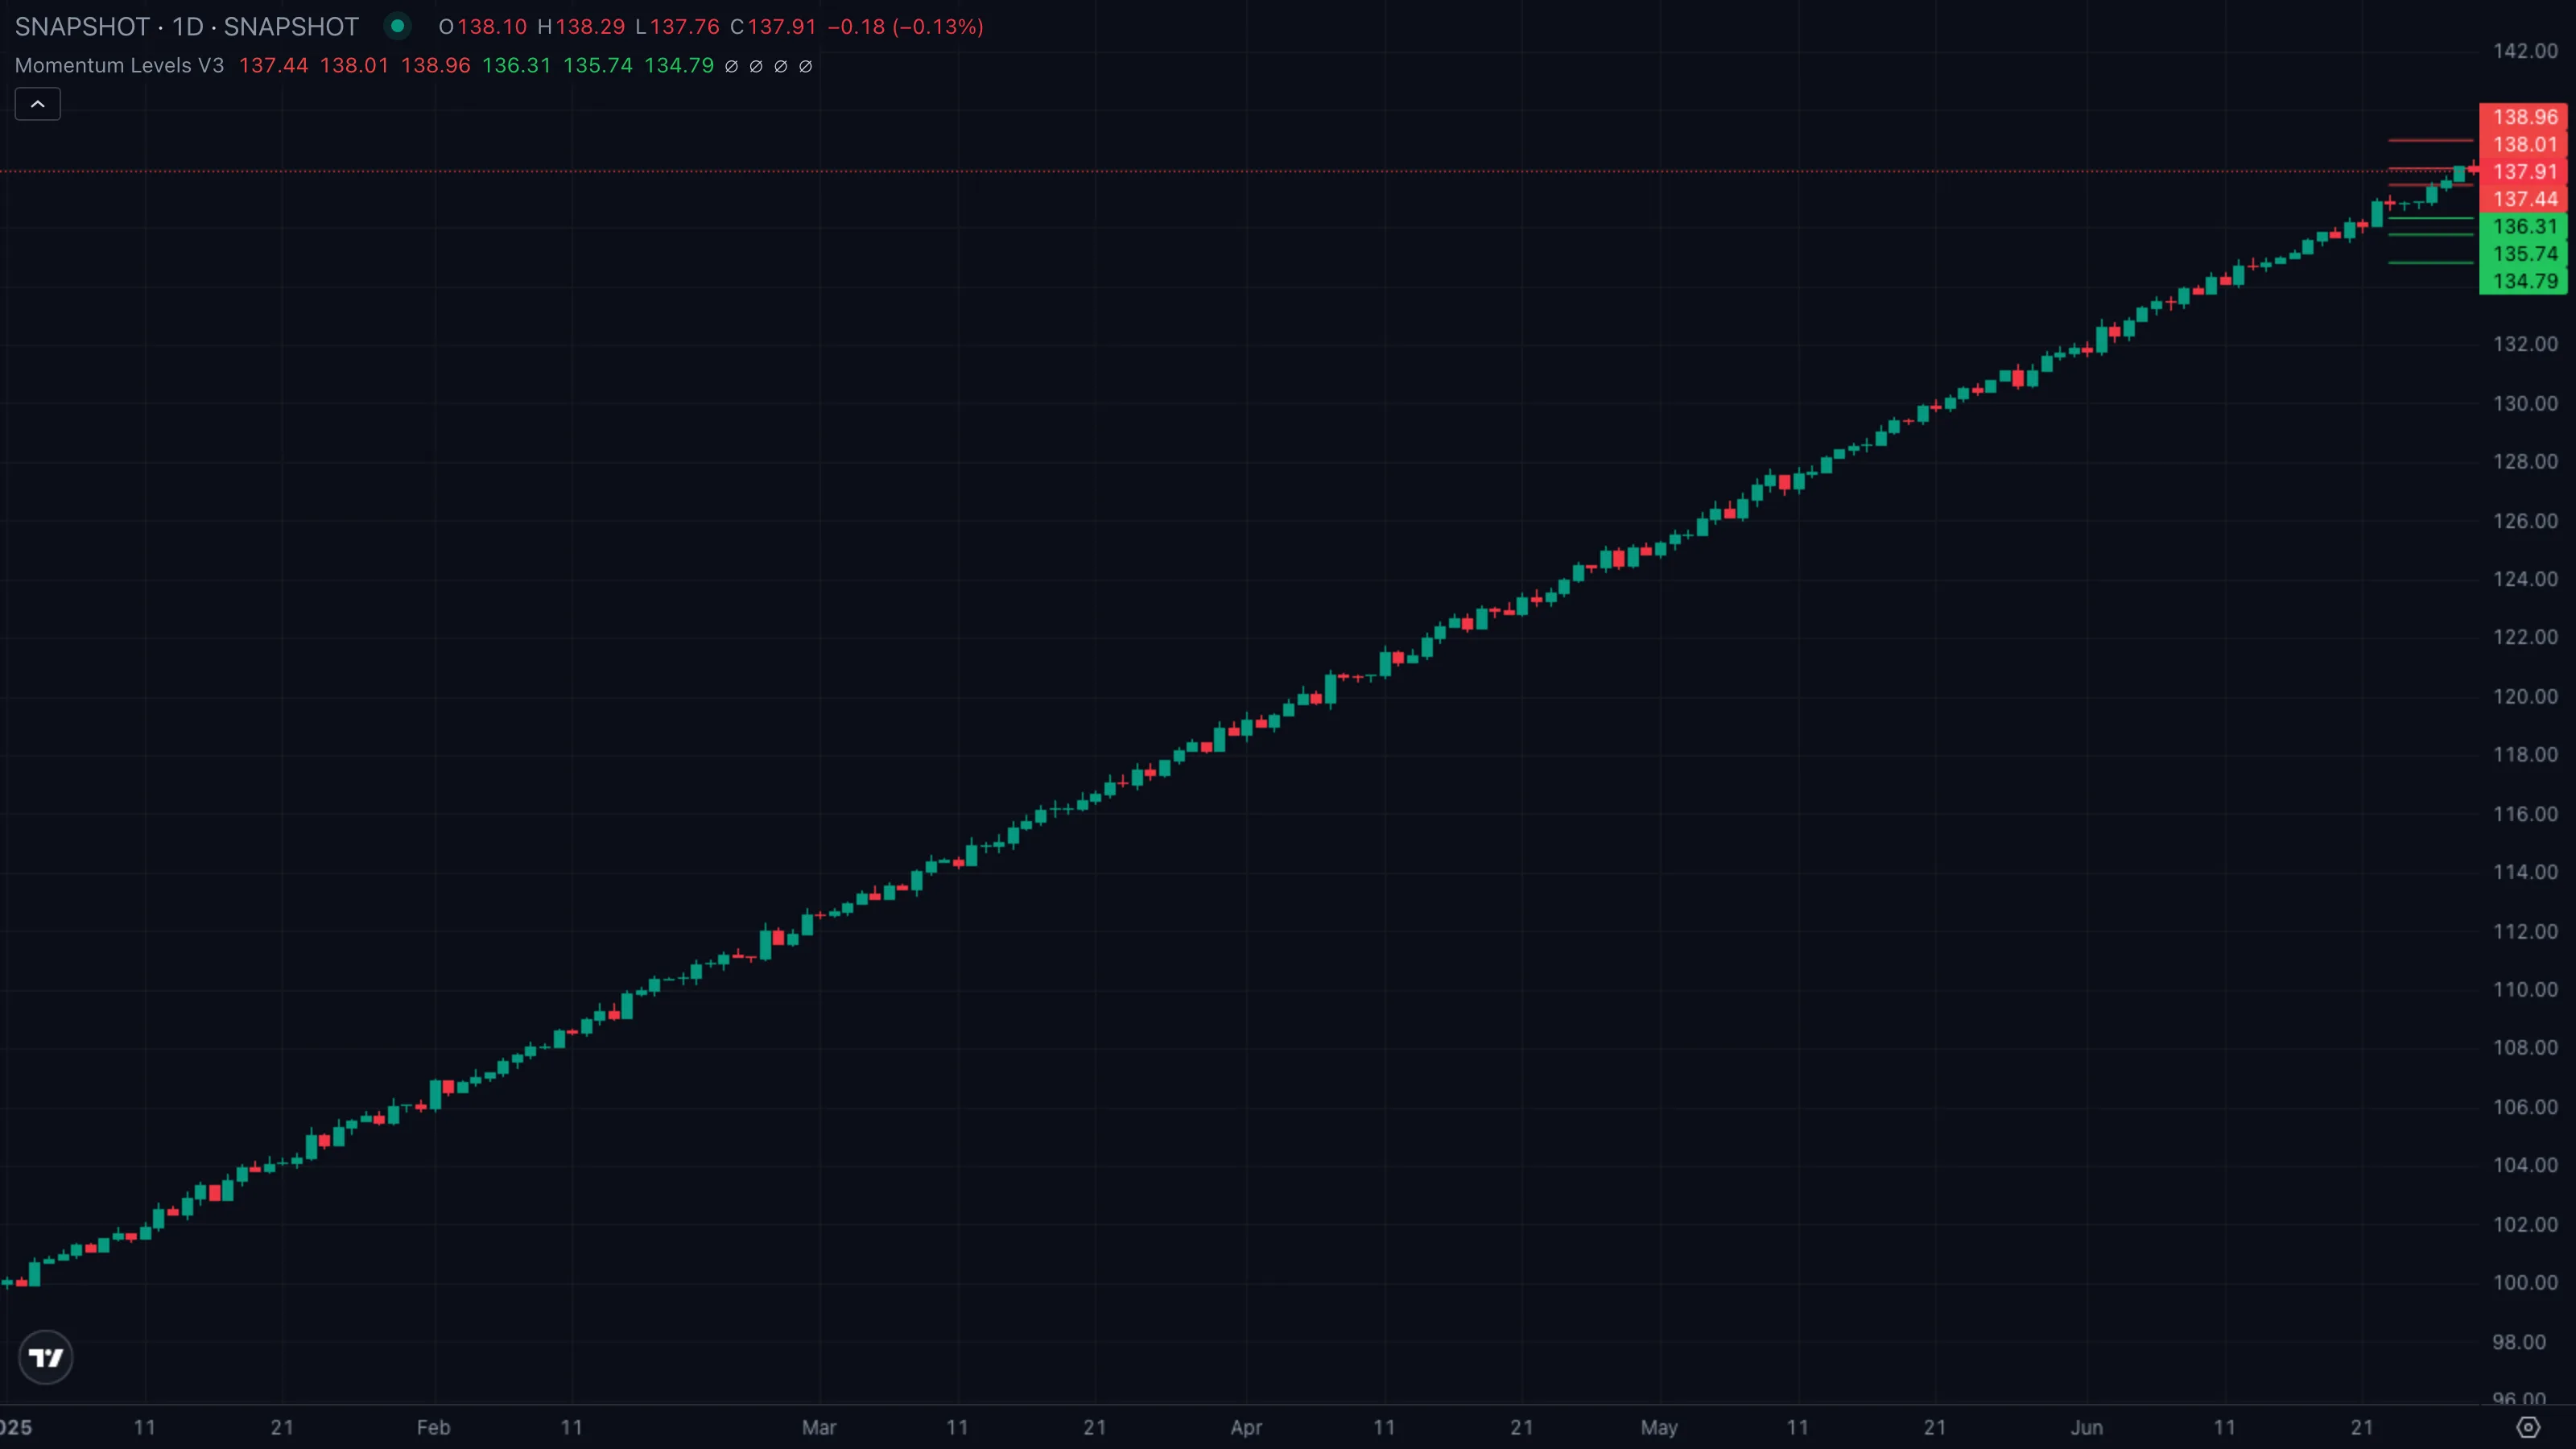
| What you see | ① Price oscillates between L3 and H3 ② candles tag L3 and bounce, tag H3 and fade ③ no close prints outside the inner ladder. |
| What it means | The market is digesting the prior period's range. Without a clean break of L3 or H3, neither side has taken control — a textbook mean reversionMean ReversionThe expectation that price, after stretching far from a baseline (a moving average, prior range), will snap back toward it. Works best in chop and range-bound markets.Click for full definition → regime. |
| What to do | Trade the levels, not the trend. Buy reactions off L3 with a stop under L4; sell reactions off H3 with a stop over H4. Avoid trend-followingTrend FollowingThe opposite of mean reversion — staying with a directional move once it's established, exiting only when the trend itself breaks. Works best in trending markets.Click for full definition → entries until one side breaks. |
Pattern B — Clean break of H3, run toward H4 / H5
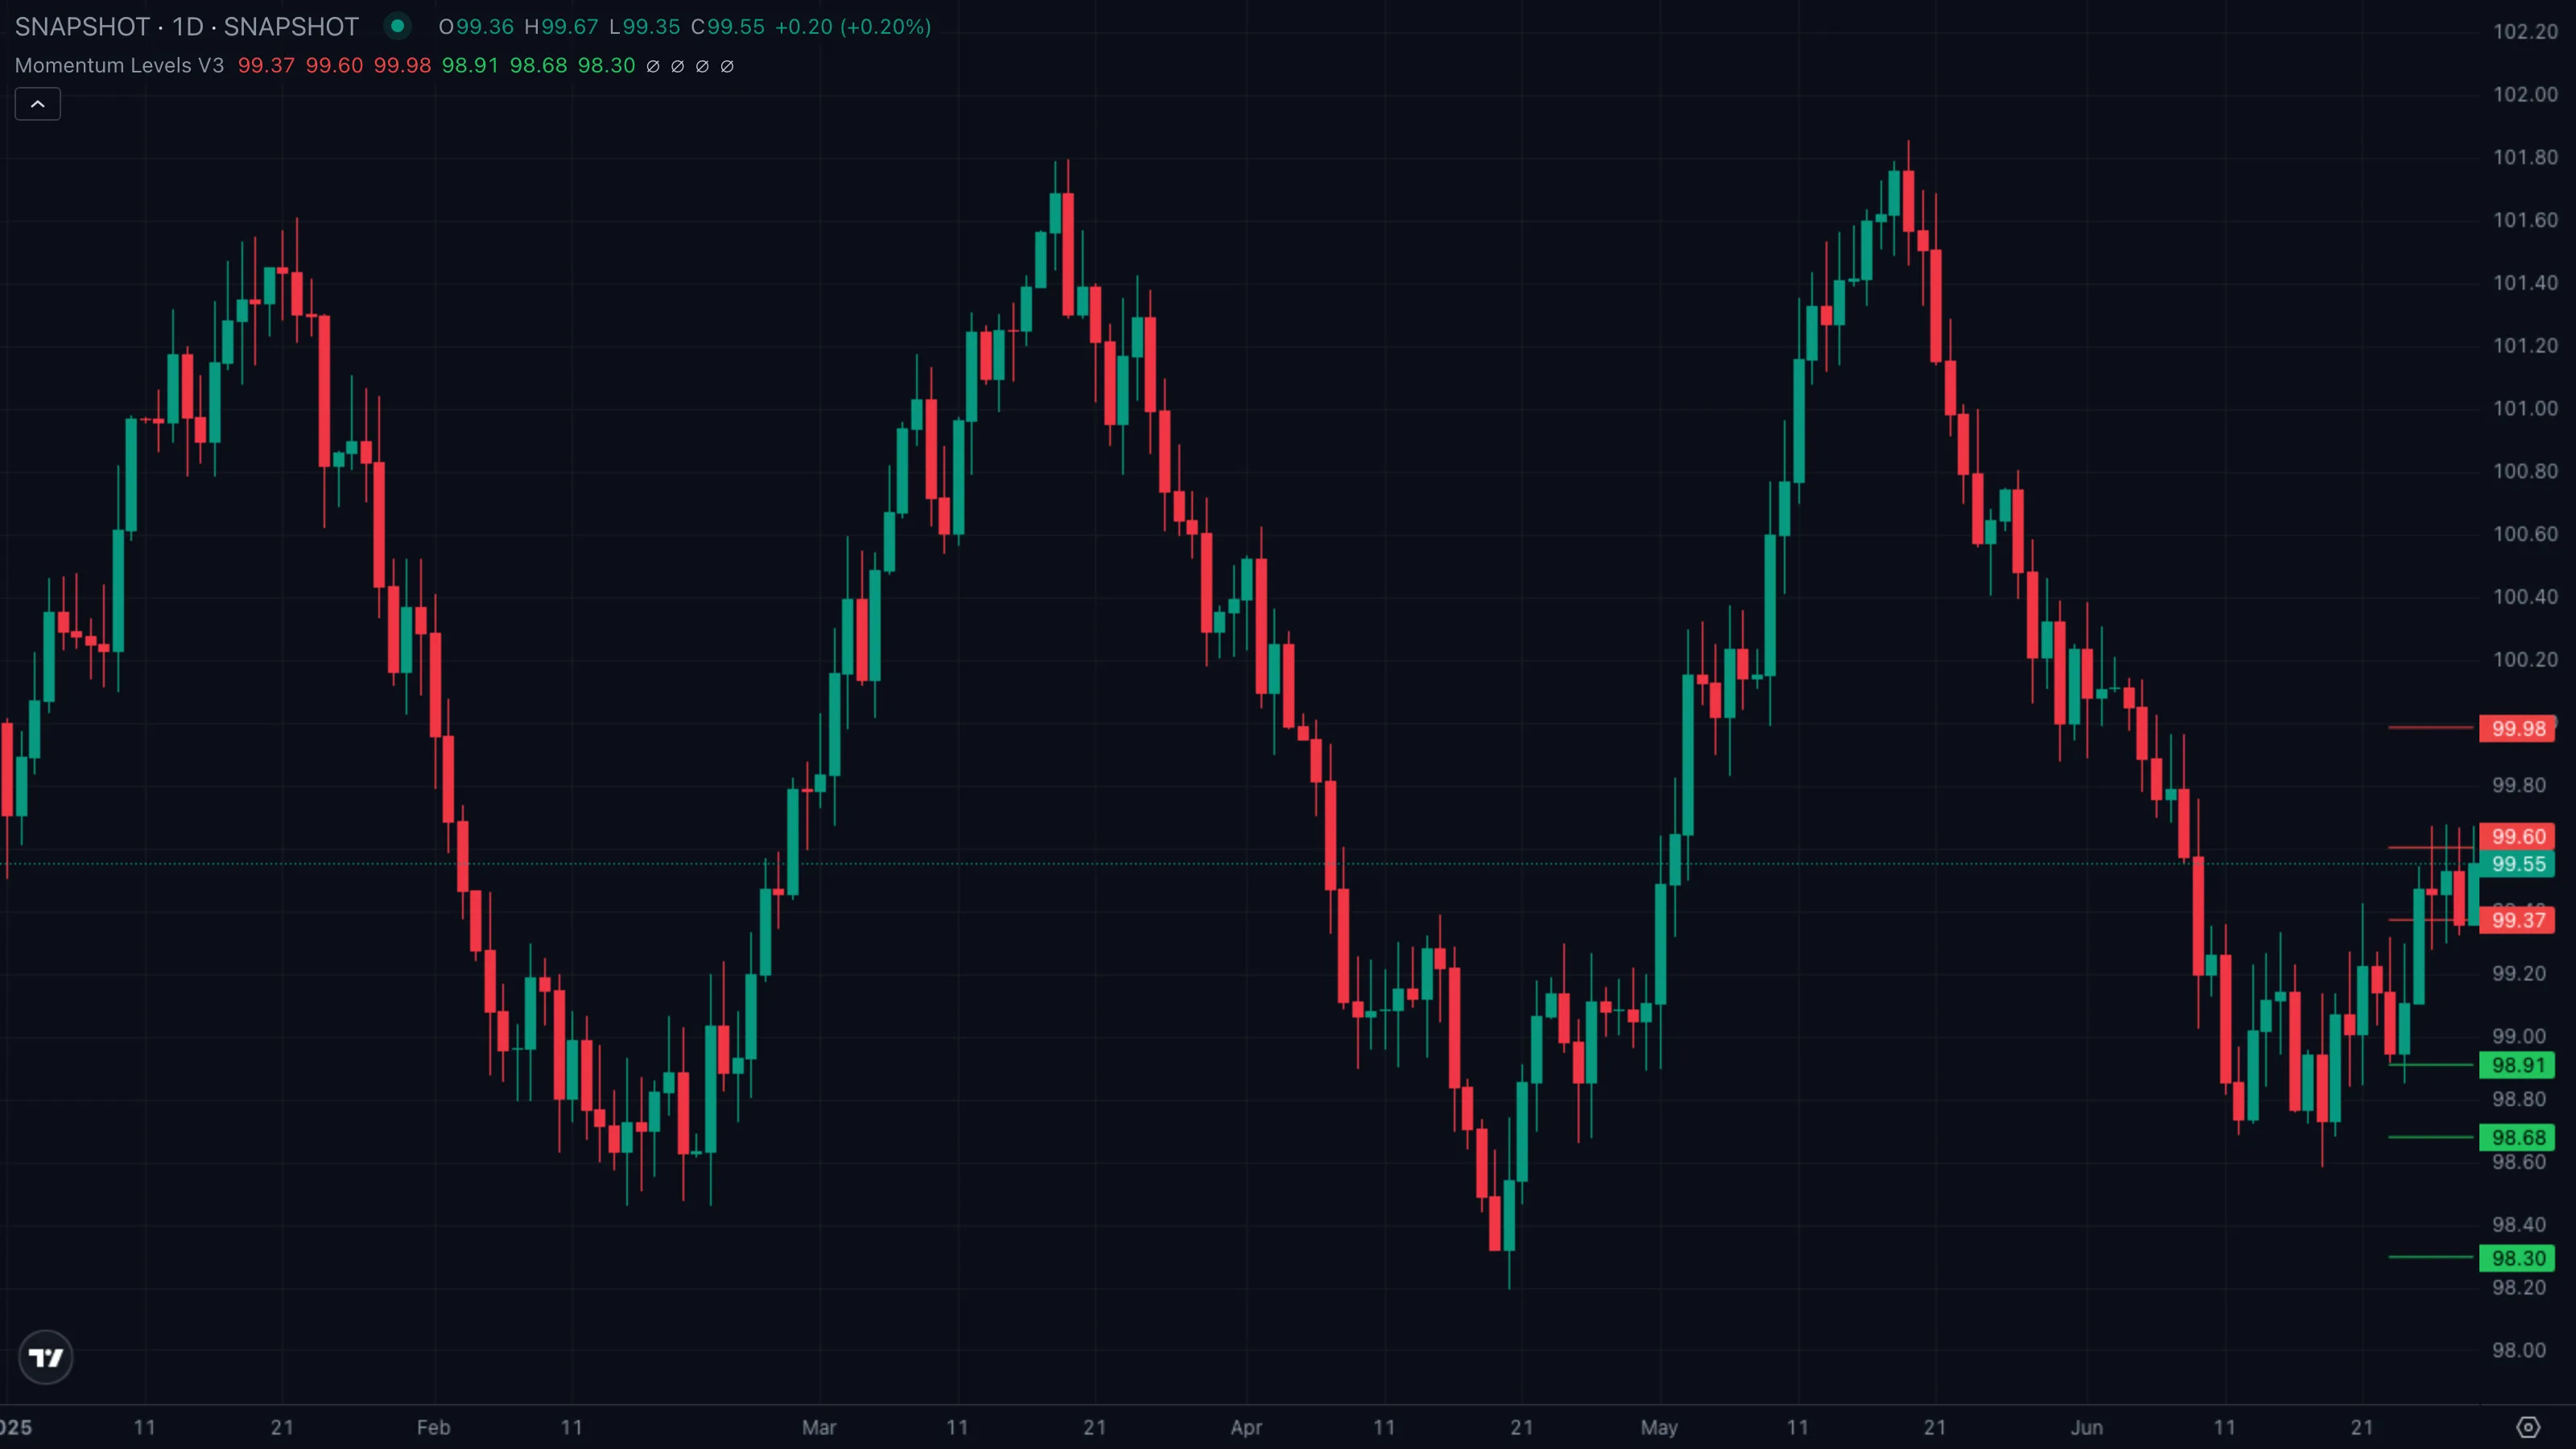
| What you see | ① Price closes decisively above H3 ② the next bars accept the breakout and grind sideways above H3 ③ momentum carries price up toward H4 with H5 visible overhead. |
| What it means | Buyers have committed. The H3 line that capped the prior session flips from resistance to support — the cleanest trend followingTrend FollowingThe opposite of mean reversion — staying with a directional move once it's established, exiting only when the trend itself breaks. Works best in trending markets.Click for full definition → continuation cue the ladder produces. H4 becomes the first target, H5 the stretch target. |
| What to do | Bias long. Lowest-risk entry is a pullbackPullback (Retracement)A short, counter-trend move within an established trend — buyers (or sellers) momentarily losing ground before the trend resumes. Often the lowest-risk place to enter the trend.Click for full definition → to H3 after the break, with H3 as new floor and stop just below. Take partials at H4, trail the rest toward H5. Don't chase the breakout bar; wait for the retest. |
Pattern C — L4 reversal: stretched move snaps back to the middle
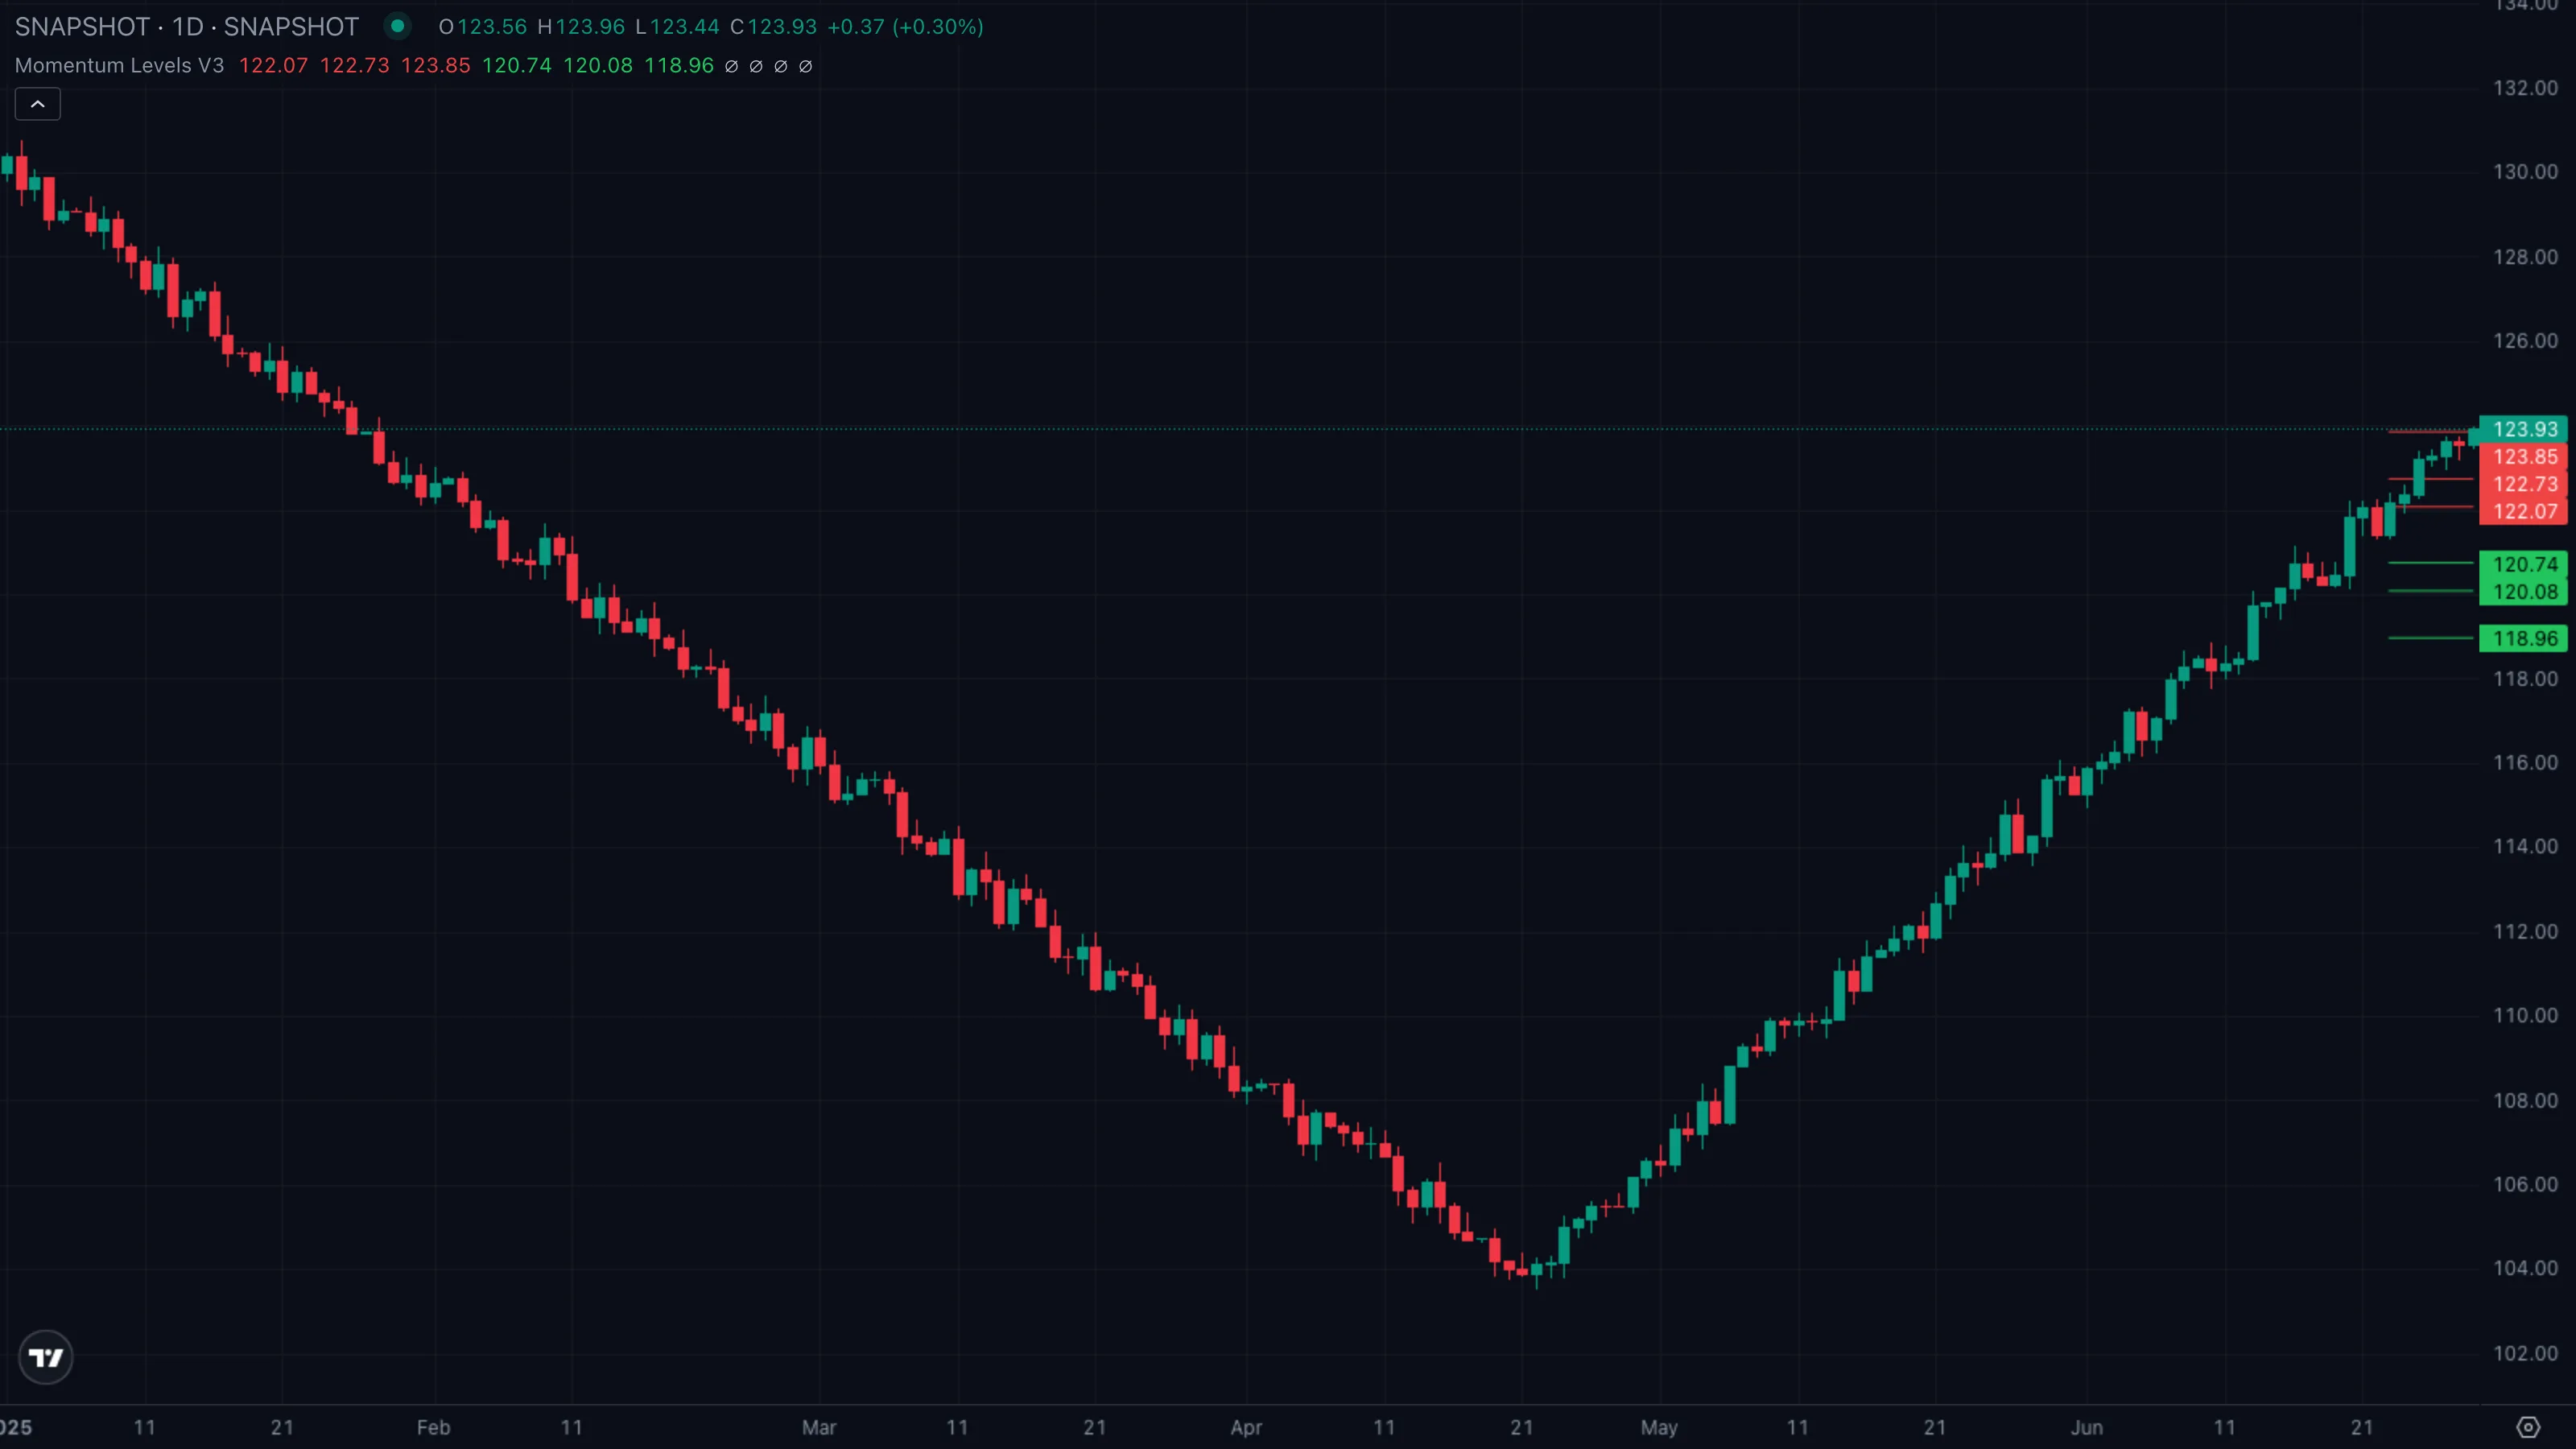
| What you see | ① Price slices through L3 in a single impulsive bar ② the move stretches to L4 and prints a long lower wick ③ L3 is reclaimed from below within a couple of bars. |
| What it means | The L3 break was real but exhausted at the next rung. A stretch to L4 followed by an immediate L3 reclaim is one of the strongest reversal signatures the ladder produces — trapped sellers above L3 become fresh fuel for the bounce. |
| What to do | Wait for the L3 reclaim; don't catch the falling knife at L4. Once L3 prints back as support on a closing basis, long with a stop just below the L4 wick low. Target the prior anchorAnchored VWAPA VWAP that begins at a chosen pivot bar (a swing high or swing low) and runs forward. Anchoring makes the absolute level meaningful instead of drifting with whatever bars happen to load.Click for full definition → close, with H3 as the stretch target. |
5. Trade Walkthrough
| Symbol | ETHUSDT |
|---|---|
| Timeframe | 4H |
| Venue | Binance |
| Window | 10 Mar to 22 Mar 2026 |
| Pattern | B — clean break of H3, run toward H4 / H5 |
A clean weekly-anchorAnchored VWAPA VWAP that begins at a chosen pivot bar (a swing high or swing low) and runs forward. Anchoring makes the absolute level meaningful instead of drifting with whatever bars happen to load.Click for full definition → setup. ETH spent the prior week between 3,180 and 3,520 with the close landing at 3,400 — that anchorAnchored VWAPA VWAP that begins at a chosen pivot bar (a swing high or swing low) and runs forward. Anchoring makes the absolute level meaningful instead of drifting with whatever bars happen to load.Click for full definition → week generated an H3 around 3,495, an H4 near 3,587 and an H5 near 3,632. Below close, L3 sat near 3,305, L4 near 3,213. The new week opened, chopped beneath H3 for two days, then committed.
The sequence
| # | When | ETH price | Level state | What it tells you |
|---|---|---|---|---|
| ① | 10 Mar to 12 Mar | 3,330 to 3,470 | inside L3–H3 envelope | Pattern A regime. Ladder is locked, neither side breaking. Fade the edges, don't chase. |
| ② | 13 Mar | ~3,510 close | H3 breaks and holds | Pattern B trigger. First decisive close above H3, which now flips from resistance to support. |
| ③ | 14 Mar | ~3,498 low | retest of H3 from above | First pullbackPullback (Retracement)A short, counter-trend move within an established trend — buyers (or sellers) momentarily losing ground before the trend resumes. Often the lowest-risk place to enter the trend.Click for full definition → into the freshly broken level, ladder holds. The real entry. |
| ④ | 17 Mar | ~3,580 high | tagging H4 | Move reaches the first natural target. Cue to take partials and trail the rest toward H5. |
The trade in one card
| What you skipped | Market-buying the breakout bar at 3,510. No clear stop, awful risk/reward, and the very next bar pulled back into H3 anyway. |
| What you took | PullbackPullback (Retracement)A short, counter-trend move within an established trend — buyers (or sellers) momentarily losing ground before the trend resumes. Often the lowest-risk place to enter the trend.Click for full definition → into H3 at ~3,498 on 14 March, with the broken level holding as new support. |
| Where you exited | Partial profit at H4 around 3,580; trail the rest, stopped out as price stalled below H5 near 3,615. |
| Move captured | ~ +3.4 % in roughly three days, low-stress hold the whole way up. |
Lesson
The H3 break gives you the alert. The first retest of H3 from above gives you the trade. The tag of H4 tells you to take partials and let the runner work toward H5.
6. Common Pitfalls
- Trading the level on the breakout bar. Wide range, no defined stop, often retraces immediately. The signal is the break; the trade is the retest. Wait for it.
- Treating levels as walls instead of zones. A wick a few ticks beyond L3 that closes back inside is still a hold. Only closing prints beyond a level count as commitment.
- Forgetting which HTF is feeding the grid. On a 1H chart the levels come from the previous daily bar; on a daily chart, the previous weekly bar. If your levels suddenly shift mid-session, a new HTF bar just opened — that's not a bug.
- Using the inner H1 / L1 toggles on volatile instruments. The inner levels work nicely on quiet ranges, but on a wide prior-period range they bunch right next to the anchorAnchored VWAPA VWAP that begins at a chosen pivot bar (a swing high or swing low) and runs forward. Anchoring makes the absolute level meaningful instead of drifting with whatever bars happen to load.Click for full definition → close and add noise rather than signal. Leave them off (default) until the grid stretches wide.
- Mixing patterns. A break-and-retest of H3 (Pattern B) doesn't become a Pattern C reversal just because the next bar pulls back. Pattern C requires the full stretch to L4 and a clean L3 reclaim — partial pullbacksPullback (Retracement)A short, counter-trend move within an established trend — buyers (or sellers) momentarily losing ground before the trend resumes. Often the lowest-risk place to enter the trend.Click for full definition → inside an active trend are continuations, not reversals.