

Momentum Radar
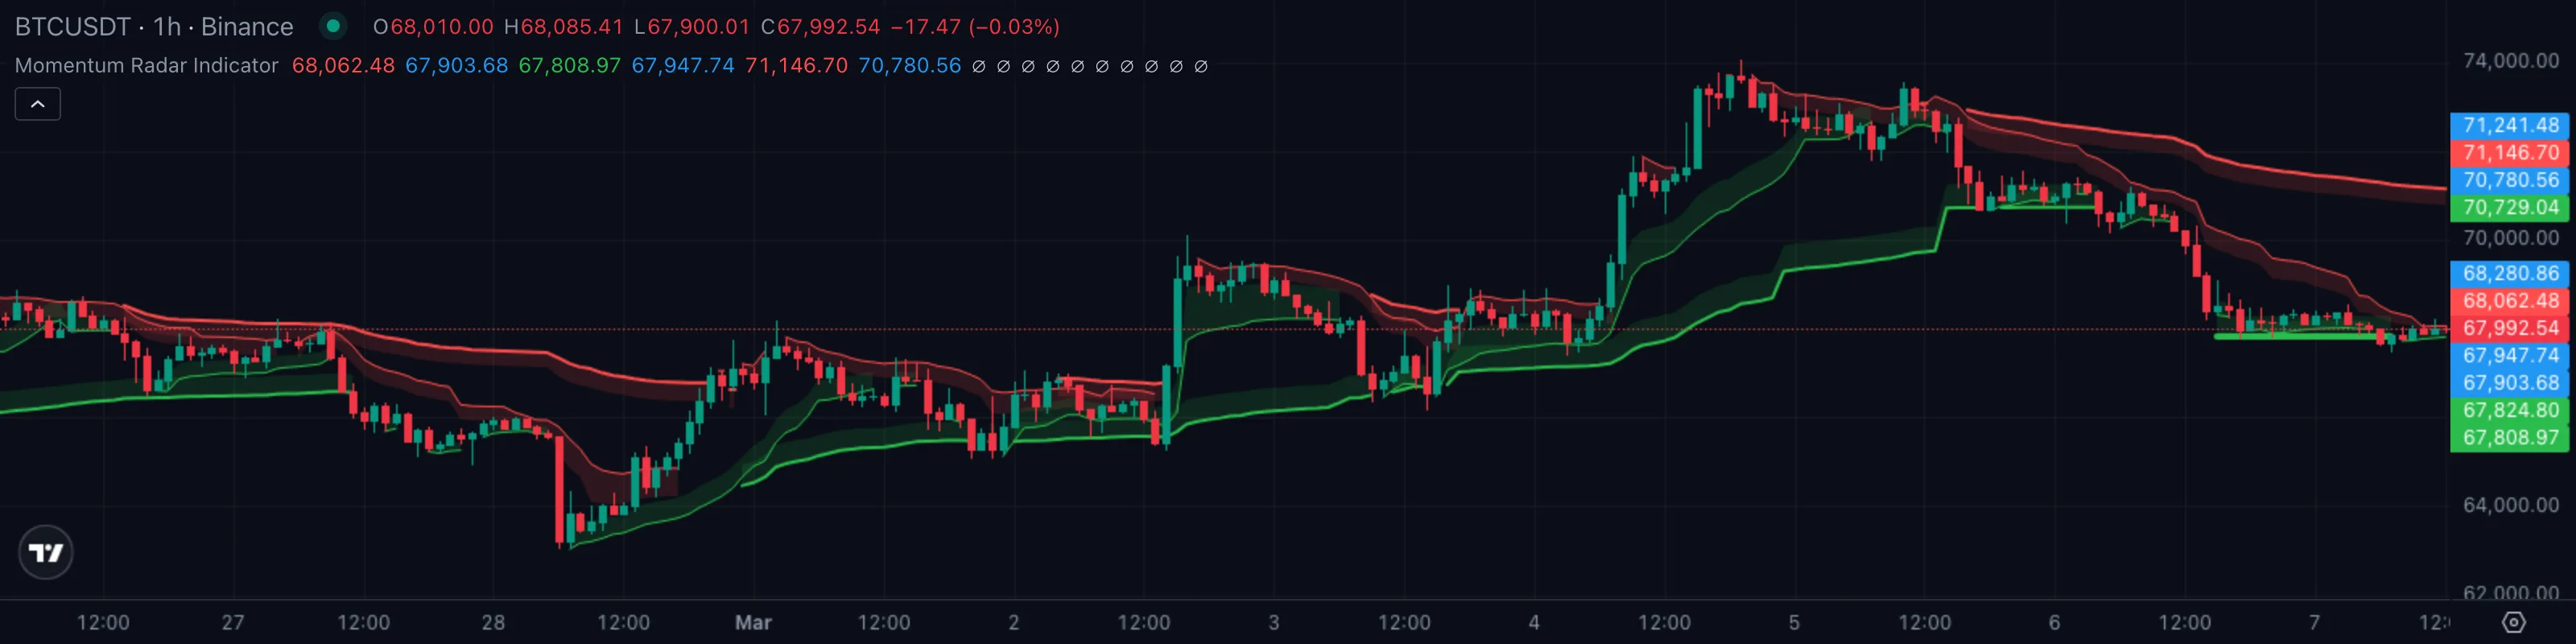
Four nested support-and-resistance envelopes, each anchoredAnchored VWAPA VWAP that begins at a chosen pivot bar (a swing high or swing low) and runs forward. Anchoring makes the absolute level meaningful instead of drifting with whatever bars happen to load.Click for full definition → from a different swing pivotPivot High / Pivot LowA bar that is higher (or lower) than a defined number of bars on both sides. Confirmed only after the right-hand bars print without breaking it.Click for full definition →, that show fast, medium, slow, and very-slow momentum on a single chart.
1. What This Indicator Watches For
Most charts make you pick one timeframe and live with it. A 1H chart shows you the last few days' wiggles but hides the pivotPivot High / Pivot LowA bar that is higher (or lower) than a defined number of bars on both sides. Confirmed only after the right-hand bars print without breaking it.Click for full definition → from three weeks ago. Flip up to the daily and you finally see the swing lowSwing High and Swing LowThe most recent confirmed pivot in either direction. Swing highs cap rallies until broken; swing lows support pullbacks until broken.Click for full definition → that matters — but you've lost the fine-grained read on what's happening right now.
Professional traders solve this by jumping between timeframes. They check the daily for the macro level, the 4H for the swing structureMarket StructureThe pattern of swing highs and lows price prints as it moves. Healthy uptrends print higher highs and higher lows; healthy downtrends print the mirror.Click for full definition →, the 1H for the entry zone. That works, but it's slow.
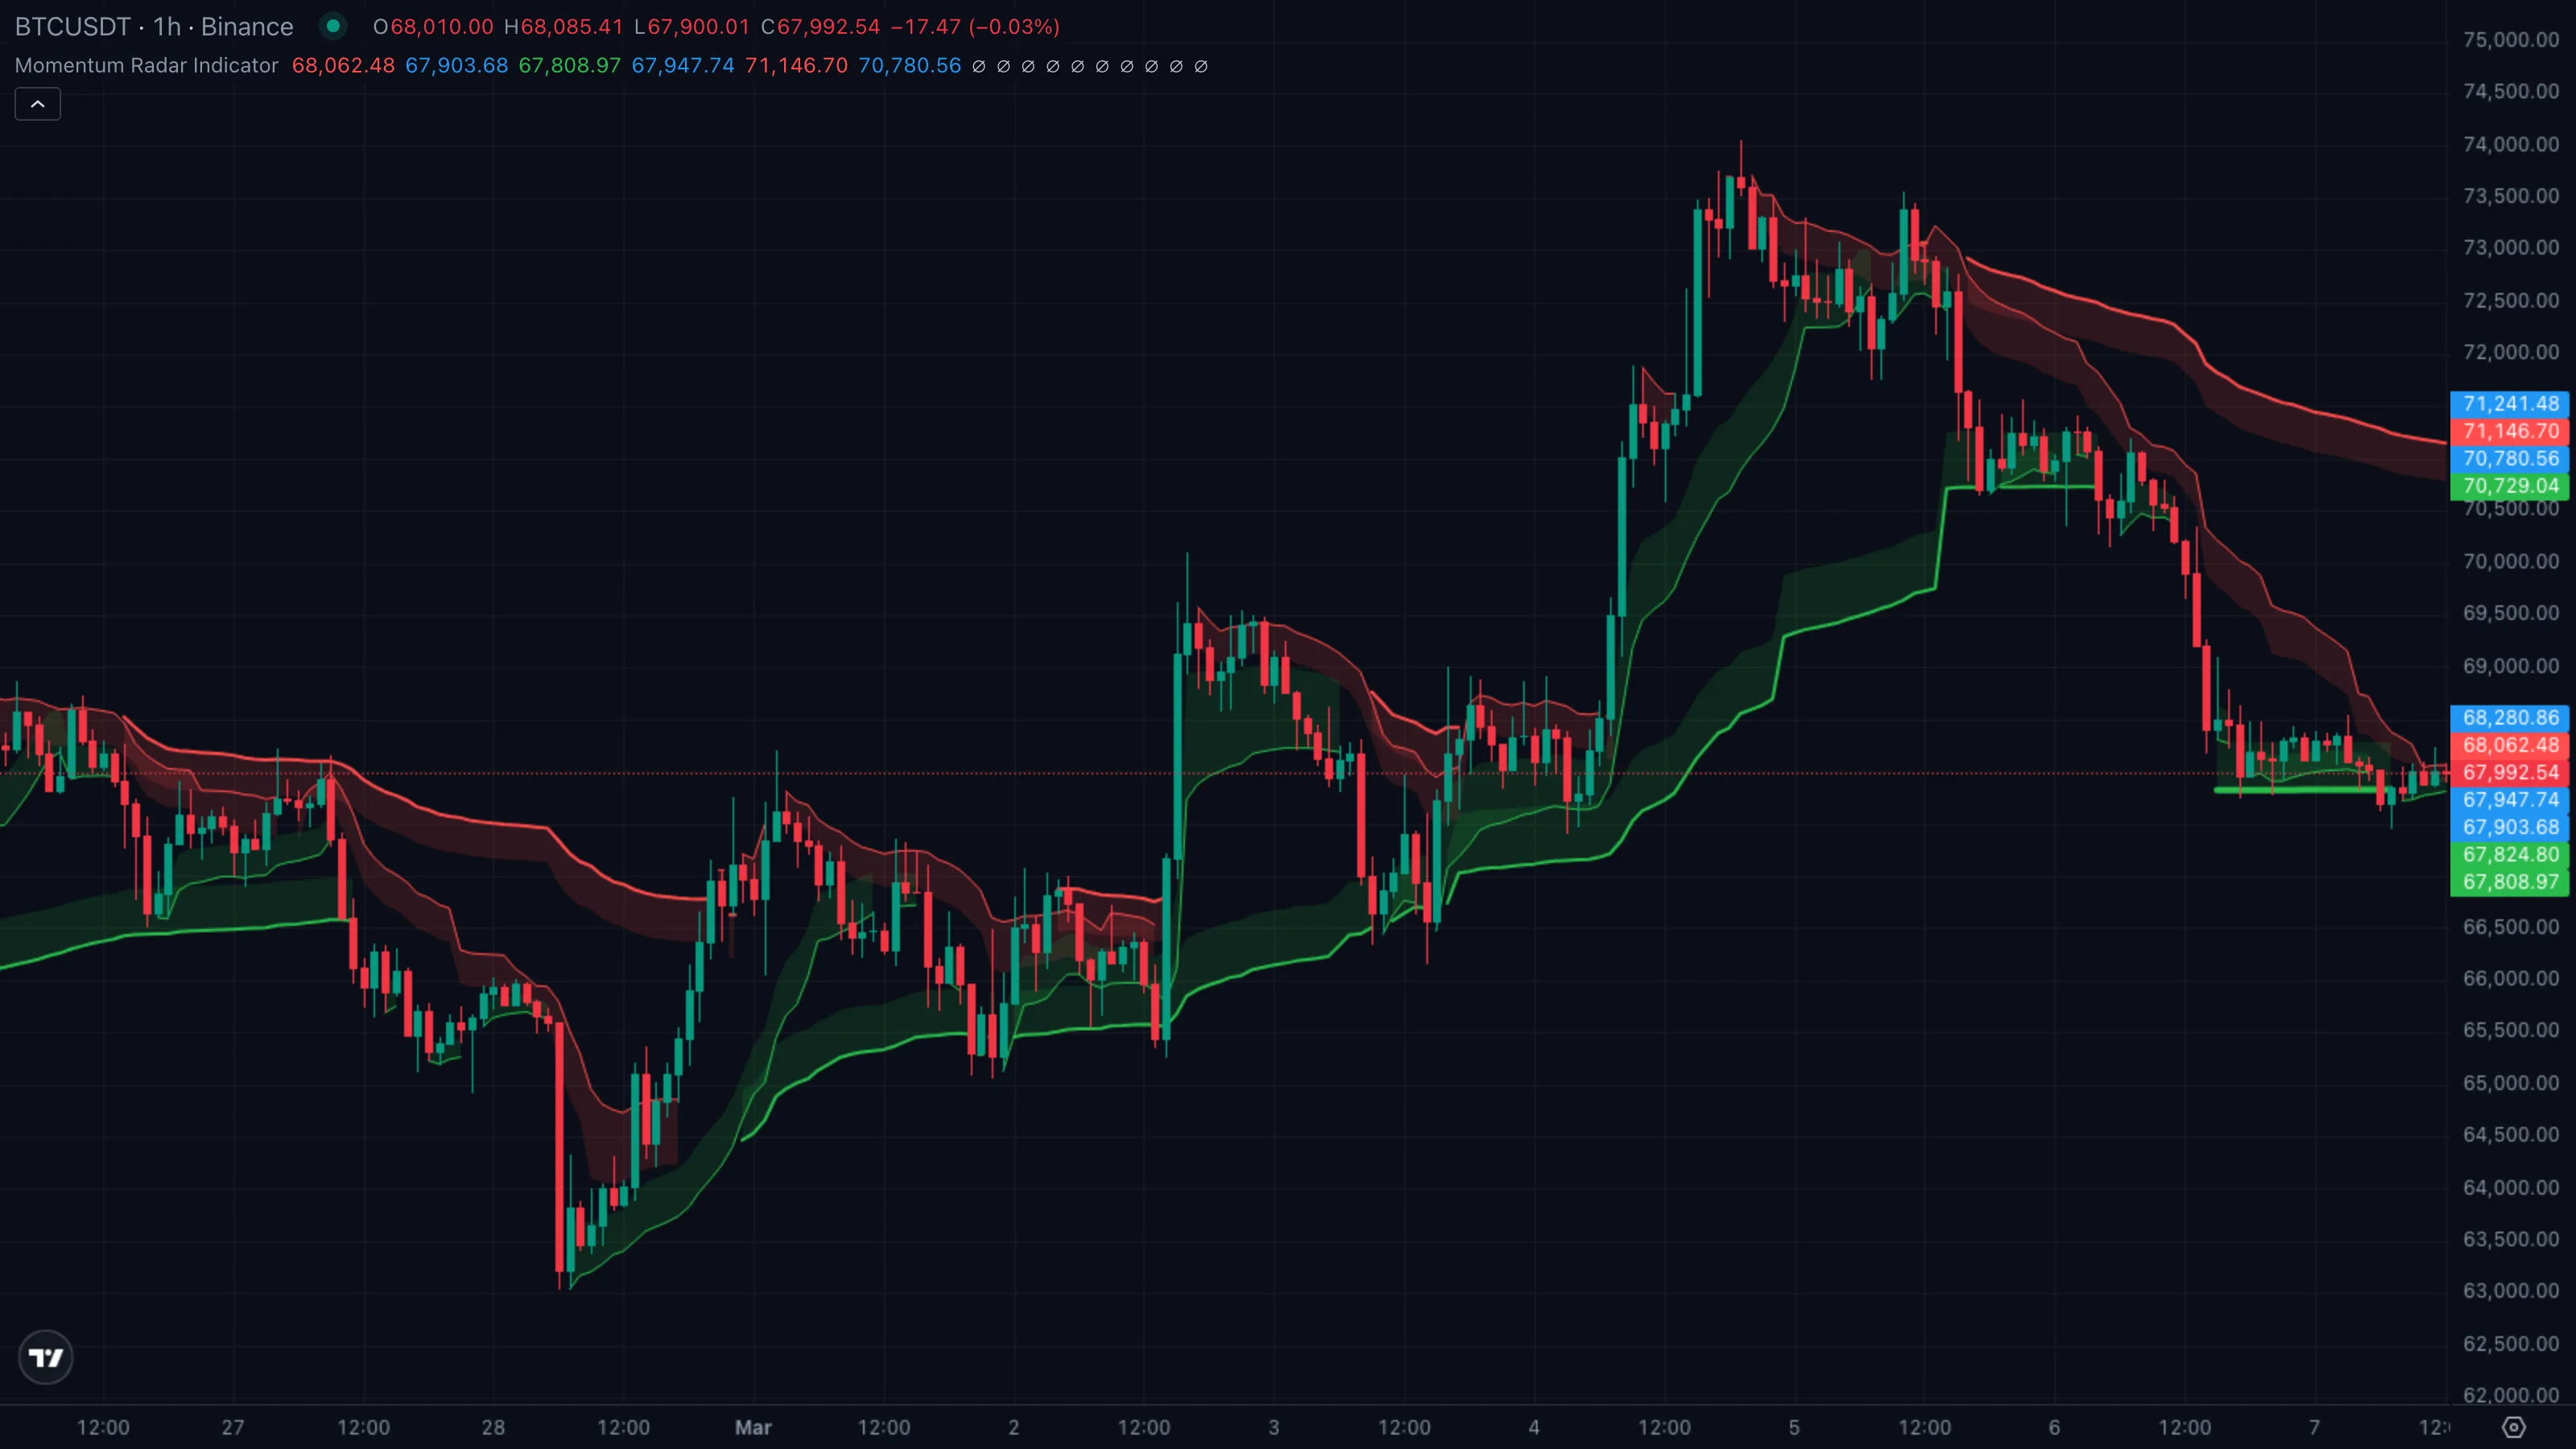
Momentum Radar collapses that whole workflow onto one chart. It draws four support-and-resistance bands at the same time, each anchoredAnchored VWAPA VWAP that begins at a chosen pivot bar (a swing high or swing low) and runs forward. Anchoring makes the absolute level meaningful instead of drifting with whatever bars happen to load.Click for full definition → to a different lookback — roughly the last 17, 72, 305, and 1292 bars. The result is a literal radar: short-pulse rings up close, a wide outer ring marking the dominant pivotPivot High / Pivot LowA bar that is higher (or lower) than a defined number of bars on both sides. Confirmed only after the right-hand bars print without breaking it.Click for full definition → of the chart's history. One glance tells you whether short-term and long-term momentum agree, or whether they're pulling in opposite directions.
2. How It Works Under the Hood
Three engines run in parallel:
- AnchoredAnchored VWAPA VWAP that begins at a chosen pivot bar (a swing high or swing low) and runs forward. Anchoring makes the absolute level meaningful instead of drifting with whatever bars happen to load.Click for full definition → VWAPs. For each of the four lookbacks, the indicator finds the highest bar in that window and starts a volume-weighted average priceVolume-Weighted Average PriceAn average where each bar's contribution is scaled by its volume, so heavy-volume bars pull the line harder than thin ones. Used as a slow centre of gravity.Click for full definition → from that pivotPivot High / Pivot LowA bar that is higher (or lower) than a defined number of bars on both sides. Confirmed only after the right-hand bars print without breaking it.Click for full definition → forward. It does the same with the lowest bar. The two lines bracket price like a ceiling and a floor, both weighted by volume so heavy-trade bars matter more than thin ones.
- Four nested levels. The four lookbacks (17, 72, 305, 1292 bars) deliberately scale up by roughly 4x each time. On a 1H chart that maps to: today's pulse, this week's swing, this month's structureMarket StructureThe pattern of swing highs and lows price prints as it moves. Healthy uptrends print higher highs and higher lows; healthy downtrends print the mirror.Click for full definition →, this quarter's regime. Inner levels react fast and noisy; outer levels move slowly and represent the meaningful pivotsPivot High / Pivot LowA bar that is higher (or lower) than a defined number of bars on both sides. Confirmed only after the right-hand bars print without breaking it.Click for full definition →.
- Auto-hide gating. When an outer (slower) envelope sits inside an inner (faster) one, it's redundant — the inner level already covers that ground. The indicator hides the outer ring on those bars so the chart stays clean. Only the most-recently-violated pivotPivot High / Pivot LowA bar that is higher (or lower) than a defined number of bars on both sides. Confirmed only after the right-hand bars print without breaking it.Click for full definition → on each side remains visible at any moment.
How each ring picks where to anchorAnchored VWAPA VWAP that begins at a chosen pivot bar (a swing high or swing low) and runs forward. Anchoring makes the absolute level meaningful instead of drifting with whatever bars happen to load.Click for full definition →. Every bar, the indicator asks two questions for each of the four scopes:
- Where was the highest high in this lookback window? The top envelope starts there and tracks volume-weighted average priceVolume-Weighted Average PriceAn average where each bar's contribution is scaled by its volume, so heavy-volume bars pull the line harder than thin ones. Used as a slow centre of gravity.Click for full definition → forward.
- Where was the lowest low in this lookback window? The bottom envelope starts there and tracks the other side.
The colour and thickness of each ring tell you which scope you're looking at:
| What you're seeing | Ring | Plain English |
|---|---|---|
| Thin red and green lines hugging price | 🟢 Level 1 (fastest) | The most recent micro pivotPivot High / Pivot LowA bar that is higher (or lower) than a defined number of bars on both sides. Confirmed only after the right-hand bars print without breaking it.Click for full definition → — last ~17 bars |
| Slightly thicker rings a bit further out | 🟡 Level 2 (medium) | The intra-week swing highSwing High and Swing LowThe most recent confirmed pivot in either direction. Swing highs cap rallies until broken; swing lows support pullbacks until broken.Click for full definition → and low |
| Bold rings well above and below price | 🟠 Level 3 (slow) | The dominant monthly pivotPivot High / Pivot LowA bar that is higher (or lower) than a defined number of bars on both sides. Confirmed only after the right-hand bars print without breaking it.Click for full definition → |
| Heaviest rings, often near the edges of the pane | 🔴 Level 4 (very slow) | The macro-regime ceiling and floor |
The thicker the line, the longer-term the level. Red is always the resistance side (anchoredAnchored VWAPA VWAP that begins at a chosen pivot bar (a swing high or swing low) and runs forward. Anchoring makes the absolute level meaningful instead of drifting with whatever bars happen to load.Click for full definition → from a high); green is always the support side (anchoredAnchored VWAPA VWAP that begins at a chosen pivot bar (a swing high or swing low) and runs forward. Anchoring makes the absolute level meaningful instead of drifting with whatever bars happen to load.Click for full definition → from a low). When rings stack tightly together you're in coiled, low-range territory. When they fan wide apart you're inside a freshly extended trend.
3. What You See on the Chart
| Element | Looks like | Means |
|---|---|---|
| Level 1 rings | Thin red line above + thin green line below price | Fast pivotPivot High / Pivot LowA bar that is higher (or lower) than a defined number of bars on both sides. Confirmed only after the right-hand bars print without breaking it.Click for full definition → — the last 17-bar swing highSwing High and Swing LowThe most recent confirmed pivot in either direction. Swing highs cap rallies until broken; swing lows support pullbacks until broken.Click for full definition → and low |
| Level 2 rings | Medium red and green lines, further from price | Medium-term swing structureMarket StructureThe pattern of swing highs and lows price prints as it moves. Healthy uptrends print higher highs and higher lows; healthy downtrends print the mirror.Click for full definition → — last ~72 bars |
| Level 3 rings | Bold red and green lines | Slow regime levels — last ~305 bars |
| Level 4 rings | Heaviest red and green lines, often hugging the chart edges | Macro pivotPivot High / Pivot LowA bar that is higher (or lower) than a defined number of bars on both sides. Confirmed only after the right-hand bars print without breaking it.Click for full definition → — the dominant high and low of the last ~1292 bars |
| Red fill bands | Translucent red shading on each ring | Resistance zone — the volume-weighted ceiling |
| Green fill bands | Translucent green shading on each ring | Support zone — the volume-weighted floor |
| Mid-line tick marks | Small blue tags on the right axis | The ohlc-style mid VWAPVolume-Weighted Average PriceAn average where each bar's contribution is scaled by its volume, so heavy-volume bars pull the line harder than thin ones. Used as a slow centre of gravity.Click for full definition → for each level — the "fair value" inside each band |
| Hidden rings | Gaps where you'd expect a line | Auto-hide kicked in — that ring is redundant because a closer ring already covers the same area |
Default colour scheme: red for the upper envelopes, green for the lower envelopes, blue tags for the mid VWAPVolume-Weighted Average PriceAn average where each bar's contribution is scaled by its volume, so heavy-volume bars pull the line harder than thin ones. Used as a slow centre of gravity.Click for full definition → labels on the price axis. Linewidth grows with each level so the slow rings always pop visually.
4. Reading It in 3 Patterns
Pattern A — All four rings aligned
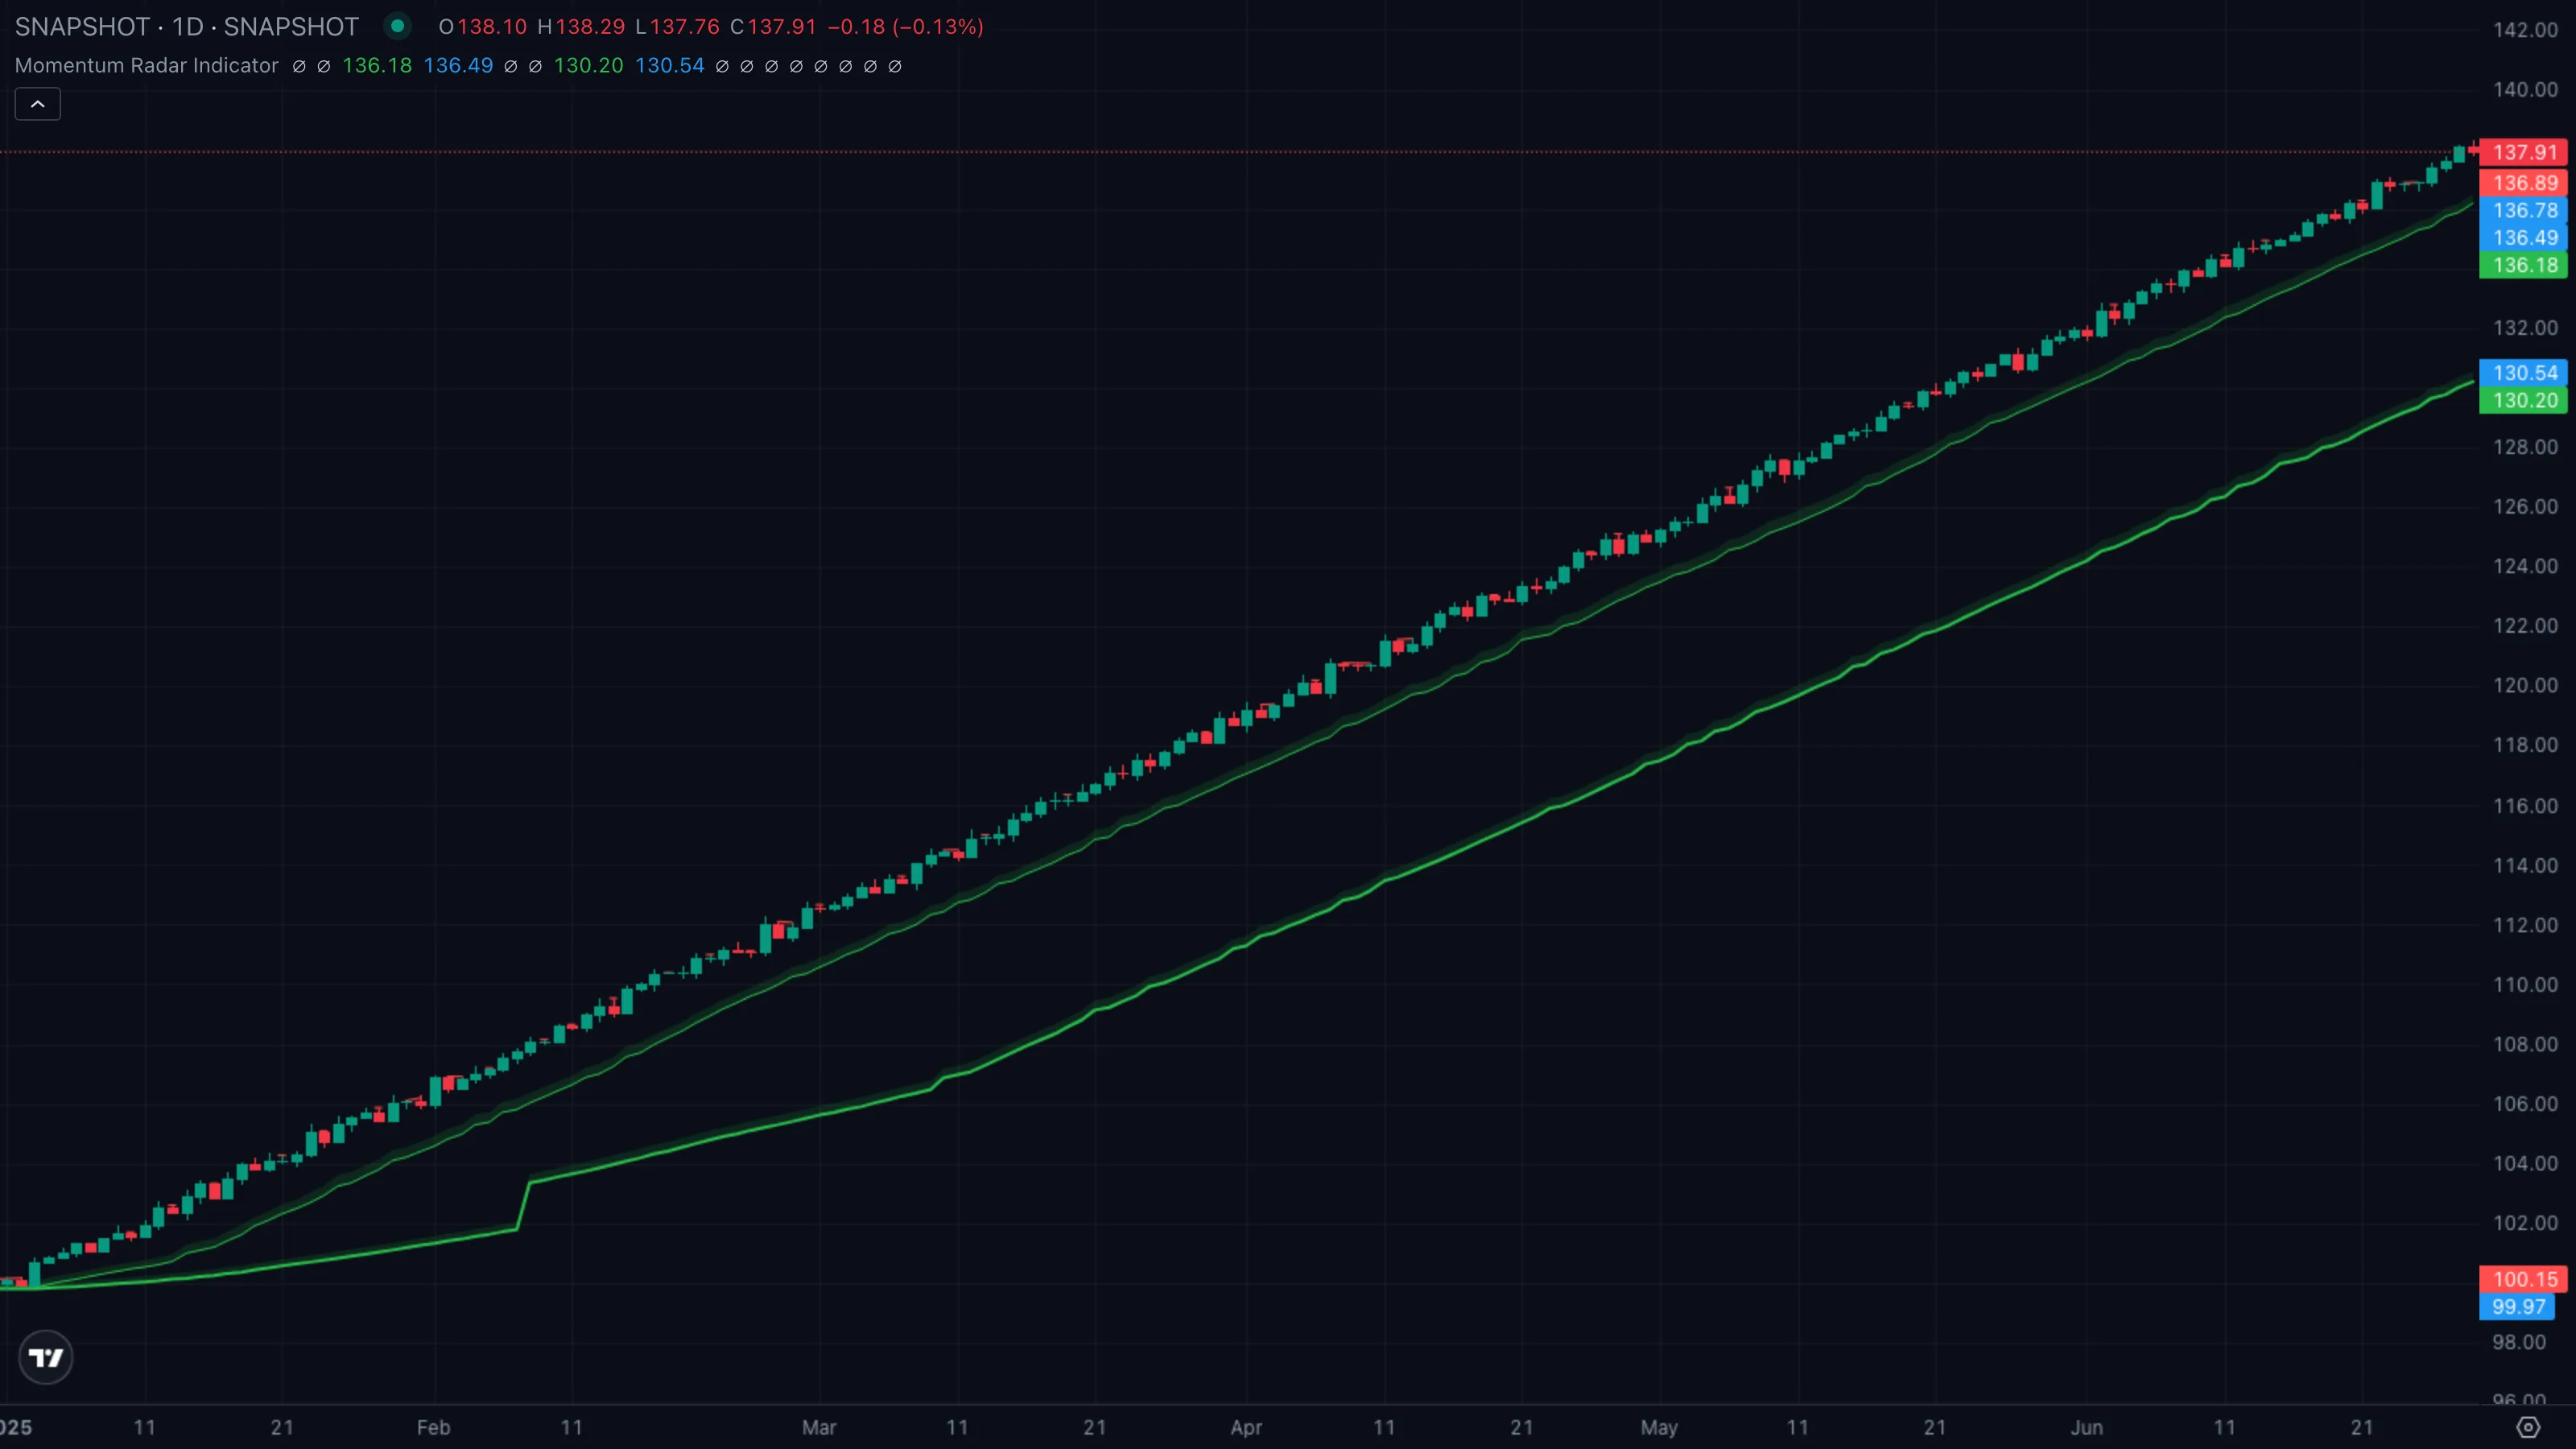
| What you see | (1) All four red rings sit cleanly above price, in order (Level 1 closest, Level 4 furthest). (2) All four green rings sit cleanly below, also in order. (3) Price drifts upward from the green rings toward the lower red ring. |
| What it means | Every scope agrees. The pivotPivot High / Pivot LowA bar that is higher (or lower) than a defined number of bars on both sides. Confirmed only after the right-hand bars print without breaking it.Click for full definition → from 17 bars ago, 72 bars ago, 305 bars ago, and 1292 bars ago all sit on the same side relative to price. Short-term, medium-term, and macro momentum are pointing the same way — this is the cleanest possible regime. |
| What to do | Trade in the direction of the stack. Buy pullbacksPullback (Retracement)A short, counter-trend move within an established trend — buyers (or sellers) momentarily losing ground before the trend resumes. Often the lowest-risk place to enter the trend.Click for full definition → into the nearest green ring (Level 1 or 2) with a stop below the next ring out. Don't fight the alignment. |
Pattern B — Split rings across scopes
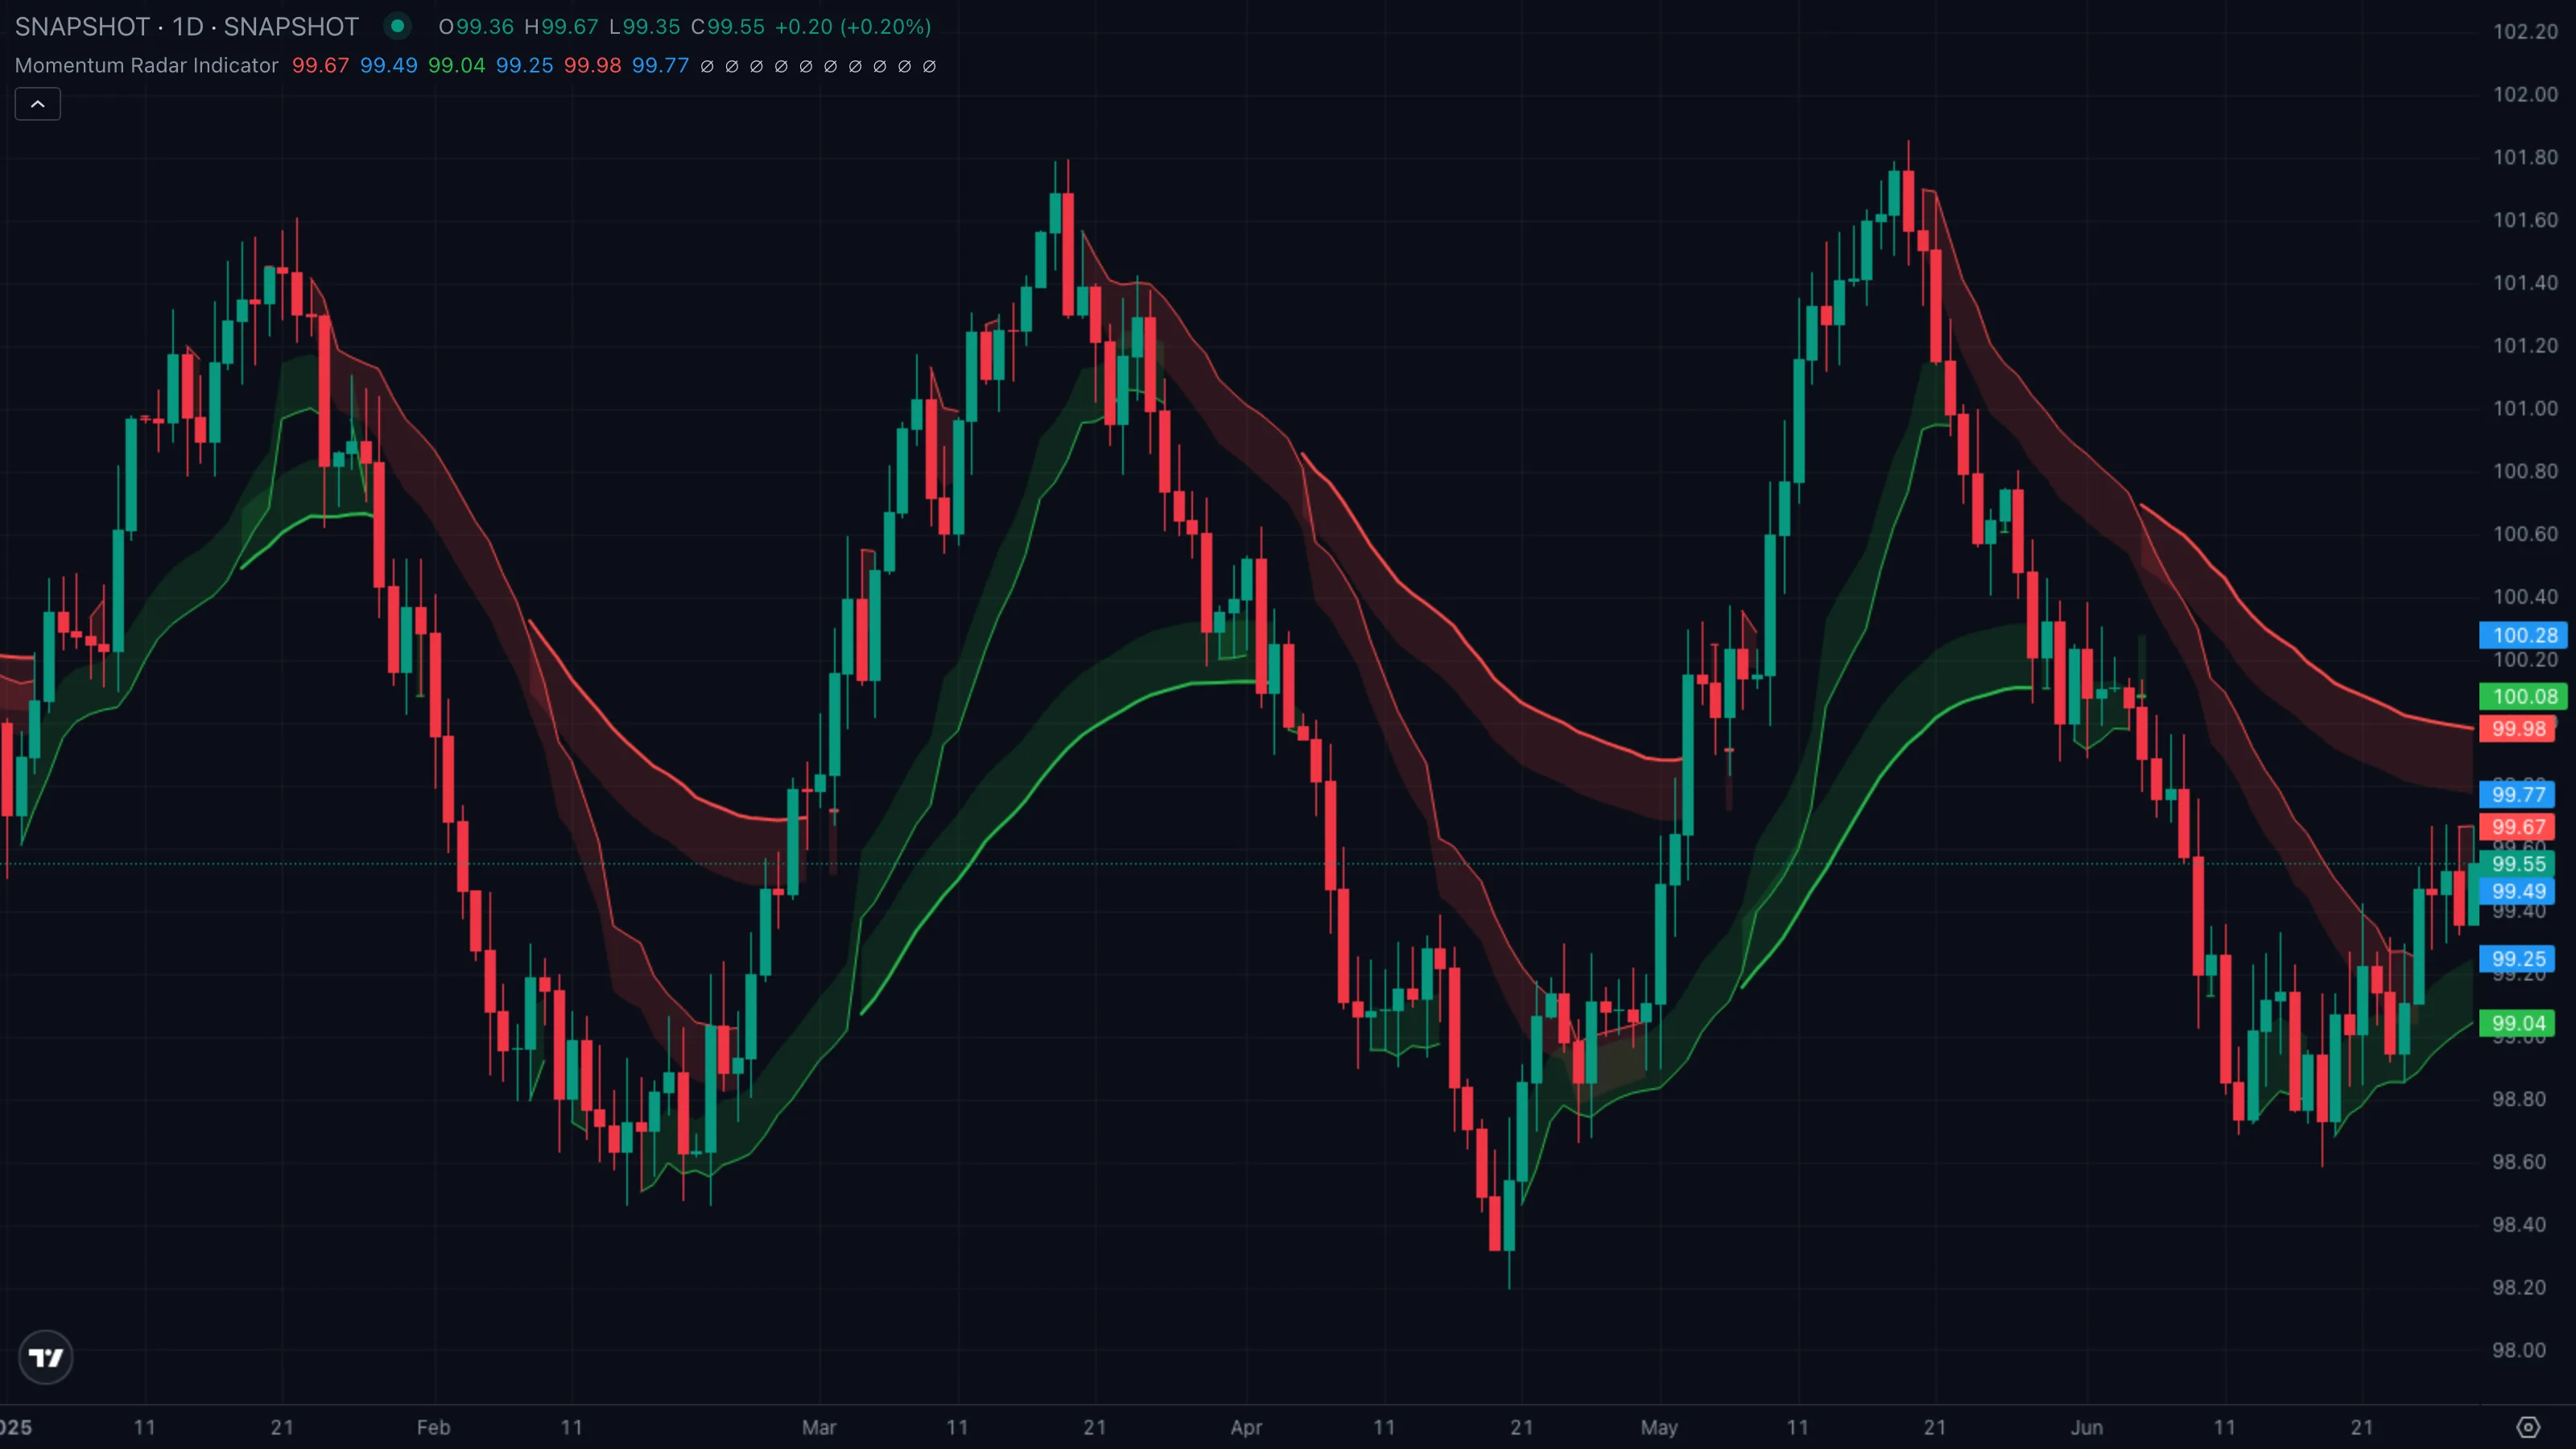
| What you see | (1) Level 1 and 2 (fast rings) sit on one side of price. (2) Level 3 and 4 (slow rings) sit on the other side. (3) Price oscillates between the inner fast pair and gets rejected at one of the slow rings. |
| What it means | Short-term momentum disagrees with long-term momentum. The market is mean-reverting inside a wider range — a fast move is unwinding against the dominant trend, or vice versa. There's no clean directional edge here. |
| What to do | Stand aside if you trade trends. If you fade ranges, this is where mean reversionMean ReversionThe expectation that price, after stretching far from a baseline (a moving average, prior range), will snap back toward it. Works best in chop and range-bound markets.Click for full definition → shines — short into the upper slow ring, cover at the lower fast ring (or vice versa). Wait for the fast and slow rings to realign before taking a trend trade. |
Pattern C — Regime change as outer rings flip
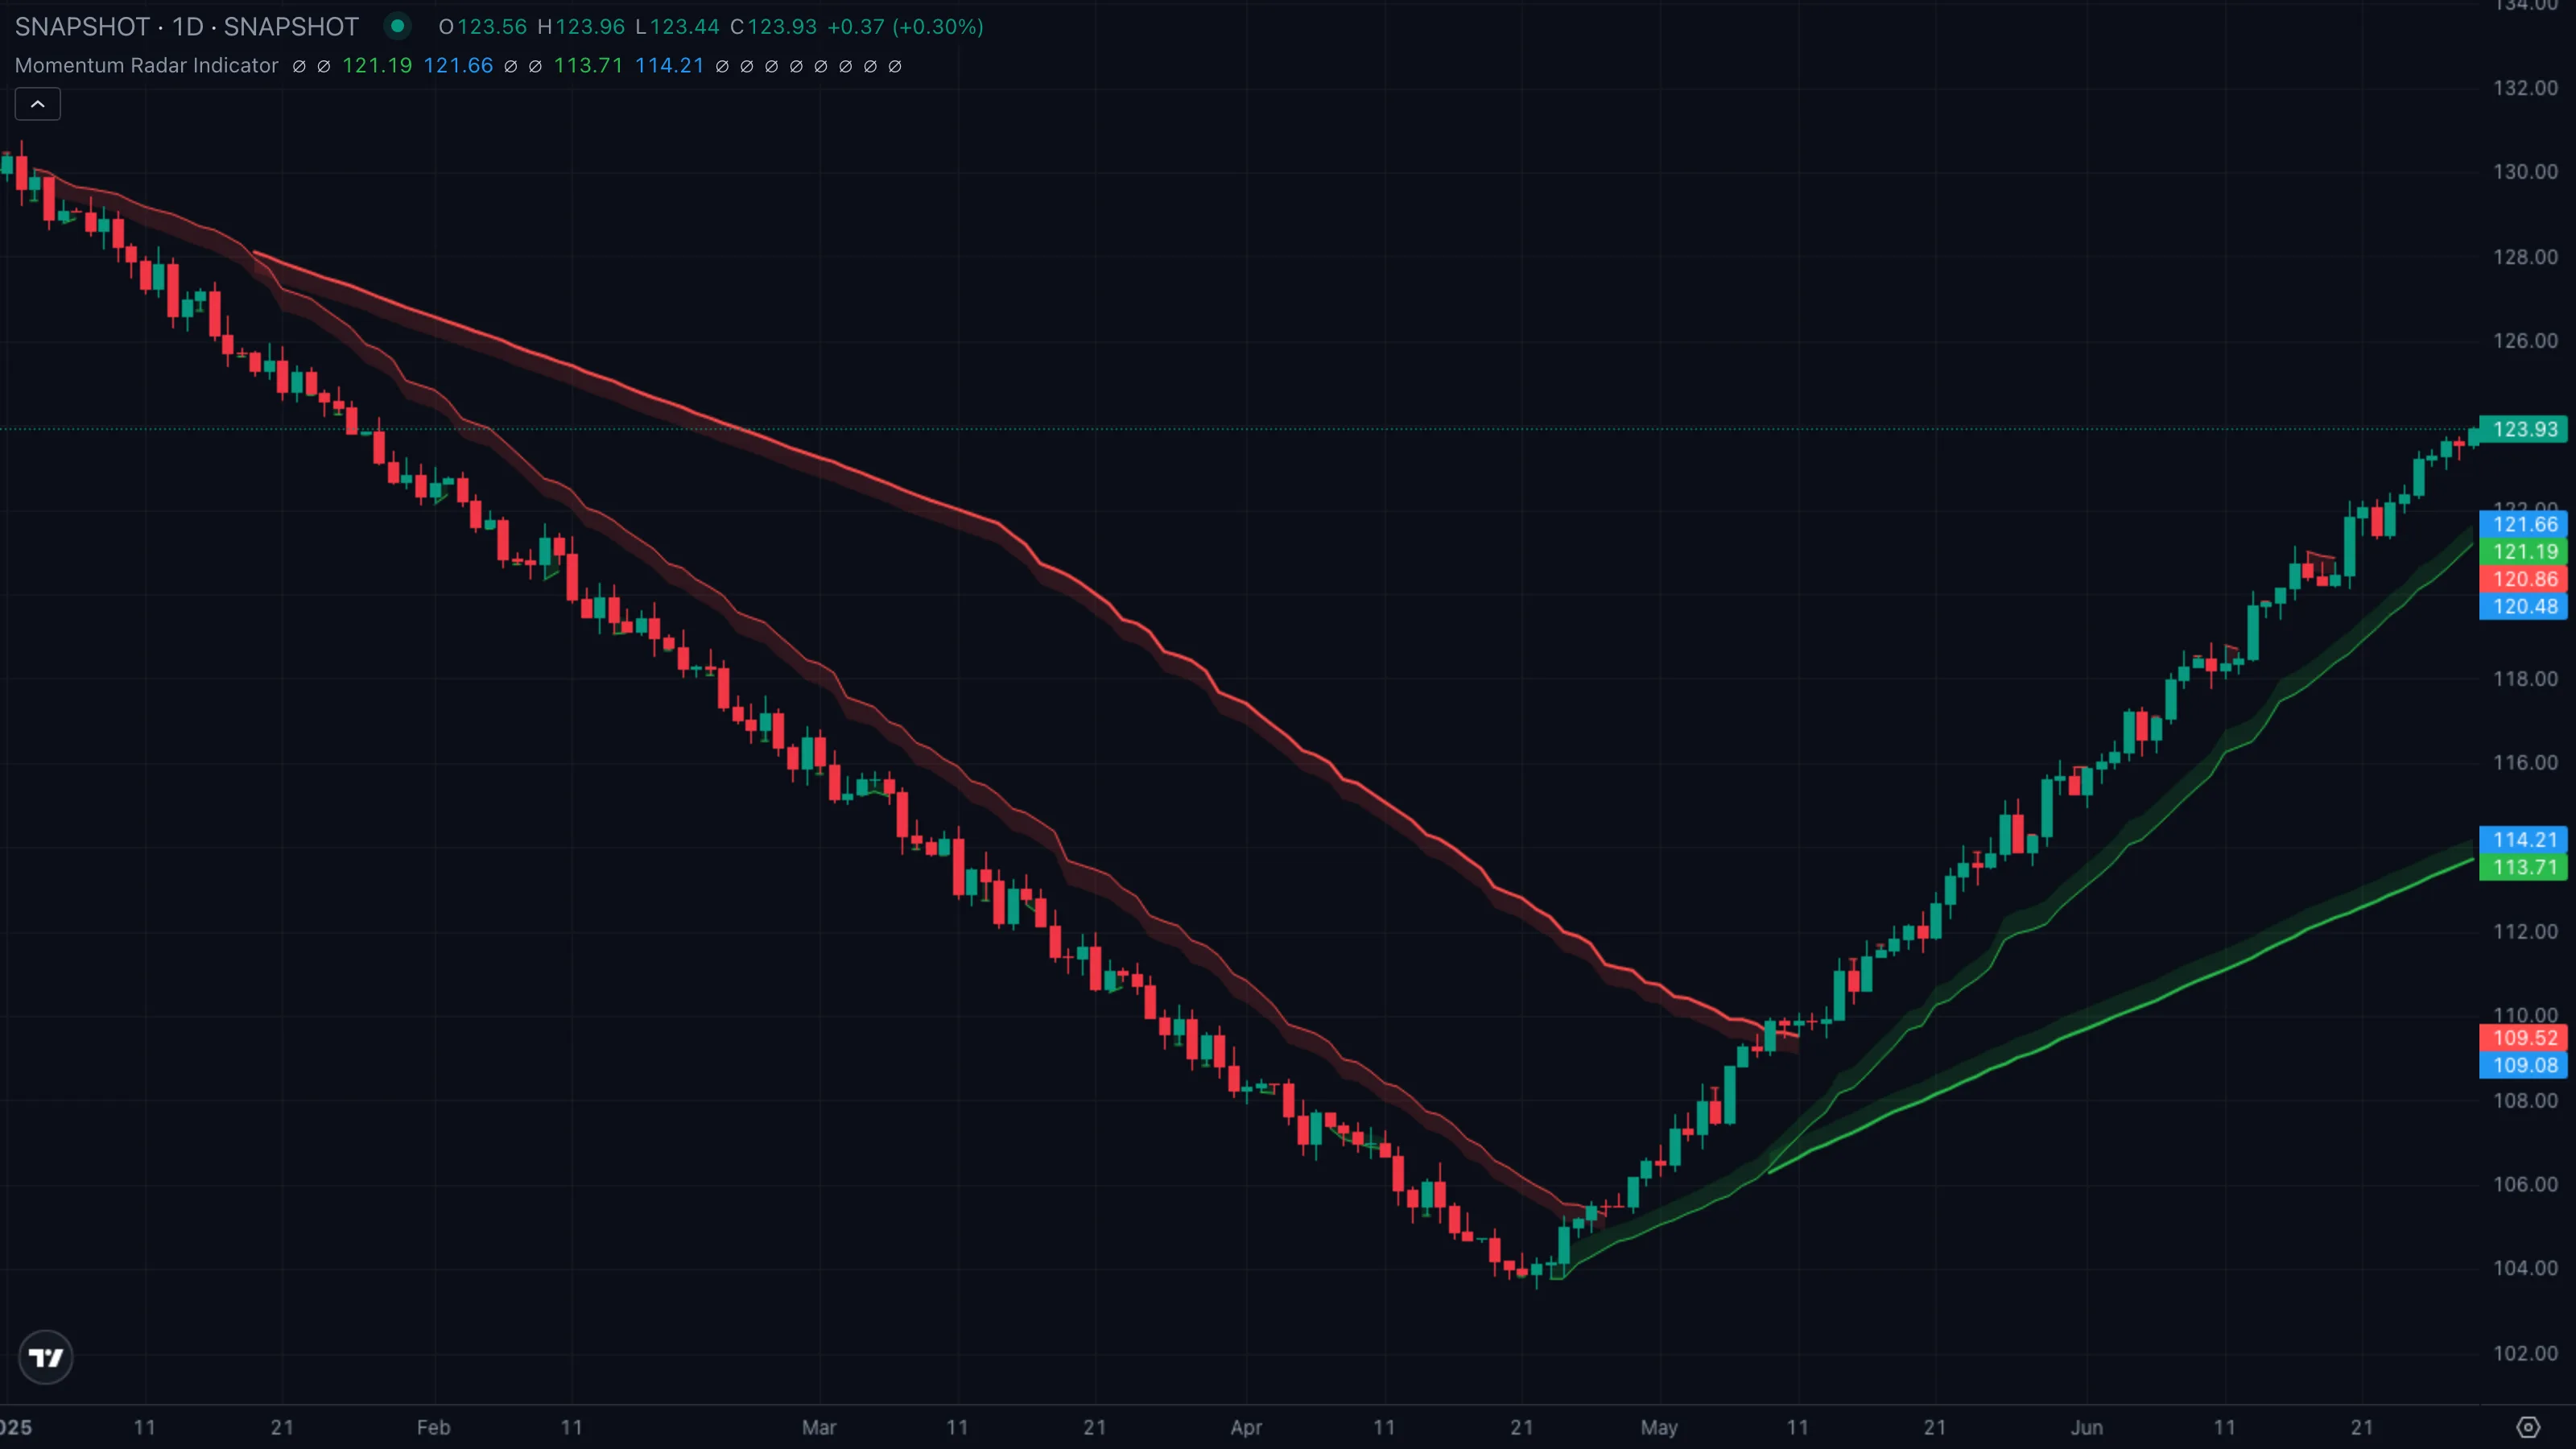
| What you see | (1) Price had been stuck below a heavy red Level 3 or 4 ring for a long time. (2) A clean break above the slow ring closes and holds. (3) The next session, the same level shows up as a green ring underneath price — its role flipped from resistance to support. |
| What it means | A macro pivotPivot High / Pivot LowA bar that is higher (or lower) than a defined number of bars on both sides. Confirmed only after the right-hand bars print without breaking it.Click for full definition → just changed sides. The level that has been capping price for hundreds of bars is now acting as a floor. This is how multi-month regimes turn — slowly, then with a single clean break. |
| What to do | Wait for the first pullbackPullback (Retracement)A short, counter-trend move within an established trend — buyers (or sellers) momentarily losing ground before the trend resumes. Often the lowest-risk place to enter the trend.Click for full definition → to retest the broken ring rather than chasing the breakout bar. A retest that holds the now-green ring is the textbook entry; a retest that breaks back through it tells you the flip was a fakeout and to stand down. |
5. Trade Walkthrough
| Symbol | ETHUSDT |
|---|---|
| Timeframe | 1H |
| Venue | Binance |
| Window | 10 Mar to 22 Mar 2026 |
| Pattern | C — regime change as outer rings flip |
A clean macro flip on ETH. After a multi-week grind below the Level 3 red ring near 3,420, ETH finally tagged through it on 15 March and held. The retest two sessions later turned that exact same level — now drawn as the Level 3 green ring at 3,415 — into the launch pad for a roughly +7 % push into 22 March. The numbered markers (1)–(4) on the chart map to the four phases below.
The sequence
| # | When | ETH price | Indicator state | What it tells you |
|---|---|---|---|---|
| (1) | 10 Mar to 14 Mar | 3,200 to 3,380 grind | Level 3 red ring acts as ceiling, fast green rings hold underneath | Caught between scopes. Fast momentum is fine, slow momentum still capped. Pattern B regime. |
| (2) | 15 Mar | ~3,440 close | Level 3 ring flips | Price closes above the Level 3 red ring. Within two bars the ring redraws on the green side at ~3,415. Pattern C trigger. |
| (3) | 17 Mar | ~3,420 low | All four rings now stacked below price | First pullbackPullback (Retracement)A short, counter-trend move within an established trend — buyers (or sellers) momentarily losing ground before the trend resumes. Often the lowest-risk place to enter the trend.Click for full definition → retests the freshly-flipped Level 3 green ring. The real entry. |
| (4) | 21 Mar | ~3,660 high | Price extends well above Level 1 red ring | Move is stretched. Cue to take profit before the next pullbackPullback (Retracement)A short, counter-trend move within an established trend — buyers (or sellers) momentarily losing ground before the trend resumes. Often the lowest-risk place to enter the trend.Click for full definition →. |
The trade in one card
| What you skipped | Market-buying the breakout bar at 3,440 — the chase trade. The next two bars wicked back to 3,360 and would have stopped you out. |
| What you took | PullbackPullback (Retracement)A short, counter-trend move within an established trend — buyers (or sellers) momentarily losing ground before the trend resumes. Often the lowest-risk place to enter the trend.Click for full definition → into the freshly-flipped Level 3 green ring at ~3,420, with all four rings now stacked underneath price. |
| Where you exited | Price extended above all rings into 3,660 with the Level 1 red ring more than 1 % away — classic stretched move. |
| Move captured | ~ +7.0 % in roughly four days. |
Lesson
The outer ring flip gives you the alert. The first retest that holds the flipped ring gives you the trade. Price extending well past the fastest ring tells you the move is stretched and it's time to step out.
6. Common Pitfalls
- Treating every ring tag as a signal. Price tags the Level 1 ring constantly in any normal trend — it's only ~17 bars deep, so reactions there are noise. The signals worth acting on are at Level 3 and Level 4, which only flip every few weeks or months.
- Ignoring the auto-hide gaps. When a slower ring vanishes for a stretch of bars it means a faster ring already covers the same area. Don't try to extrapolate the hidden line — trust the ring that's actually drawn.
- Trading Pattern B as if it were Pattern A. Split rings across scopes is a stand-aside or mean-reversionMean ReversionThe expectation that price, after stretching far from a baseline (a moving average, prior range), will snap back toward it. Works best in chop and range-bound markets.Click for full definition → regime, not a trend-followingTrend FollowingThe opposite of mean reversion — staying with a directional move once it's established, exiting only when the trend itself breaks. Works best in trending markets.Click for full definition → one. Buying the fast green ring while price is still capped by a slow red ring is how chop chews up trend traders.
- Confusing inner and outer rings on a fresh chart. On a chart with less history than 1292 bars, the outer rings have nowhere to anchorAnchored VWAPA VWAP that begins at a chosen pivot bar (a swing high or swing low) and runs forward. Anchoring makes the absolute level meaningful instead of drifting with whatever bars happen to load.Click for full definition → and may sit close to recent price. Sanity-check by linewidth — the heaviest line is always Level 4.
- Mistaking the mid-line ticks for tradeable levels. The blue right-axis tags are the "fair value" inside each band, not pivotsPivot High / Pivot LowA bar that is higher (or lower) than a defined number of bars on both sides. Confirmed only after the right-hand bars print without breaking it.Click for full definition → in their own right. The actual support and resistance are the red and green lines.