

Momentum Trend Predictor
A QQE-tuned momentum oscillator that holds a directional read on the trend and tells you when buyers or sellers have actually surrendered, instead of flipping on every overbought-oversold tick.
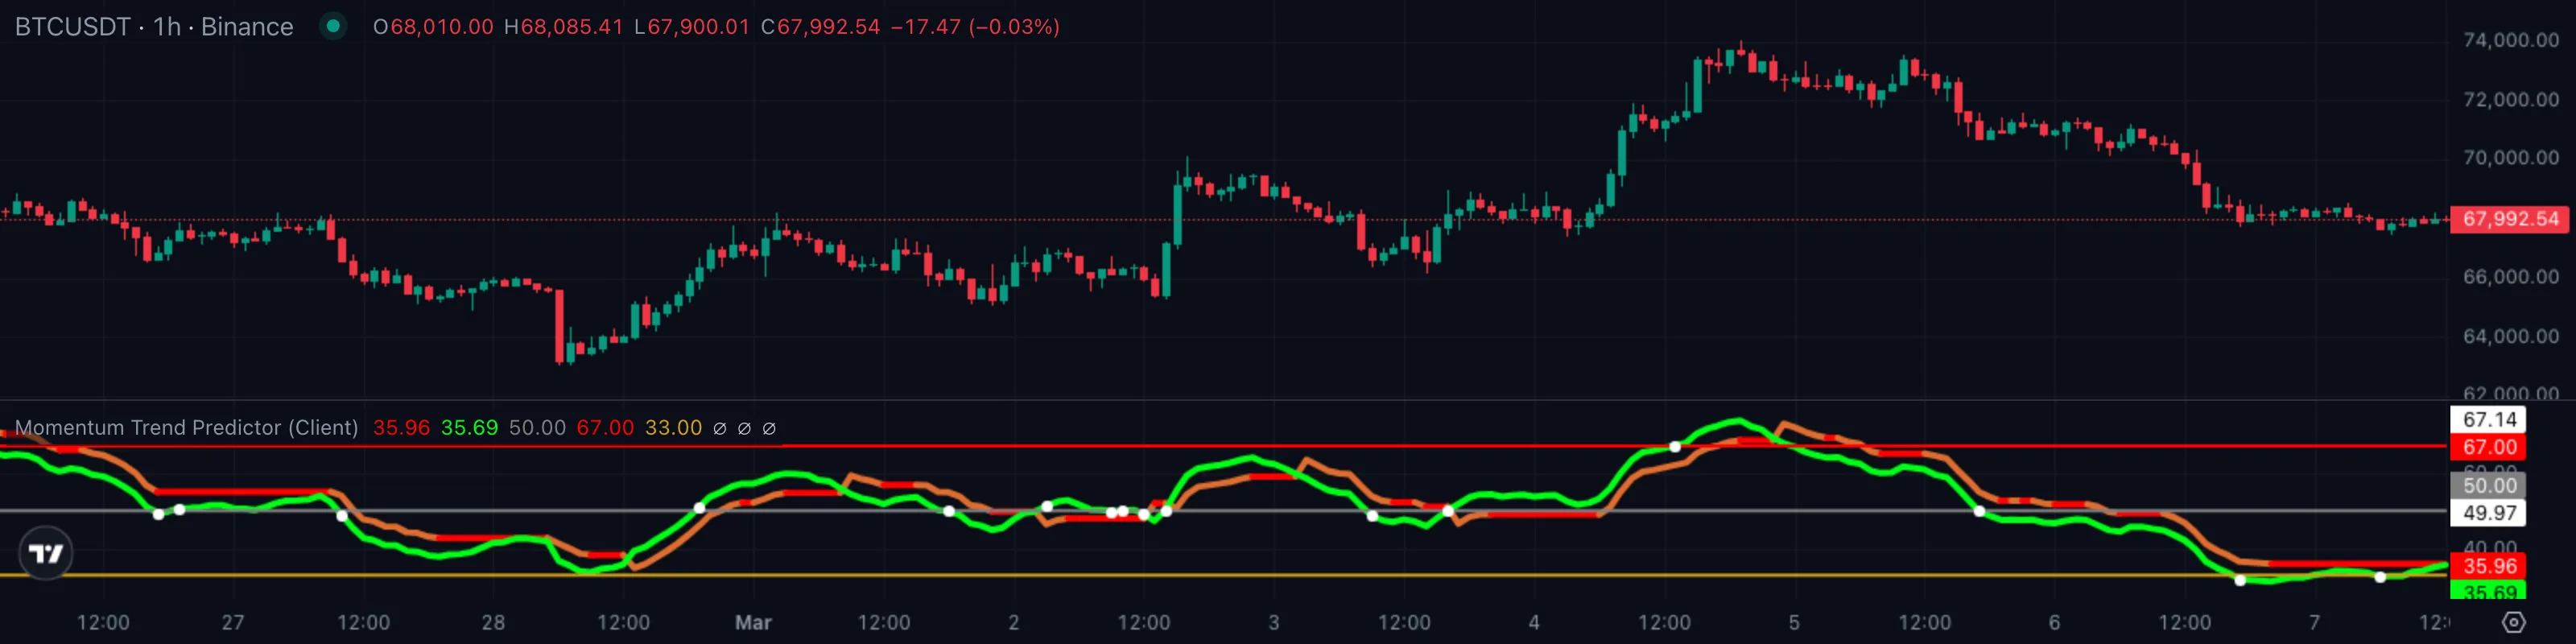
1. What This Indicator Watches For
A plain RSIRelative Strength IndexA 0-to-100 momentum oscillator measuring the size of recent up-bars versus down-bars. Above 70 is hot, below 30 is cold, near 50 is neutral.Click for full definition → is the most-watched oscillator on every retail screen — and it's also the single biggest source of false signals in trending markets. Price hits "overbought" at 70 and a generation of traders shorts the rip, only to watch it grind to 80, then 85, then a new high. The reading was correct. The reaction was wrong.
The root problem is that RSIRelative Strength IndexA 0-to-100 momentum oscillator measuring the size of recent up-bars versus down-bars. Above 70 is hot, below 30 is cold, near 50 is neutral.Click for full definition → flips overbought and oversold based on a fixed look-back, but a strong trend keeps the oscillator pinned at one end for long stretches. What you actually want to know is two different things:
- Is momentum turning yet, or is the trend simply taking a breather inside the same direction?
- When momentum does turn, how far does it have to move before you're allowed to take the new side seriously?
Momentum Trend Predictor answers both. It smooths RSIRelative Strength IndexA 0-to-100 momentum oscillator measuring the size of recent up-bars versus down-bars. Above 70 is hot, below 30 is cold, near 50 is neutral.Click for full definition → into a stable line, then surrounds it with a self-adjusting trailing band that only flips when the smoothed line breaks through the band — not when it merely visits the 30 or 70 zone. The band tightens in calm conditions and loosens in volatile ones, so the same rules behave well on a sleepy 4-hour chart and a blasting 1-hour breakout.
2. How It Works Under the Hood
Three engines run in series and the pane shows you the output of all three:
- Smoothed momentum line. The indicator starts with a length-20 RSIRelative Strength IndexA 0-to-100 momentum oscillator measuring the size of recent up-bars versus down-bars. Above 70 is hot, below 30 is cold, near 50 is neutral.Click for full definition → of close, then runs a 5-bar EMAExponential Moving AverageA moving average that weights recent bars more heavily than old ones, so it reacts faster to fresh price action than a simple average of the same length.Click for full definition → on top of that. The result is a green line that moves like RSIRelative Strength IndexA 0-to-100 momentum oscillator measuring the size of recent up-bars versus down-bars. Above 70 is hot, below 30 is cold, near 50 is neutral.Click for full definition → but without the single-bar jitter — the swings you see are real swings, not one-bar artefacts.
- Self-adjusting trailing band. Around the green line, the indicator builds an envelope based on the smoothed line's own typical bar-to-bar movement. The band sits below the green line when the trend is up and above it when the trend is down. The width of that envelope expands and contracts with momentum volatility, so it gives the green line just enough leash to breathe without getting whipsawed.
- Discrete trend state. A one-or-minus-one flag tracks which side the band is currently on. The flag flips to long the moment the green line punches up through the prior down-band, and flips short the moment it falls through the prior up-band. Between flips, the state holds — even when the green line wanders into the middle zone.
How the trend state picks its side. Every bar, the indicator asks two questions:
- Where is the smoothed line right now relative to the trailing band on the opposite side? A clean break of the opposite-side band is the trigger; mere drift across midline is not.
- Has the smoothed line moved enough to clear noise? The envelope width is set by the smoothed line's own recent fluctuation, scaled by a fixed multiplier near four, so the cutoff auto-calibrates to whatever instrument and timeframe you're on.
The colour of the trailing band itself encodes whether the trend is continuing or just transitioned:
| What you're seeing | Band colour | Plain English |
|---|---|---|
| Trailing band sits the same as the bar before, smoothed line above it | 🟢 Continuing long | Trend persists, sit on your hands |
| Trailing band just jumped to the other side of the smoothed line | 🟡 Transition bar | The flip happened on this bar — the alert |
| Trailing band sits the same as the bar before, smoothed line below it | 🔴 Continuing short | Trend persists, sellers in control |
The continuing-vs-transition distinction is the point. A persistent red continuation means the move is mature; an orange transition bar is the rare event you actually want to watch — it's when the engine commits to a new side.
3. What You See on the Chart
| Element | Looks like | Means |
|---|---|---|
| Smoothed momentum line | A bright green line that drifts between 0 and 100 | The 5-bar EMAExponential Moving AverageA moving average that weights recent bars more heavily than old ones, so it reacts faster to fresh price action than a simple average of the same length.Click for full definition → of length-20 RSIRelative Strength IndexA 0-to-100 momentum oscillator measuring the size of recent up-bars versus down-bars. Above 70 is hot, below 30 is cold, near 50 is neutral.Click for full definition → on close — the heart of the indicator |
| Trailing band | A thick orange / red line that sits just under or just above the green line | The QQE-tuned envelope, switching sides at every trend flip |
| Mid level | A flat gray line at 50 | The neutral pivotPivot High / Pivot LowA bar that is higher (or lower) than a defined number of bars on both sides. Confirmed only after the right-hand bars print without breaking it.Click for full definition → — green crossing this is a heads-up but not a signal on its own |
| Overbought level | A flat red line at 67 | When the green line crosses above 67, momentum has reached classic strength territory |
| Oversold level | A flat mustard-yellow line at 33 | When the green line crosses below 33, momentum has reached classic weakness territory |
| White circle at 67 cross | A small white dot on the green line as it breaks above 67 | Sell-side reversal marker — strong momentum reaching exhaustion zone |
| White circle at 33 cross | A small white dot on the green line as it breaks below 33 | Buy-side reversal marker — weak momentum reaching exhaustion zone |
| White circle at 50 cross | A small white dot when the green line crosses 50 either way | PivotPivot High / Pivot LowA bar that is higher (or lower) than a defined number of bars on both sides. Confirmed only after the right-hand bars print without breaking it.Click for full definition → marker — useful as a confirmation, never as a standalone trigger |
Default colour scheme: green for the smoothed line, orange for transition bars, red for continuing band, gray for the midline, mustard for the 33 floor, red for the 67 ceiling, white for the three reversal dots. Read the colour first, the level second.
4. Reading It in 3 Patterns
Pattern A — Trailing band flips up, smoothed line clears 50
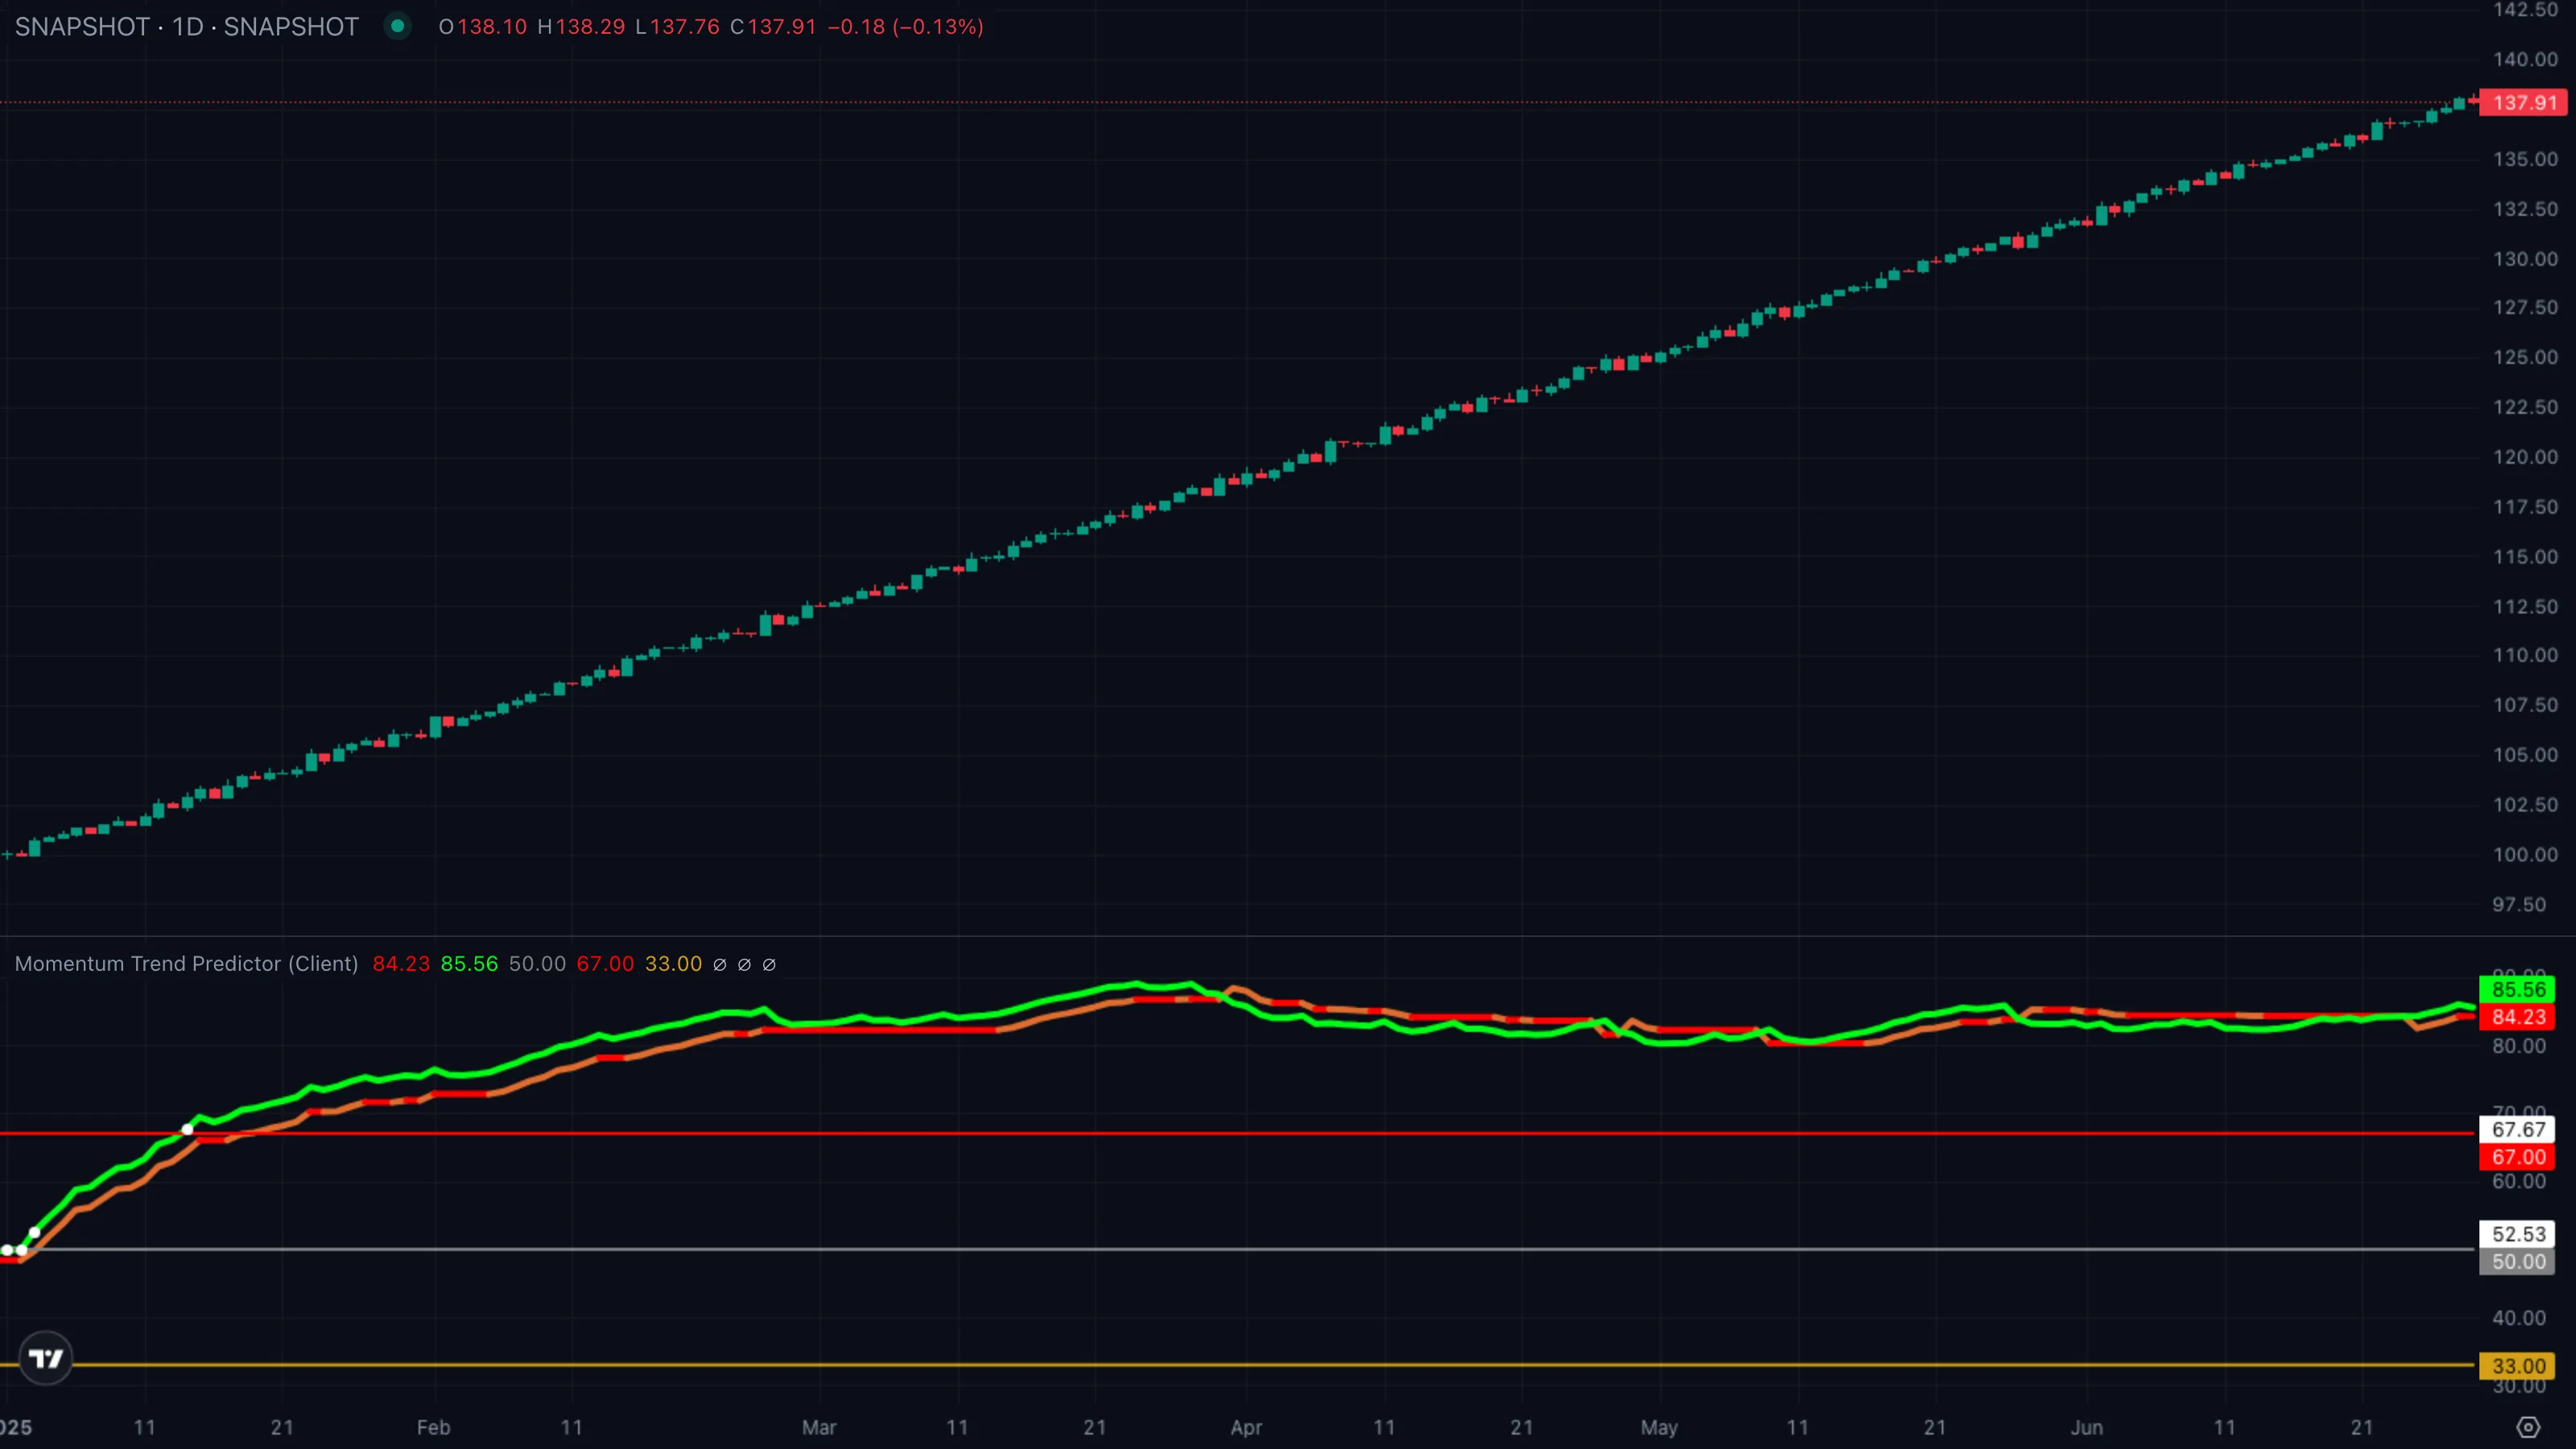
| What you see | ① The green line sweeps up from below 33 ② an orange transition bar appears as the trailing band jumps below the green line ③ a white dot prints as the green line cuts through 50. |
| What it means | The discrete state has flipped long and the smoothed line is now in the upper half of the range. Both engines agree that buyers have actually taken control, not just bounced. |
| What to do | Bias long. Use the trailing band as a soft stop reference — as long as the green line stays above it, the read holds. |
Pattern B — Smoothed line tags 67 then fails
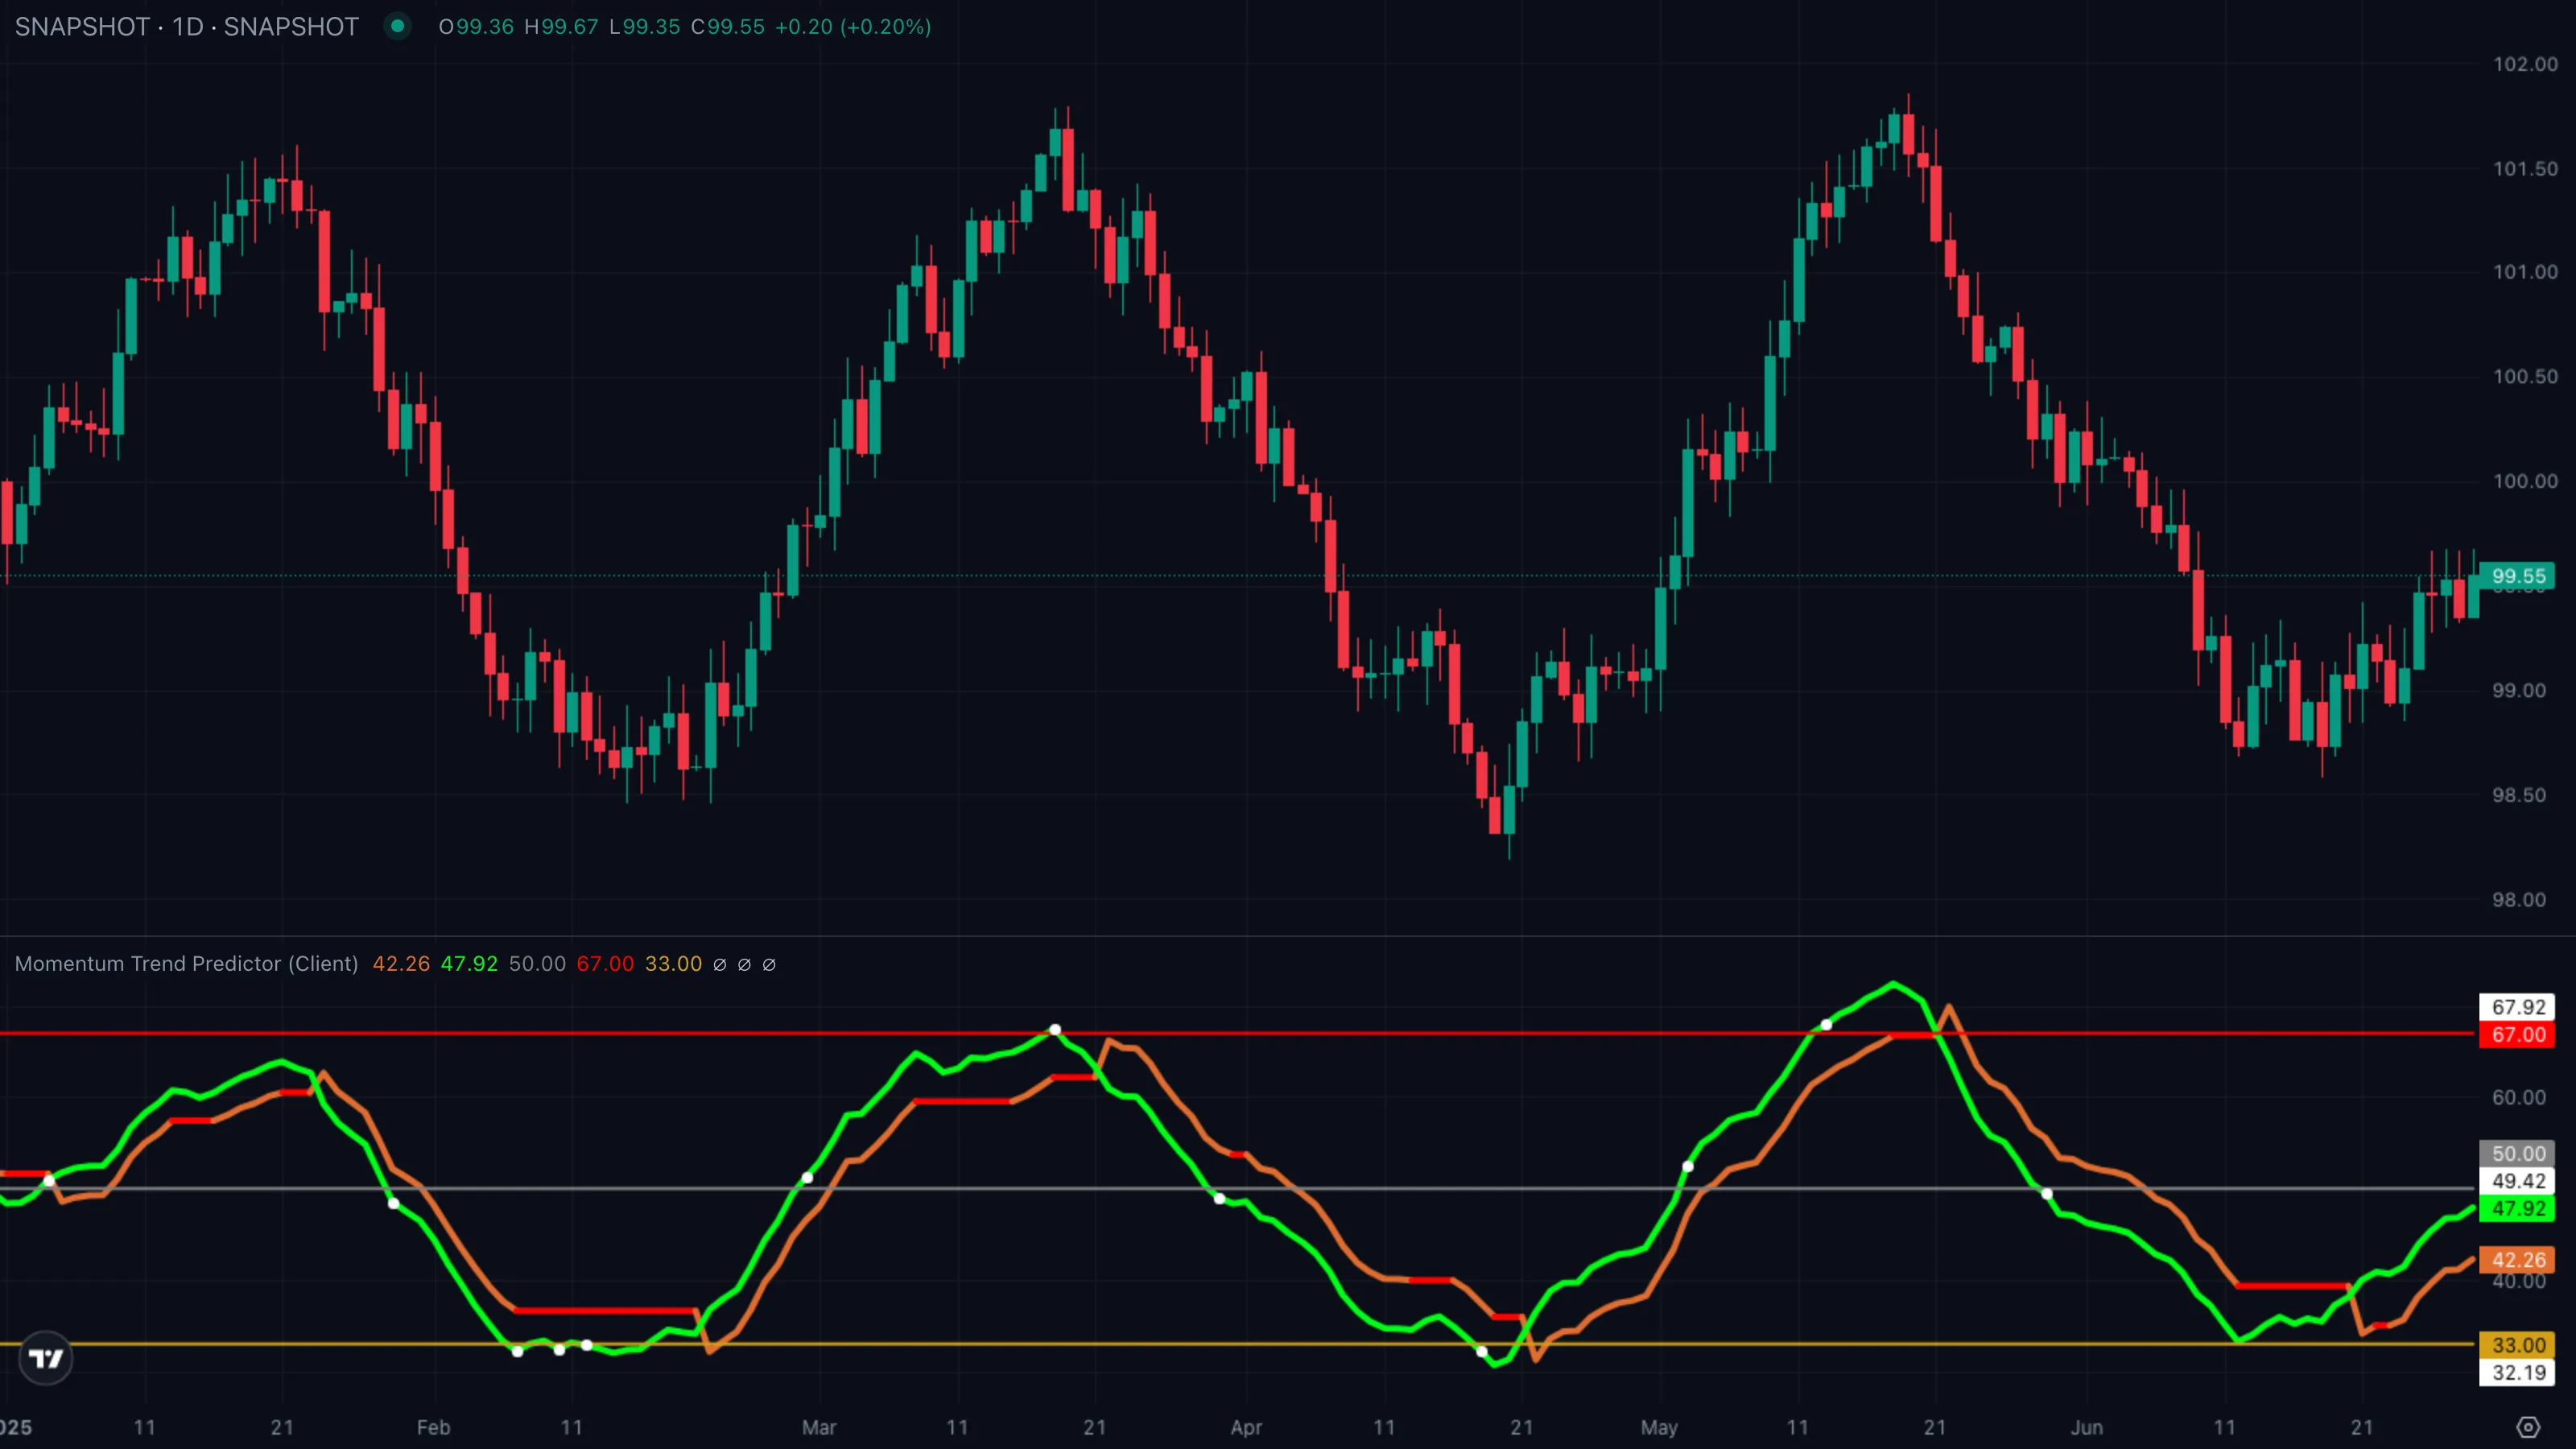
| What you see | ① Green line accelerates up and prints a white dot crossing 67 ② trailing band stays where it was, no orange transition bar ③ green line rolls back toward 50 over the next handful of bars. |
| What it means | Classic RSIRelative Strength IndexA 0-to-100 momentum oscillator measuring the size of recent up-bars versus down-bars. Above 70 is hot, below 30 is cold, near 50 is neutral.Click for full definition → overbought reading without any structural change. The trailing band — which is the indicator's actual trend memory — never flipped. The move was a stretch inside the existing regime, not a new one. |
| What to do | Don't fade in the direction the dot suggests. The reversal marker on its own is a heads-up, not a signal. Wait for an orange transition bar before taking the opposite side. |
Pattern C — Hidden continuation in a deep pullbackPullback (Retracement)A short, counter-trend move within an established trend — buyers (or sellers) momentarily losing ground before the trend resumes. Often the lowest-risk place to enter the trend.Click for full definition →
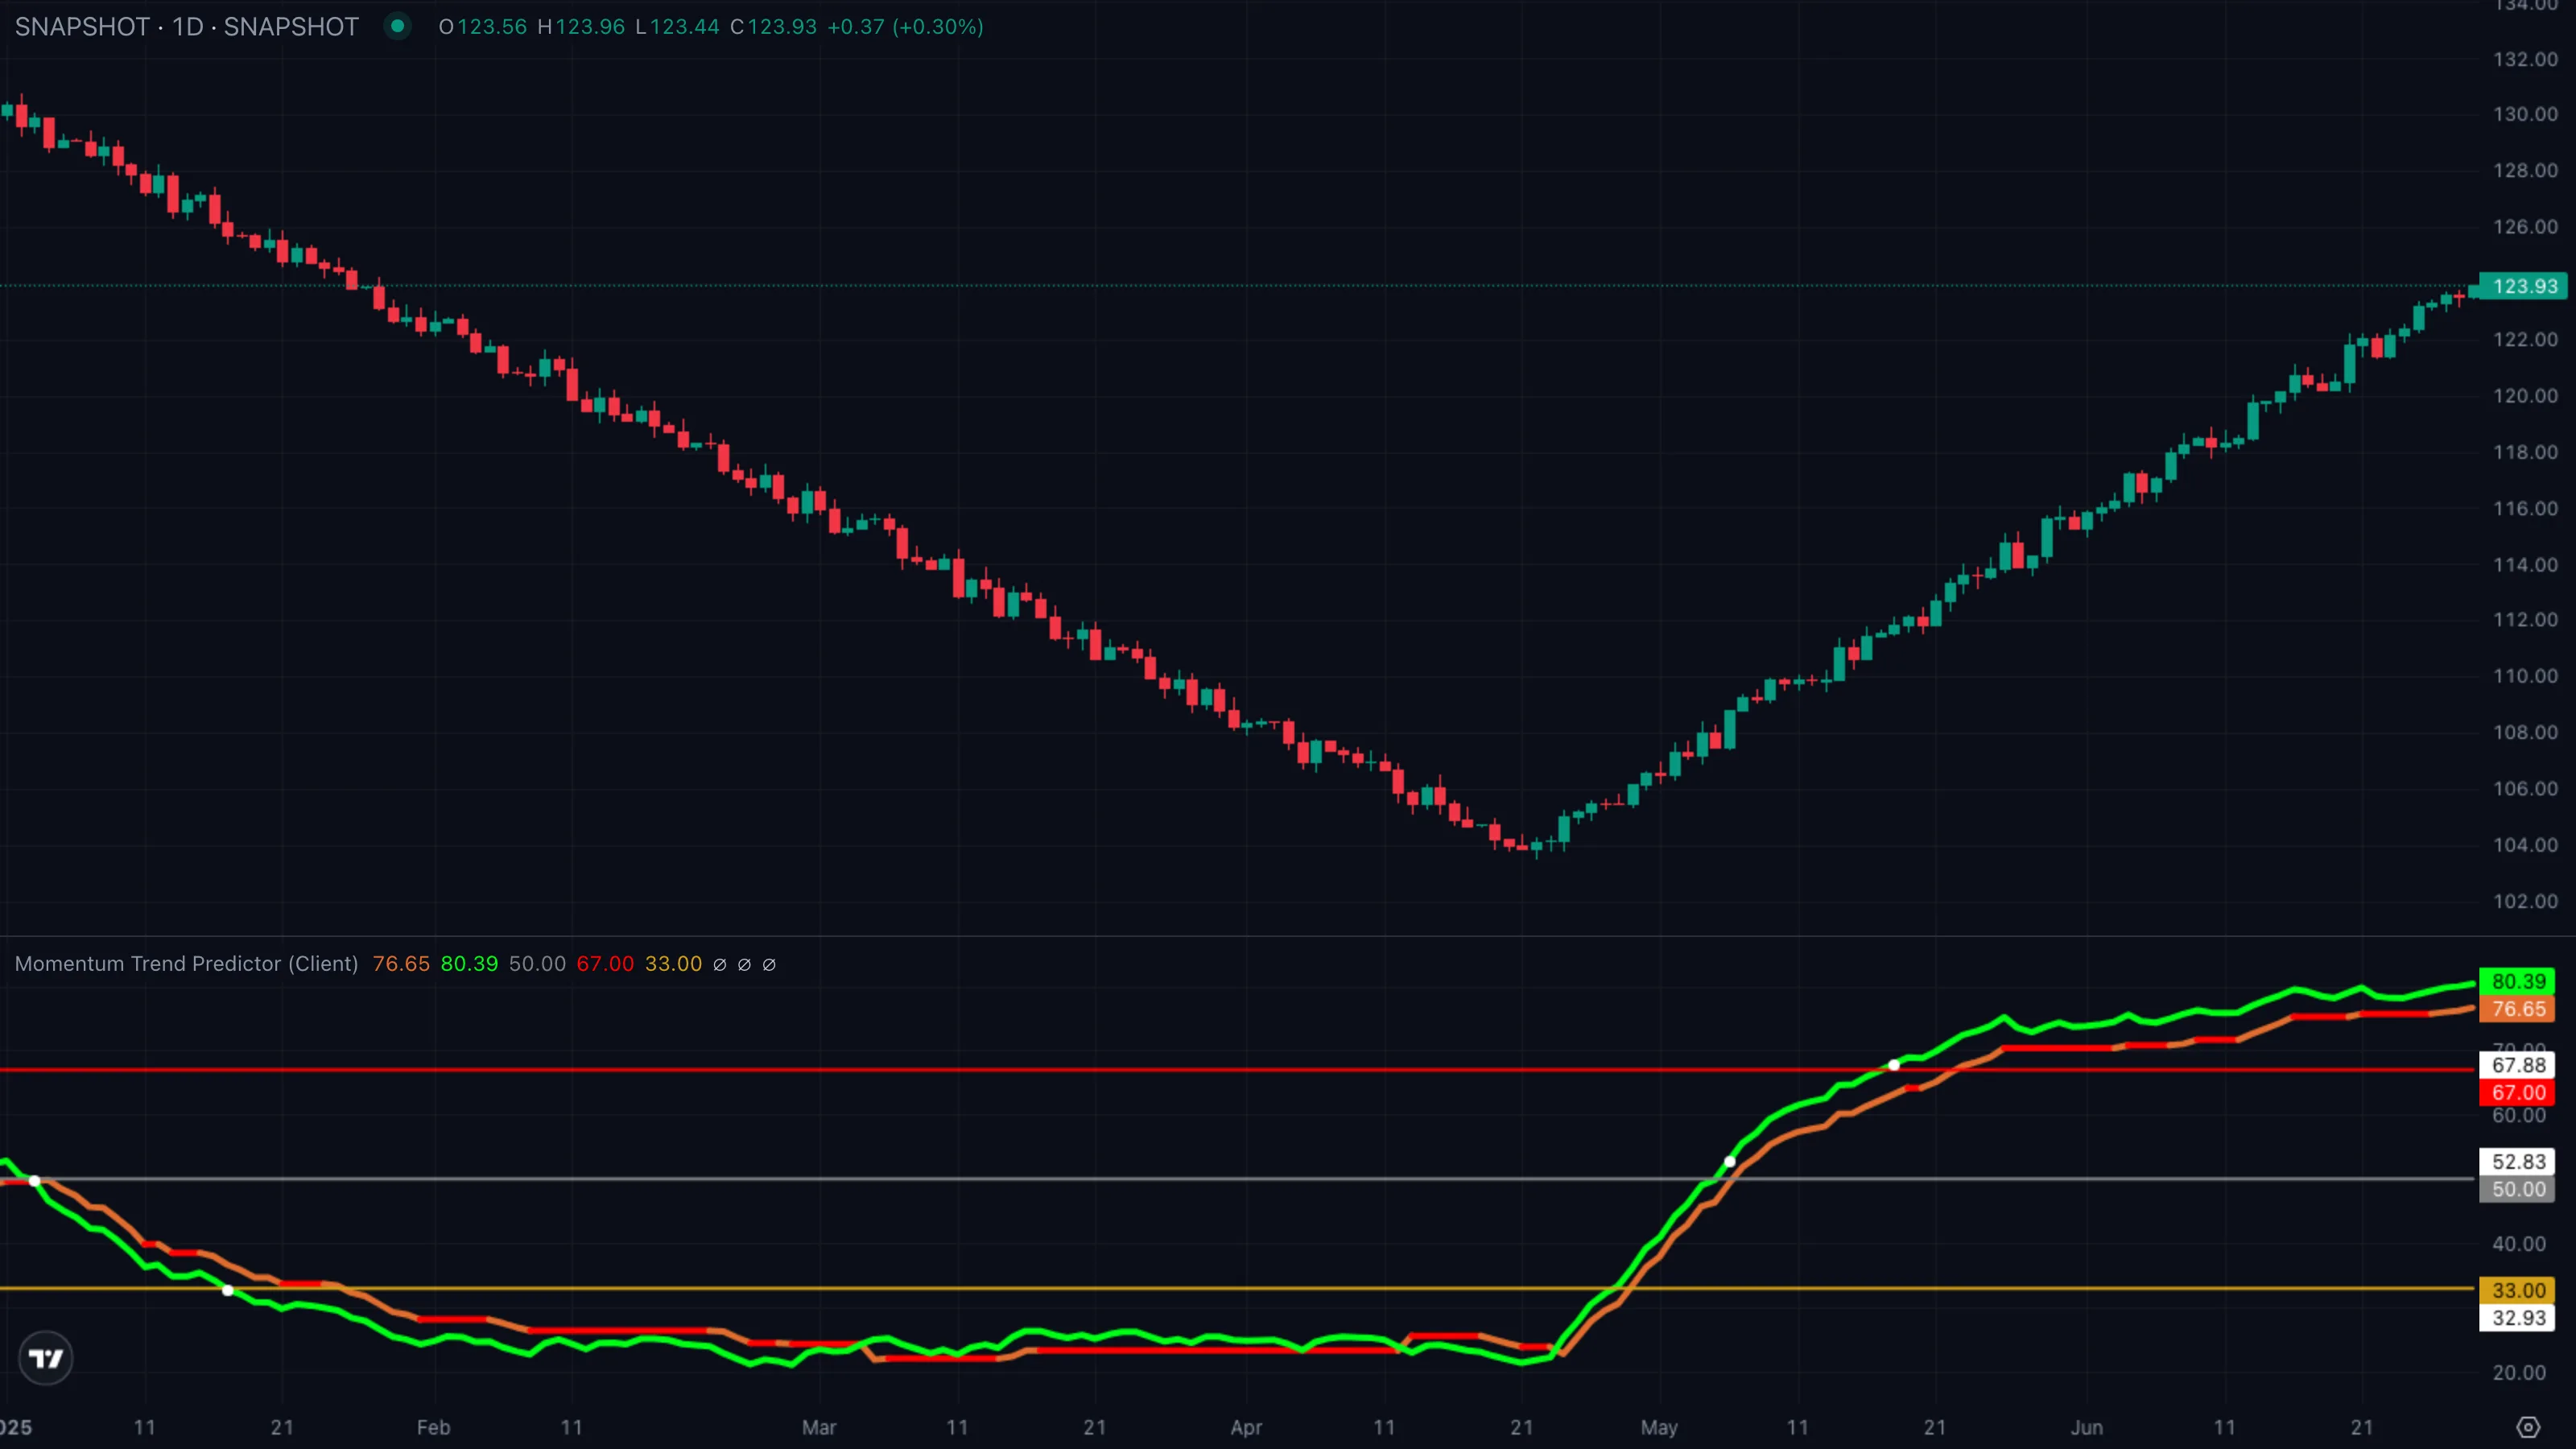
| What you see | ① Trailing band has been long for a while, green line above it ② green line dips to tag 33 and prints a white dot ③ no orange transition appears, trailing band stays under the green line, green line curls back up. |
| What it means | A textbook pullbackPullback (Retracement)A short, counter-trend move within an established trend — buyers (or sellers) momentarily losing ground before the trend resumes. Often the lowest-risk place to enter the trend.Click for full definition → in an uptrend. The momentum reading went to oversold but the trend state held — sellers tested the floor and failed. This is the lowest-risk continuation entry the indicator gives you. |
| What to do | Buy the recovery off 33 with the trailing band as the invalidation level. If the green line falls through the band on the next leg down, the trade is wrong and the trend has actually flipped. |
5. Trade Walkthrough
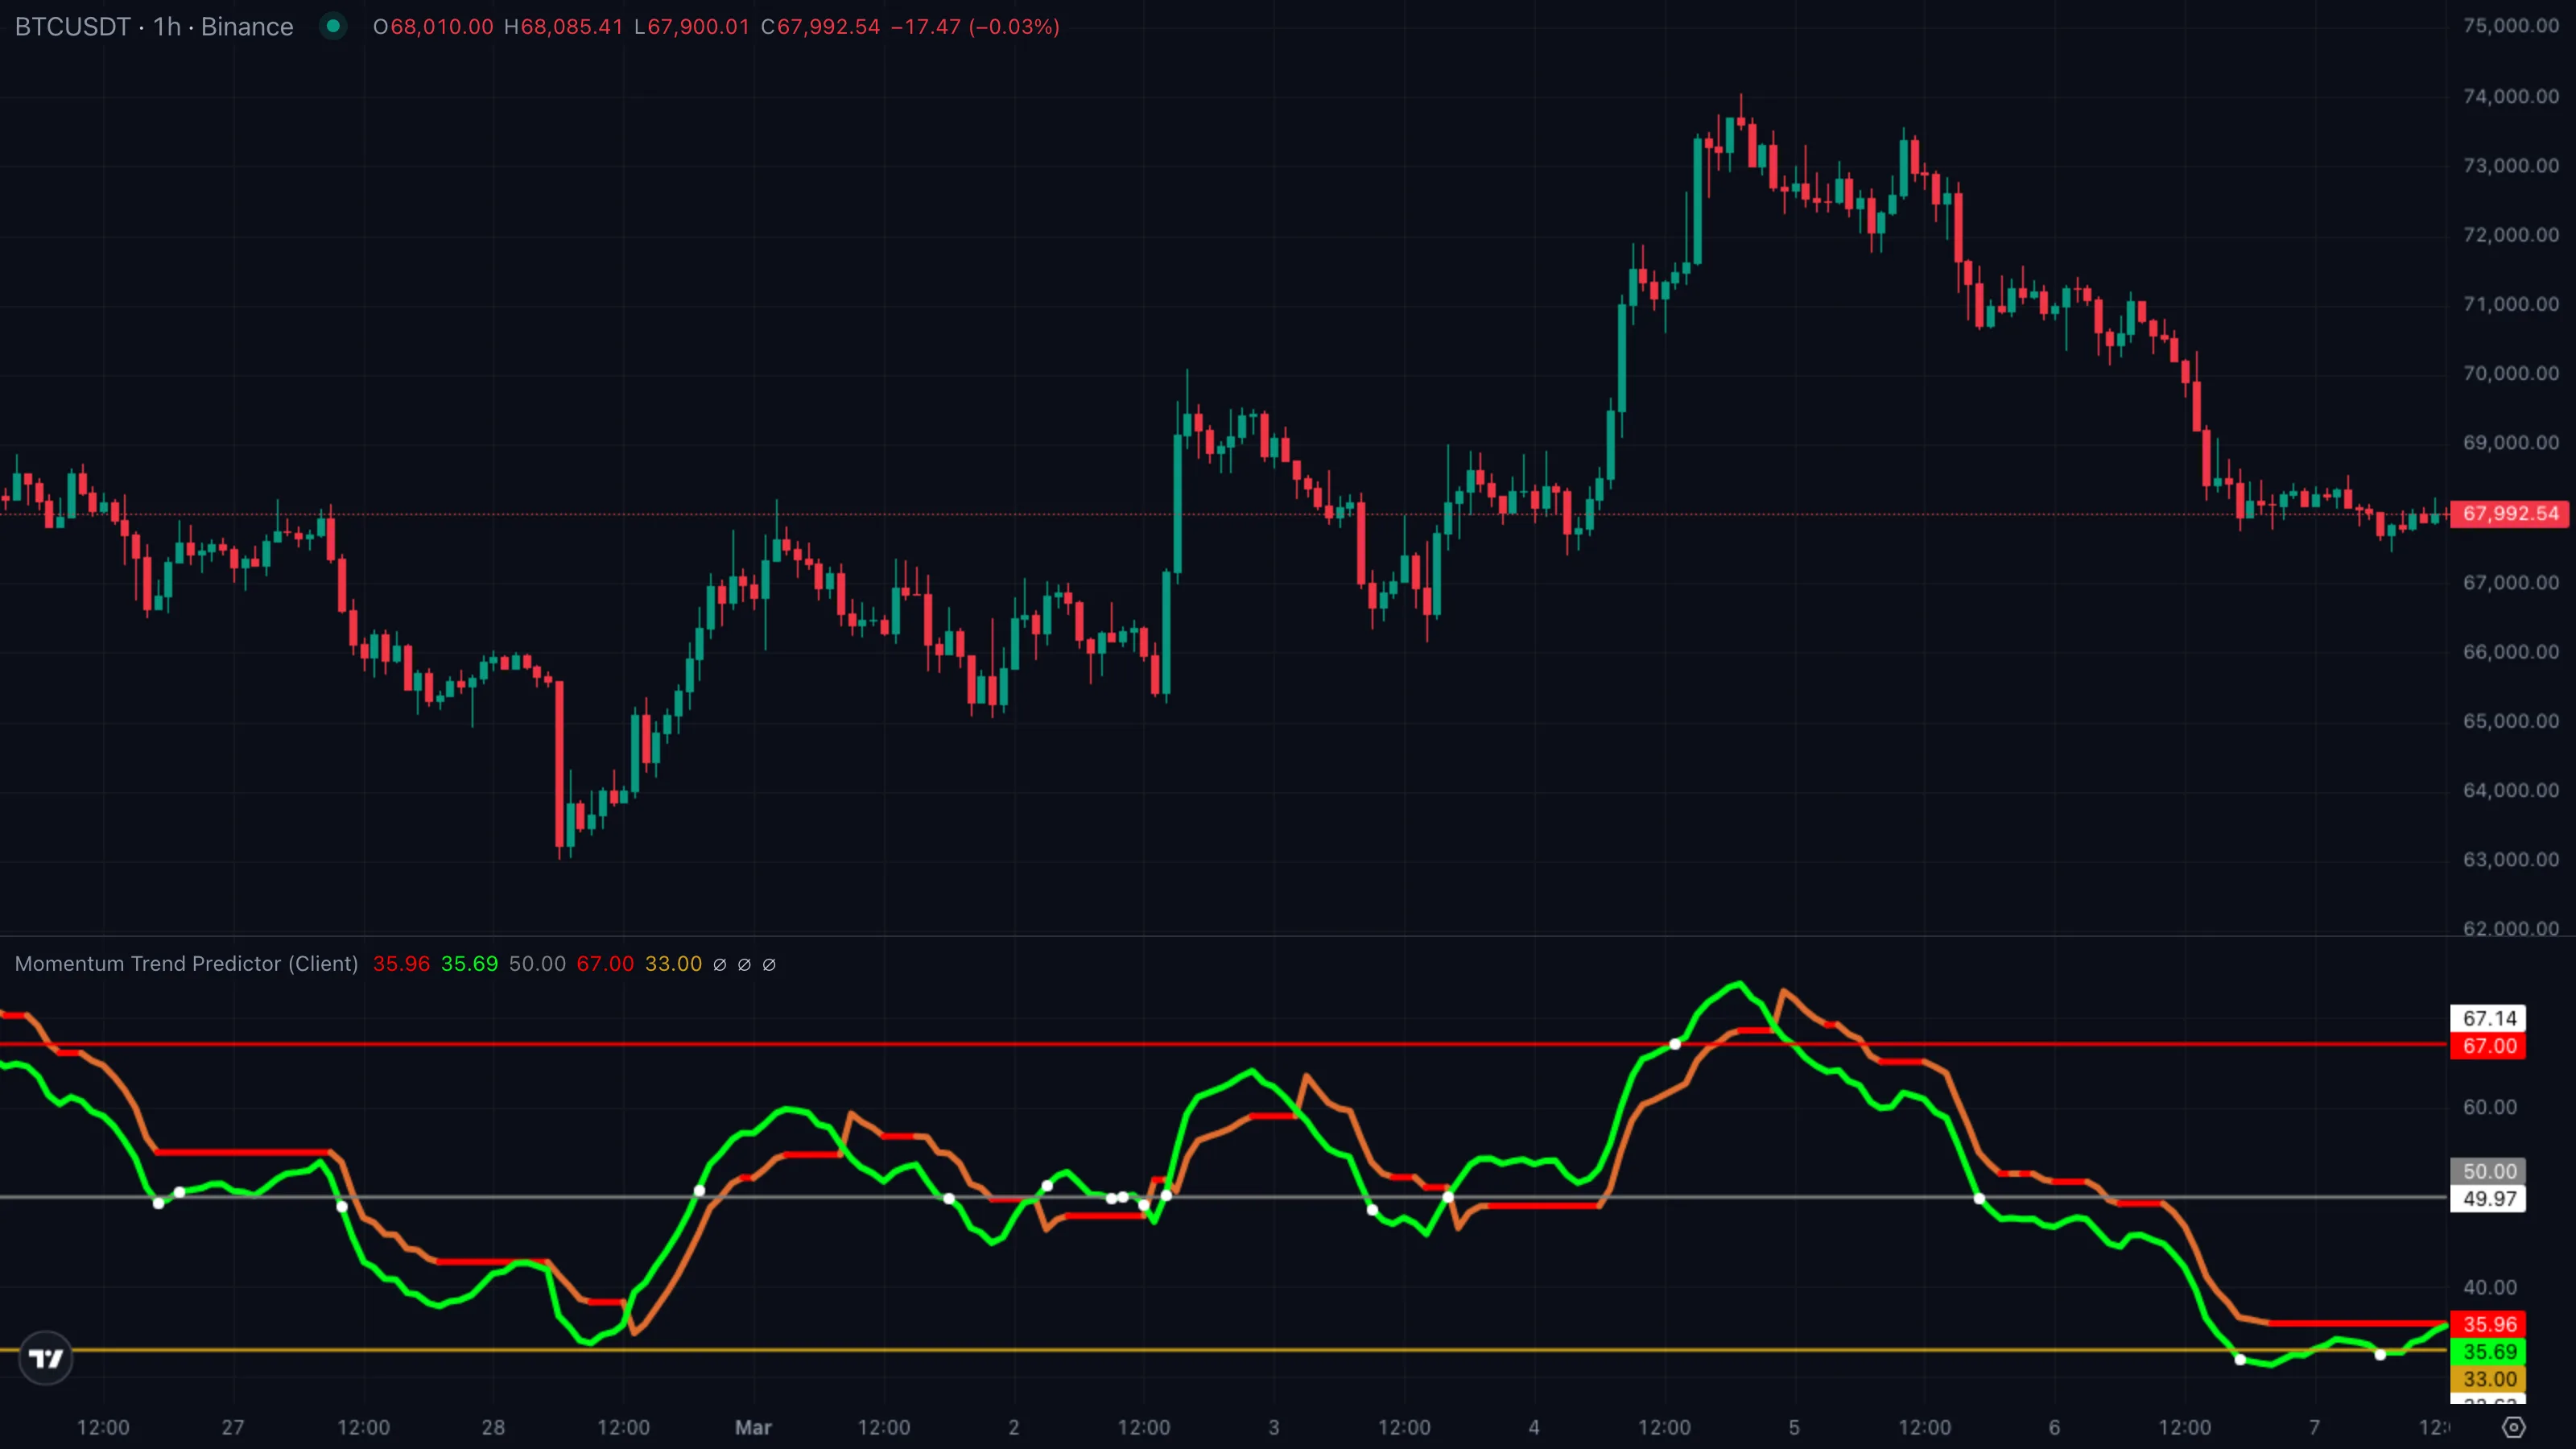
| Symbol | BTCUSDT |
|---|---|
| Timeframe | 1H |
| Venue | Binance |
| Window | 10 Mar to 22 Mar 2026 |
| Pattern | A — trailing band flips long, then C — pullbackPullback (Retracement)A short, counter-trend move within an established trend — buyers (or sellers) momentarily losing ground before the trend resumes. Often the lowest-risk place to enter the trend.Click for full definition → continuation |
A two-step setup. BTC sold off into early March and the indicator was sitting in a clean continuing-red state, with the trailing band well above the green line. On 13 March the green line punched up through the band — an orange transition bar — and the trade unfolded over the following week. The numbered markers ①–④ on the chart map to the four phases below.
The sequence
| # | When | BTC price | Indicator state | What it tells you |
|---|---|---|---|---|
| ① | 10 Mar to 12 Mar | ~$66,800 drifting to ~$65,400 | continuing red, green line under 33 | Downtrend mature, oversold reading building. No trade yet. |
| ② | 13 Mar | ~$67,100 close | flips green with orange transition bar, white dot at 50 | Pattern A trigger. Trailing band drops below the green line. The alert. |
| ③ | 15 Mar | ~$69,400 low on a pullbackPullback (Retracement)A short, counter-trend move within an established trend — buyers (or sellers) momentarily losing ground before the trend resumes. Often the lowest-risk place to enter the trend.Click for full definition → | continuing green, white dot at 33 zone | Pattern C continuation. Green line dips to the floor and recovers without a transition. The real entry. |
| ④ | 21 Mar | ~$76,500 high | continuing green fading, white dot at 67 | Momentum tags overbought without a flip. Cue to take profit before the next test. |
The trade in one card
| What you skipped | Market-buying the orange transition bar at 67,100 — the chase trade. The next two bars retraced into 65,800 and would have been stopped out. |
| What you took | PullbackPullback (Retracement)A short, counter-trend move within an established trend — buyers (or sellers) momentarily losing ground before the trend resumes. Often the lowest-risk place to enter the trend.Click for full definition → entry near $69,400 as the green line recovered off the 33 zone with no transition bar. |
| Where you exited | Green line tagging 67 near $76,500 with the band fading toward the line. |
| Move captured | ~ +10.2 % in roughly six days. |
Lesson
The orange transition bar gives you the alert. The first pullbackPullback (Retracement)A short, counter-trend move within an established trend — buyers (or sellers) momentarily losing ground before the trend resumes. Often the lowest-risk place to enter the trend.Click for full definition → that holds the floor zone, without flipping the band, gives you the trade. The overbought tag near 67 with the band fading tells you the move is tiring.
6. Common Pitfalls
- Treating every white dot as a signal. The three reversal markers (33, 50, 67 crosses) are context, not triggers. The actual trade signal is the orange transition bar — the moment the trailing band switches sides. A white dot without a band flip is almost always continuation, not reversal.
- Shorting the 67 cross in an uptrend. This is the classic RSIRelative Strength IndexA 0-to-100 momentum oscillator measuring the size of recent up-bars versus down-bars. Above 70 is hot, below 30 is cold, near 50 is neutral.Click for full definition → mistake imported into a better tool. The whole point of the trailing band is that it lets you stay long while momentum tags overbought. If the band has not flipped, the trend has not turned — overbought is just strength.
- Ignoring the colour difference between continuing and transition. A red bar that's been red for ten bars in a row is not the same signal as the bar where the colour first appears. The transition bar is rare and load-bearing; continuation bars are wallpaper.
- Using it on a 1m chart in thin sessions. The QQE-style envelope width is calibrated off the smoothed line's own recent range. On a 1m chart at 3 a.m. the envelope is microscopic and the band flips on every twitch. Stick to 15m or higher for execution; 1H or 4H for swing reads.
- Forgetting the pullbackPullback (Retracement)A short, counter-trend move within an established trend — buyers (or sellers) momentarily losing ground before the trend resumes. Often the lowest-risk place to enter the trend.Click for full definition → rule. The cleanest trades on this indicator are not the flips themselves — they are the first deep retrace after the flip that fails to reverse the trailing band. Buying the flip bar is permitted; waiting for the retrace pays better and risks less.