

Momentum Ultima Plus (MUP)
An all-in-one composite that fuses trend, momentum, and signal-strength readings into one colour-coded view, then prints Buy / Sell pills with risk-managed targets when every lens agrees.
1. What This Indicator Watches For
Traders end up stacking three or four indicators on a chart — a trend ribbon for direction, an RSIRelative Strength IndexA 0-to-100 momentum oscillator measuring the size of recent up-bars versus down-bars. Above 70 is hot, below 30 is cold, near 50 is neutral.Click for full definition → for momentum, a SupertrendSupertrendA trailing line set above or below price using an ATR multiple. When close crosses it, the line flips to the opposite side and signals a regime change.Click for full definition → for the trigger, a moving-average filter for confirmation. The chart turns into spaghetti and decisions get made by whichever line shouted loudest on the last bar.
The honest fix is to ask three questions in order: is the regime bullish or bearish, is momentum hot or cold, and did price actually break a level that matters? A real signal needs all three answers pointing the same way. A bullish ribbon with cooling momentum is a fade. A SupertrendSupertrendA trailing line set above or below price using an ATR multiple. When close crosses it, the line flips to the opposite side and signals a regime change.Click for full definition → flip with no trend behind it is a chop trap.
Momentum Ultima Plus asks those three questions at once and only prints a label when they agree. The ribbon paints the regime, the bar colour grades the momentum, and a SupertrendSupertrendA trailing line set above or below price using an ATR multiple. When close crosses it, the line flips to the opposite side and signals a regime change.Click for full definition → cross plus a moving-average filter decides when to fire. When every lens stacks, you get a Buy or Strong Buy pill with stop and target levels already drawn.
2. How It Works Under the Hood
Three engines run in parallel and the chart shows you a fused output:
- The Trend Ribbon — a fast SMASimple Moving AverageThe plain arithmetic mean of the last N closing prices. Reacts slower than an EMA of the same length because every bar in the window has equal weight.Click for full definition → (length 21, the "candle" line) and a slow SMASimple Moving AverageThe plain arithmetic mean of the last N closing prices. Reacts slower than an EMA of the same length because every bar in the window has equal weight.Click for full definition → (length 34, the "reach" line). The fill between them turns translucent green when the fast sits above the slow and red when it sits below. Regime lens.
- The RSIRelative Strength IndexA 0-to-100 momentum oscillator measuring the size of recent up-bars versus down-bars. Above 70 is hot, below 30 is cold, near 50 is neutral.Click for full definition → Gradient Bars — every bar is recoloured by where RSIRelative Strength IndexA 0-to-100 momentum oscillator measuring the size of recent up-bars versus down-bars. Above 70 is hot, below 30 is cold, near 50 is neutral.Click for full definition → sits in a 60-step palette. Deep red near RSIRelative Strength IndexA 0-to-100 momentum oscillator measuring the size of recent up-bars versus down-bars. Above 70 is hot, below 30 is cold, near 50 is neutral.Click for full definition → 20, hot pink through purple in the 30s and 40s, blue-grey at 50, brightening to lime as RSIRelative Strength IndexA 0-to-100 momentum oscillator measuring the size of recent up-bars versus down-bars. Above 70 is hot, below 30 is cold, near 50 is neutral.Click for full definition → pushes 70 and beyond. Momentum lens, embedded into the candles themselves.
- The Signal Engine — a SupertrendSupertrendA trailing line set above or below price using an ATR multiple. When close crosses it, the line flips to the opposite side and signals a regime change.Click for full definition → (factor 4, ATRAverage True RangeA measure of typical bar-to-bar volatility. ATR rises when bars get bigger; many indicators use it as a noise floor — they only fire when a move clears a multiple of ATR.Click for full definition → length 11) gives the cross trigger; an SMASimple Moving AverageThe plain arithmetic mean of the last N closing prices. Reacts slower than an EMA of the same length because every bar in the window has equal weight.Click for full definition → (length 13) confirms price has held the right side of the recent average. A second pair of very-short SMAs (lengths 8 and 9) decides whether to upgrade the label to Strong.
The "Strong" upgrade is the key detail. It fires when the very-short SMAs are still pointed against the new trade direction at the moment of the cross. Counter-intuitive but useful: price has reversed hard enough to flip the SupertrendSupertrendA trailing line set above or below price using an ATR multiple. When close crosses it, the line flips to the opposite side and signals a regime change.Click for full definition → before the shortest averages catch up. Once they do, the easy part of the move is usually gone.
How MUP picks its label. Every bar runs three checks in order:
- Did price cross the SupertrendSupertrendA trailing line set above or below price using an ATR multiple. When close crosses it, the line flips to the opposite side and signals a regime change.Click for full definition →? No cross, no label, ever.
- Is price on the right side of the SMASimple Moving AverageThe plain arithmetic mean of the last N closing prices. Reacts slower than an EMA of the same length because every bar in the window has equal weight.Click for full definition →(13)? A bullish cross that closes below SMASimple Moving AverageThe plain arithmetic mean of the last N closing prices. Reacts slower than an EMA of the same length because every bar in the window has equal weight.Click for full definition →(13) is rejected as a fakeout. Same in reverse.
- Are the very-short SMAs lagging or leading? SMASimple Moving AverageThe plain arithmetic mean of the last N closing prices. Reacts slower than an EMA of the same length because every bar in the window has equal weight.Click for full definition →(8) still below SMASimple Moving AverageThe plain arithmetic mean of the last N closing prices. Reacts slower than an EMA of the same length because every bar in the window has equal weight.Click for full definition →(9) at a buy cross upgrades to Strong Buy. Already above, label stays Buy because part of the move is priced in.
| What you're seeing | Pill | Plain English |
|---|---|---|
| Cross up, close above SMASimple Moving AverageThe plain arithmetic mean of the last N closing prices. Reacts slower than an EMA of the same length because every bar in the window has equal weight.Click for full definition →(13), short SMAs still bearish | 🟢 Strong Buy | All signals stack bullish, early in the move |
| Cross up, close above SMASimple Moving AverageThe plain arithmetic mean of the last N closing prices. Reacts slower than an EMA of the same length because every bar in the window has equal weight.Click for full definition →(13), short SMAs already bullish | 🟢 Buy | Bullish but late, part of the move is gone |
| Cross with no SMASimple Moving AverageThe plain arithmetic mean of the last N closing prices. Reacts slower than an EMA of the same length because every bar in the window has equal weight.Click for full definition →(13) confirmation | 🟡 No label | Mixed signals, no edge, stand aside |
| Cross down, close below SMASimple Moving AverageThe plain arithmetic mean of the last N closing prices. Reacts slower than an EMA of the same length because every bar in the window has equal weight.Click for full definition →(13), short SMAs already bearish | 🔴 Sell | Bearish but late |
| Cross down, close below SMASimple Moving AverageThe plain arithmetic mean of the last N closing prices. Reacts slower than an EMA of the same length because every bar in the window has equal weight.Click for full definition →(13), short SMAs still bullish | 🔴 Strong Sell | Stacked bearish reversal, early in the move |
That triple-check is what keeps the indicator disciplined in chop. Any one fail kills the label.
3. What You See on the Chart
| Element | Looks like | Means |
|---|---|---|
| Bar colour | Each candle tinted from deep red through purple, blue, and green to bright lime | RSIRelative Strength IndexA 0-to-100 momentum oscillator measuring the size of recent up-bars versus down-bars. Above 70 is hot, below 30 is cold, near 50 is neutral.Click for full definition → tier of that bar — red below 30, cool blue near 50, hot green above 70 |
| Trend Ribbon | Translucent green or red band hugging price | Fast SMASimple Moving AverageThe plain arithmetic mean of the last N closing prices. Reacts slower than an EMA of the same length because every bar in the window has equal weight.Click for full definition →(21) versus slow SMASimple Moving AverageThe plain arithmetic mean of the last N closing prices. Reacts slower than an EMA of the same length because every bar in the window has equal weight.Click for full definition →(34), green when fast is above |
| Buy pill | Bright green tag below a bar reading "Buy" | Confirmed bullish cross, momentum already turning |
| Strong Buy pill | Same green tag reading "Strong Buy" | Confirmed bullish cross while short SMAs still lagging — early-cycle entry |
| Sell pill | Bright red tag above a bar reading "Sell" | Confirmed bearish cross, momentum already cooling |
| Strong Sell pill | Same red tag reading "Strong Sell" | Confirmed bearish cross while short SMAs still leading up — early-cycle reversal |
| Peak Profit label | Faded green or red marker after a pill | Best unrealised profit reached on the open trade so far |
| Risk levels (toggle) | Entry, SL, and 1RRisk Multiple (R)The distance from entry to stop expressed as one unit of risk. 1R = stop distance, 2R = twice stop distance.Click for full definition → / 2RRisk Multiple (R)The distance from entry to stop expressed as one unit of risk. 1R = stop distance, 2R = twice stop distance.Click for full definition → / 3RRisk Multiple (R)The distance from entry to stop expressed as one unit of risk. 1R = stop distance, 2R = twice stop distance.Click for full definition → lines drawn from the active pill | Stop sits one ATRAverage True RangeA measure of typical bar-to-bar volatility. ATR rises when bars get bigger; many indicators use it as a noise floor — they only fire when a move clears a multiple of ATR.Click for full definition →(14) beyond the signal bar's wick, targets stack at 1, 2, and 3 times that risk |
Pills sit at the level of the signal bar's high or low so they never overlap price.
4. Reading It in 3 Patterns
Pattern A — All signals stack bullish
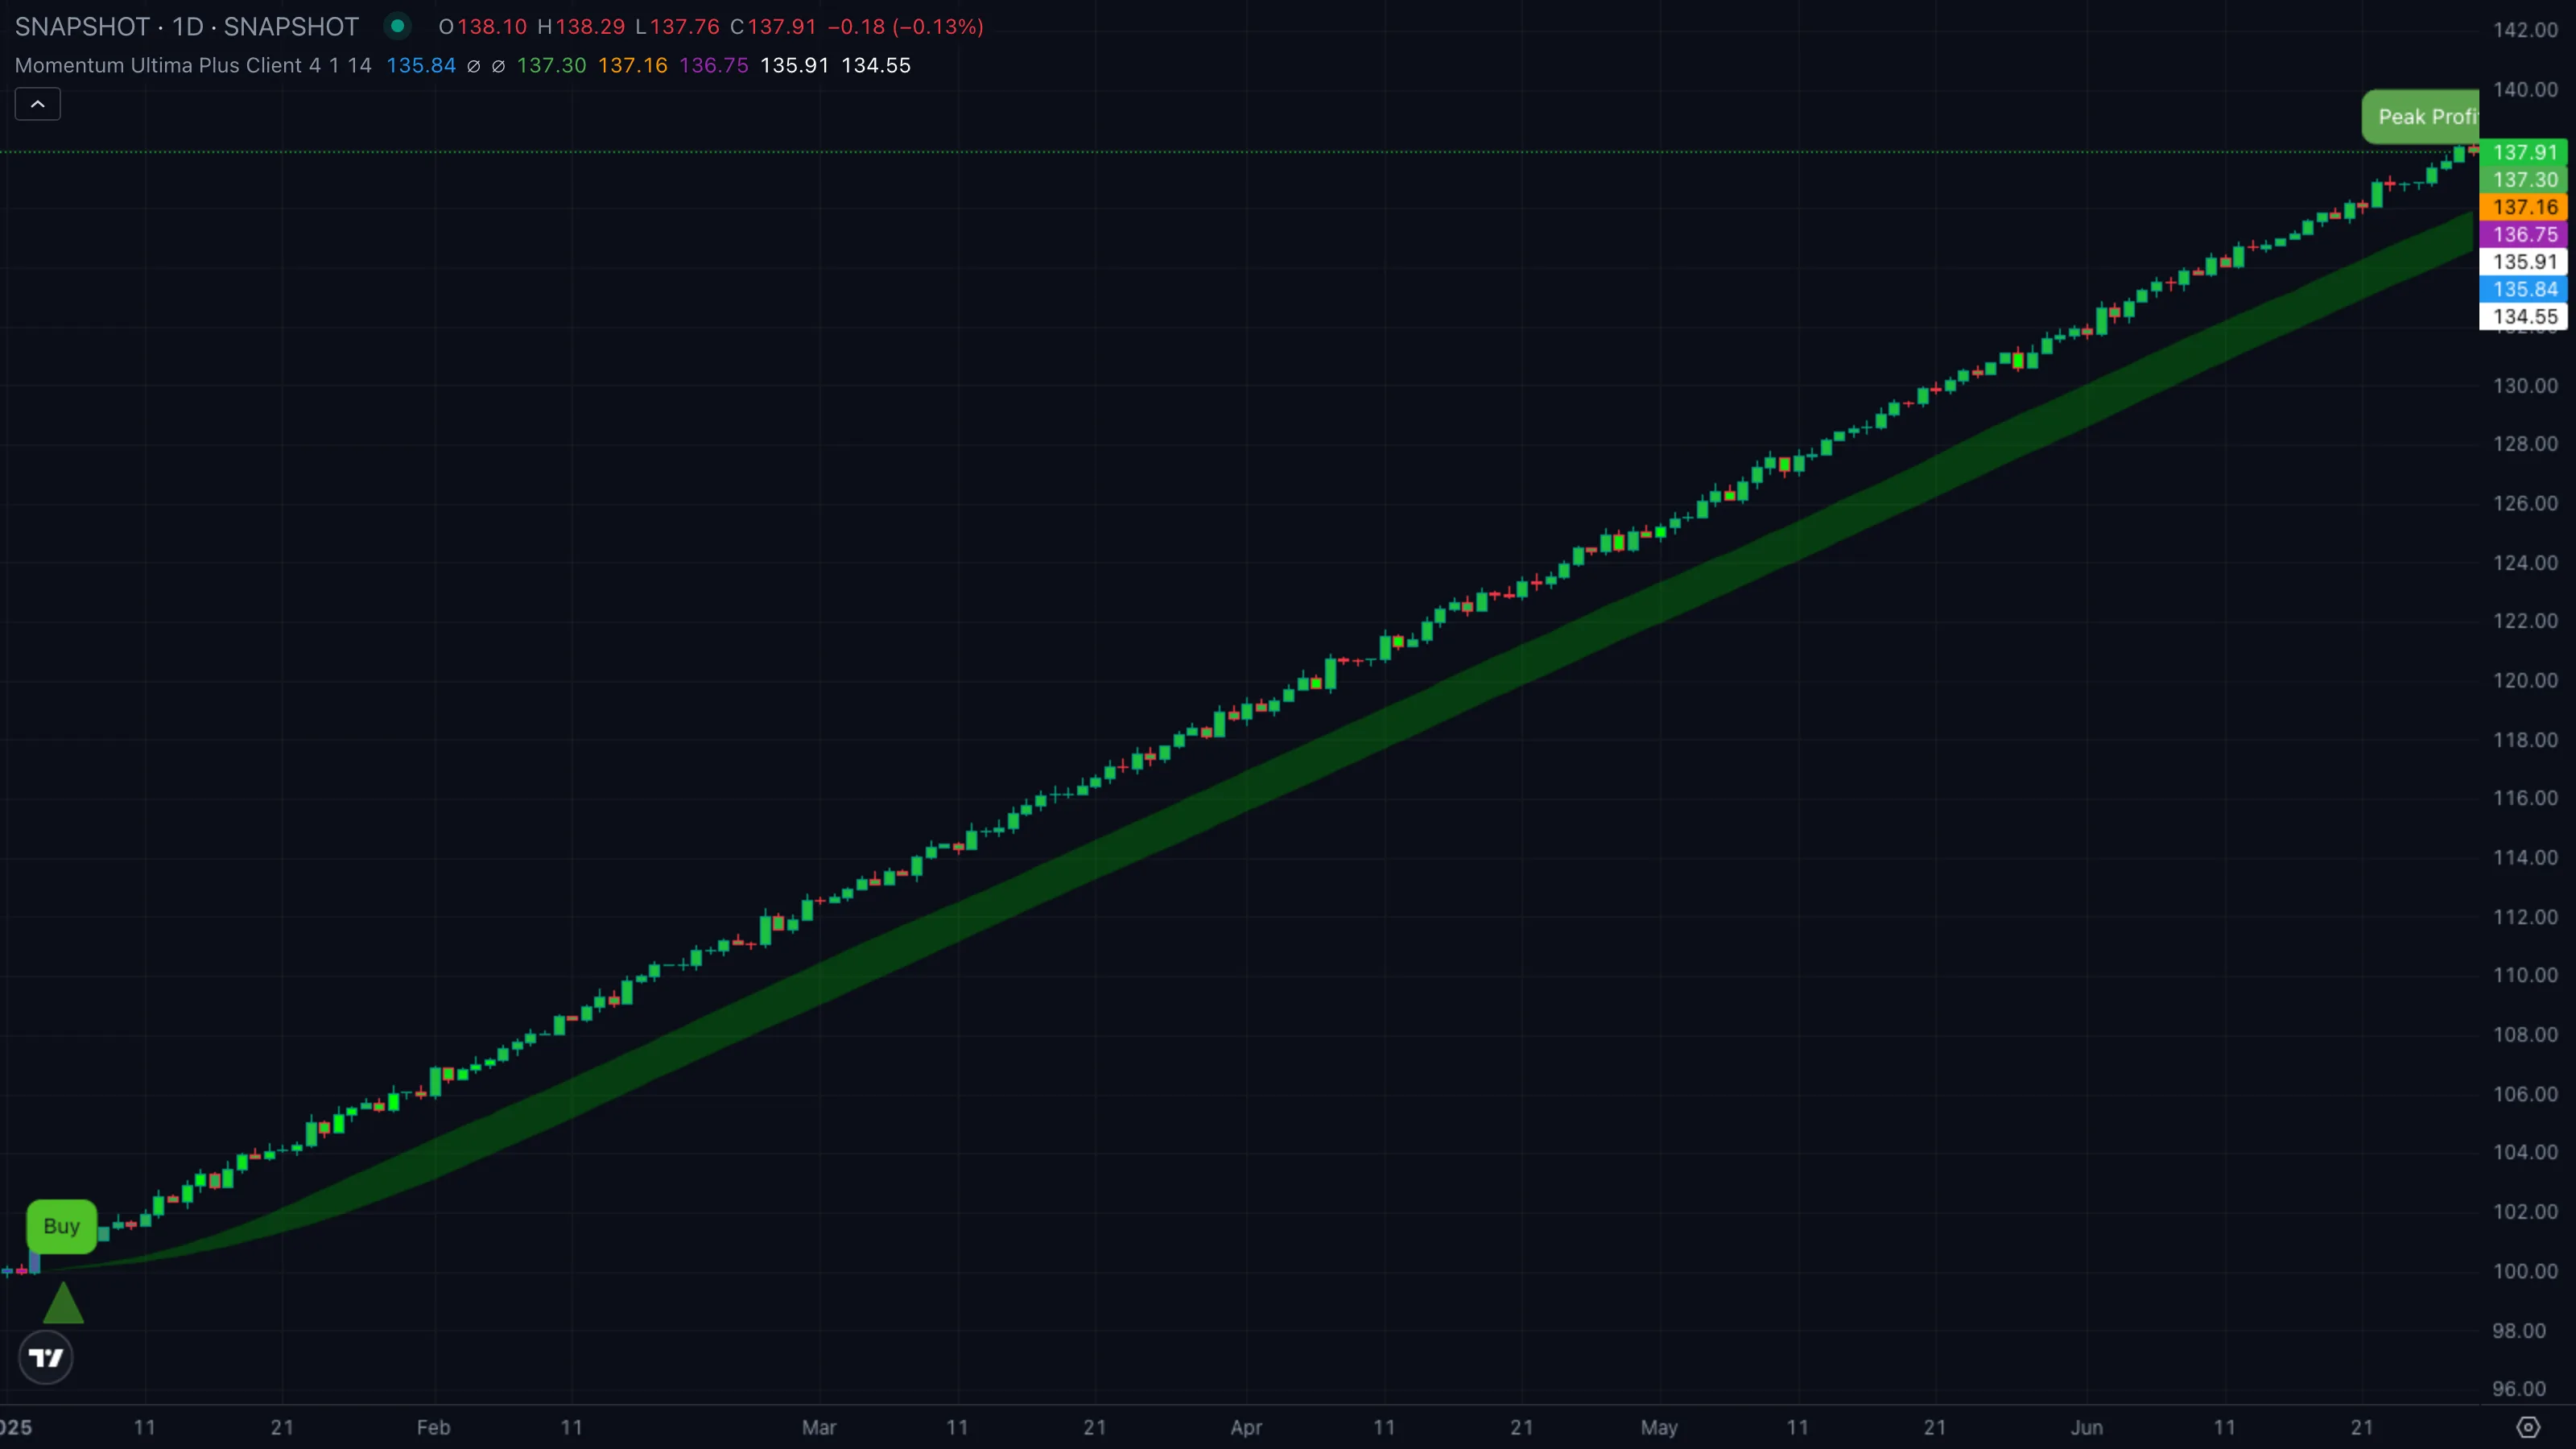
| What you see | ① Bars shift from blue-grey to bright green as RSIRelative Strength IndexA 0-to-100 momentum oscillator measuring the size of recent up-bars versus down-bars. Above 70 is hot, below 30 is cold, near 50 is neutral.Click for full definition → runs hot ② trend ribbon turns translucent green and stays there ③ a Strong Buy pill prints under the breakout bar with risk levels drawn. |
| What it means | Every lens points the same way. Regime is bullish, momentum is hot, the SupertrendSupertrendA trailing line set above or below price using an ATR multiple. When close crosses it, the line flips to the opposite side and signals a regime change.Click for full definition → just confirmed with SMASimple Moving AverageThe plain arithmetic mean of the last N closing prices. Reacts slower than an EMA of the same length because every bar in the window has equal weight.Click for full definition → backing. The "Strong" tag means short averages haven't caught up yet, so there's room to run. |
| What to do | Bias long. Take the pill or wait for the first pullbackPullback (Retracement)A short, counter-trend move within an established trend — buyers (or sellers) momentarily losing ground before the trend resumes. Often the lowest-risk place to enter the trend.Click for full definition → into the slow SMASimple Moving AverageThe plain arithmetic mean of the last N closing prices. Reacts slower than an EMA of the same length because every bar in the window has equal weight.Click for full definition → while bars stay green. Don't fade — when MUP stacks, fades get steamrolled. |
Pattern B — Mixed signals, no edge
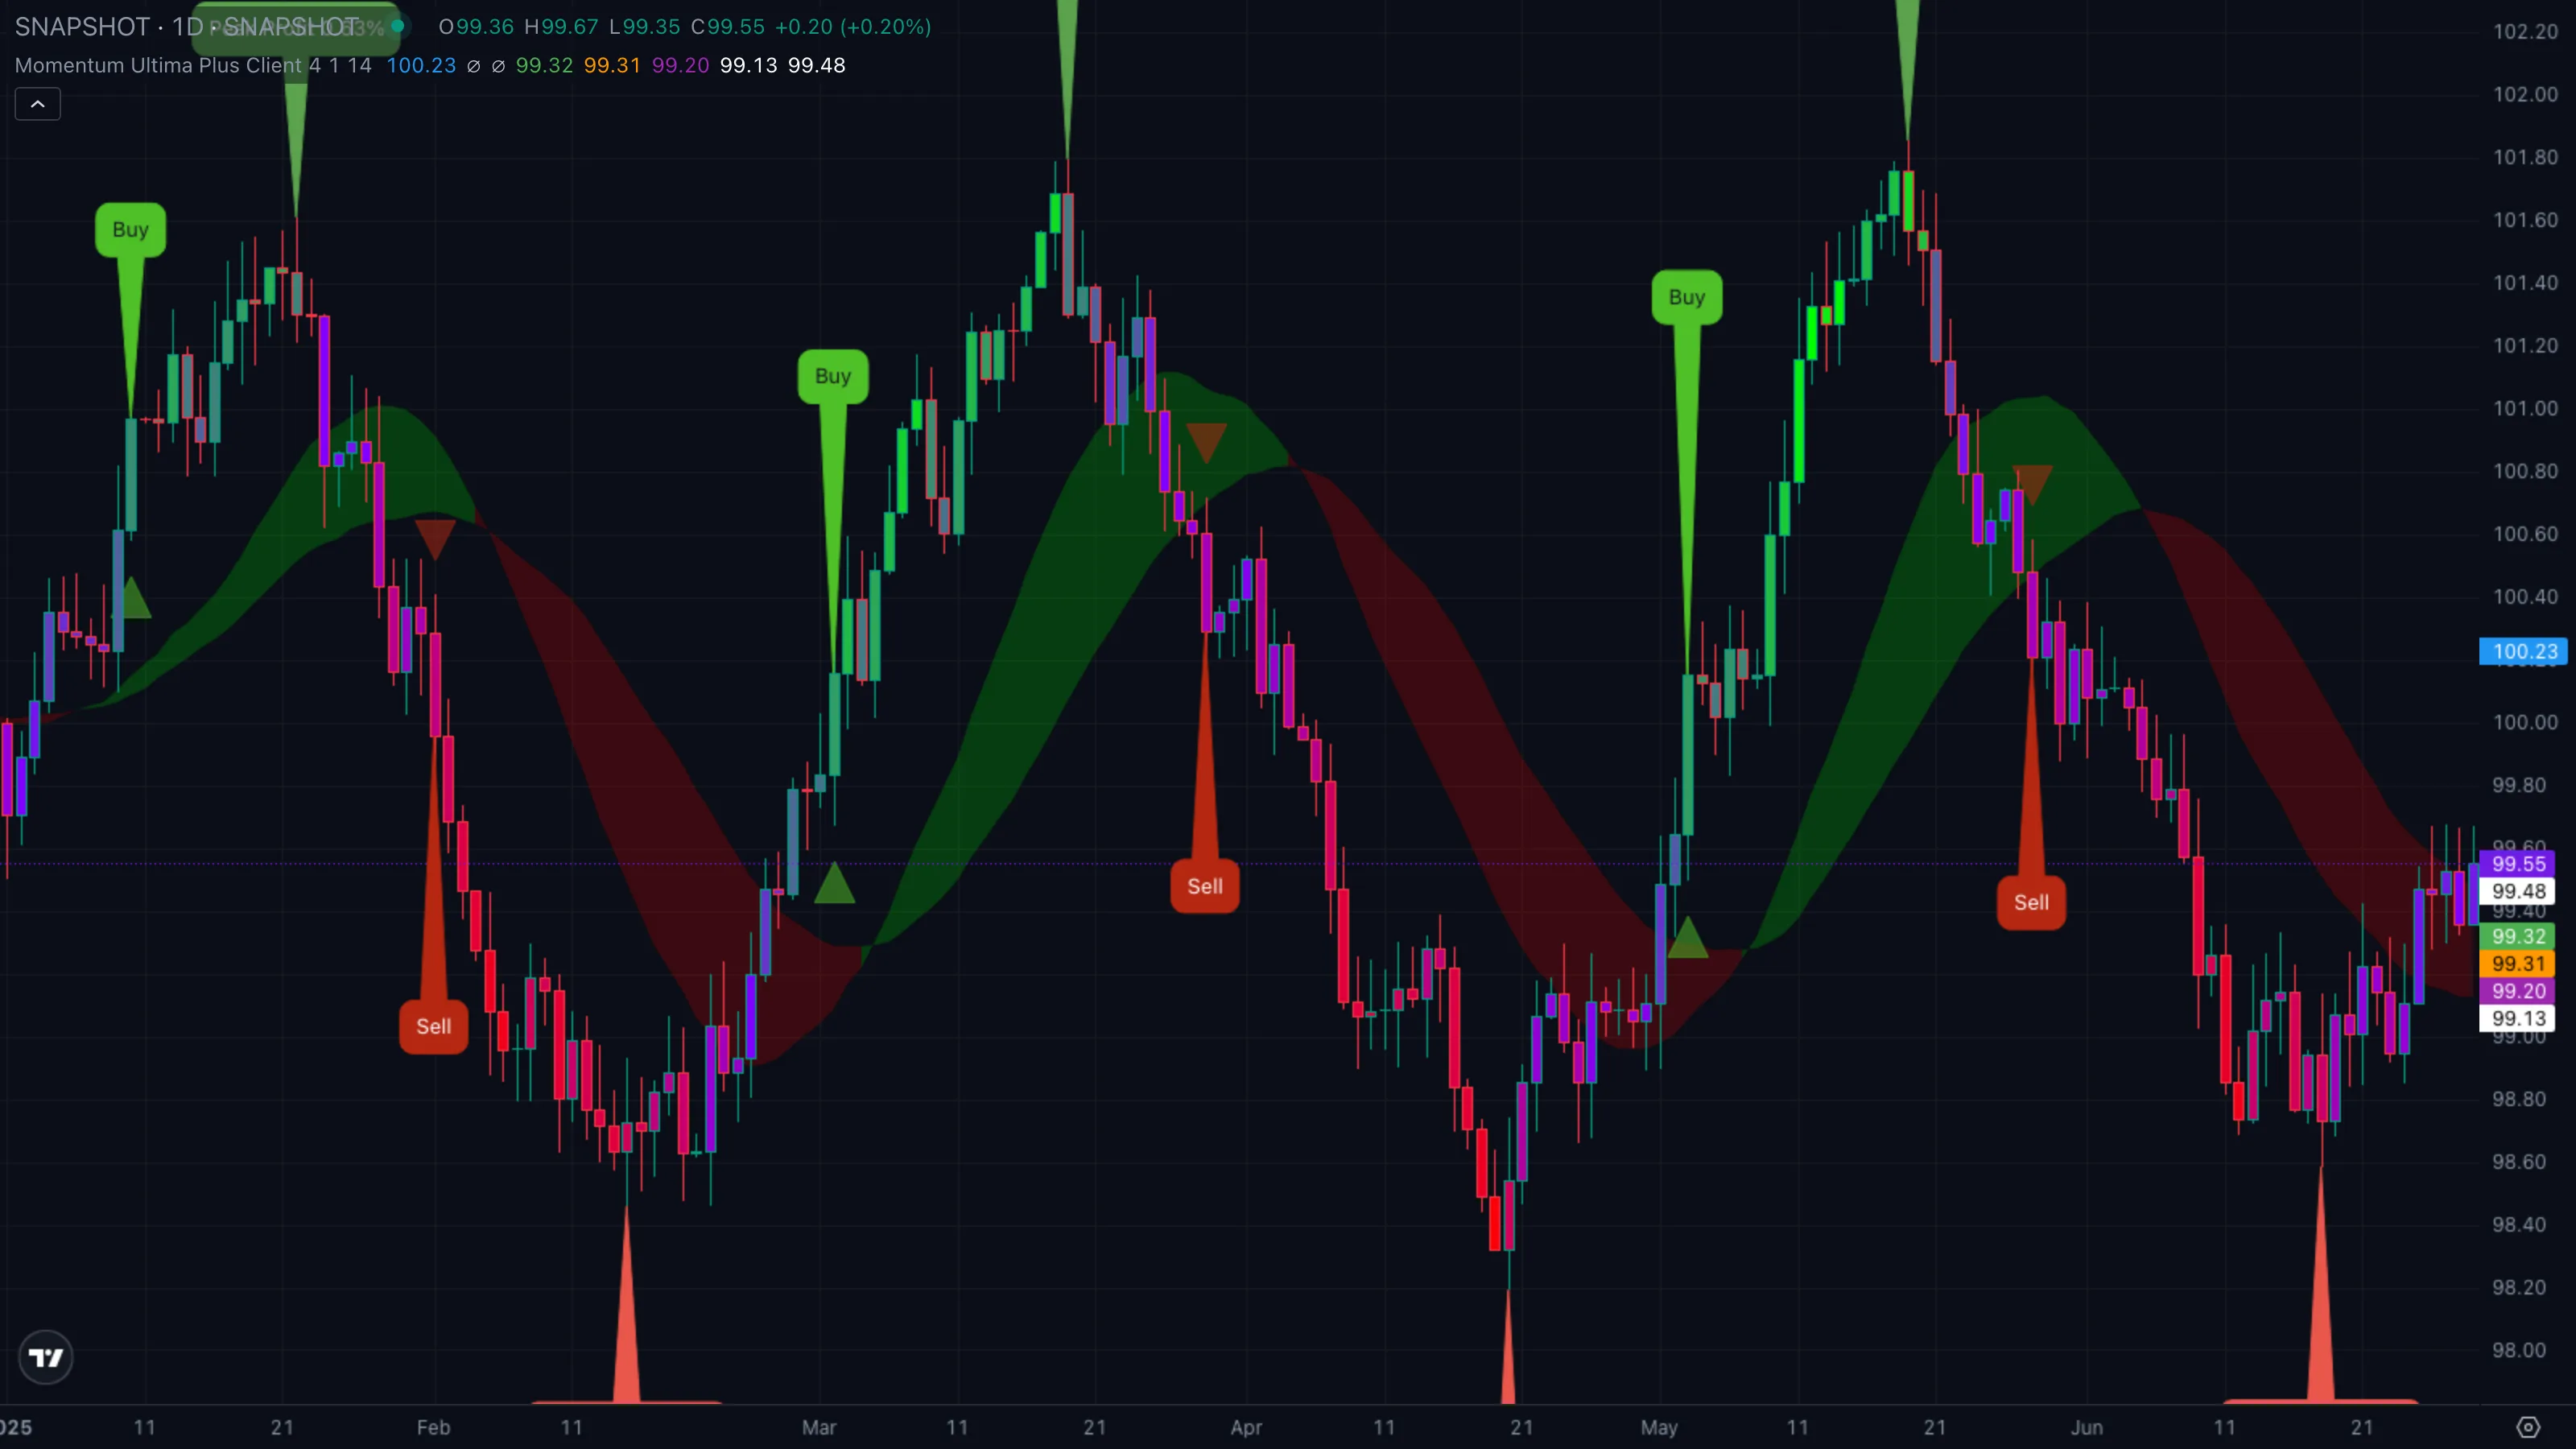
| What you see | ① Bars cycle between cool blue and pale red without ever reaching the extremes ② trend ribbon flickers green-red-green over a few bars ③ no pill prints, or one prints and immediately reverses. |
| What it means | The lenses disagree. SupertrendSupertrendA trailing line set above or below price using an ATR multiple. When close crosses it, the line flips to the opposite side and signals a regime change.Click for full definition → may flip but SMASimple Moving AverageThe plain arithmetic mean of the last N closing prices. Reacts slower than an EMA of the same length because every bar in the window has equal weight.Click for full definition →(13) rejects it as a fakeout, or RSIRelative Strength IndexA 0-to-100 momentum oscillator measuring the size of recent up-bars versus down-bars. Above 70 is hot, below 30 is cold, near 50 is neutral.Click for full definition → sits dead in the chop zone while the ribbon flutters. MUP is explicitly telling you there's no composite signal here. |
| What to do | Stand aside. Wait for bar colours to commit to one end of the spectrum and the ribbon to settle. |
Pattern C — Stacked bearish reversal
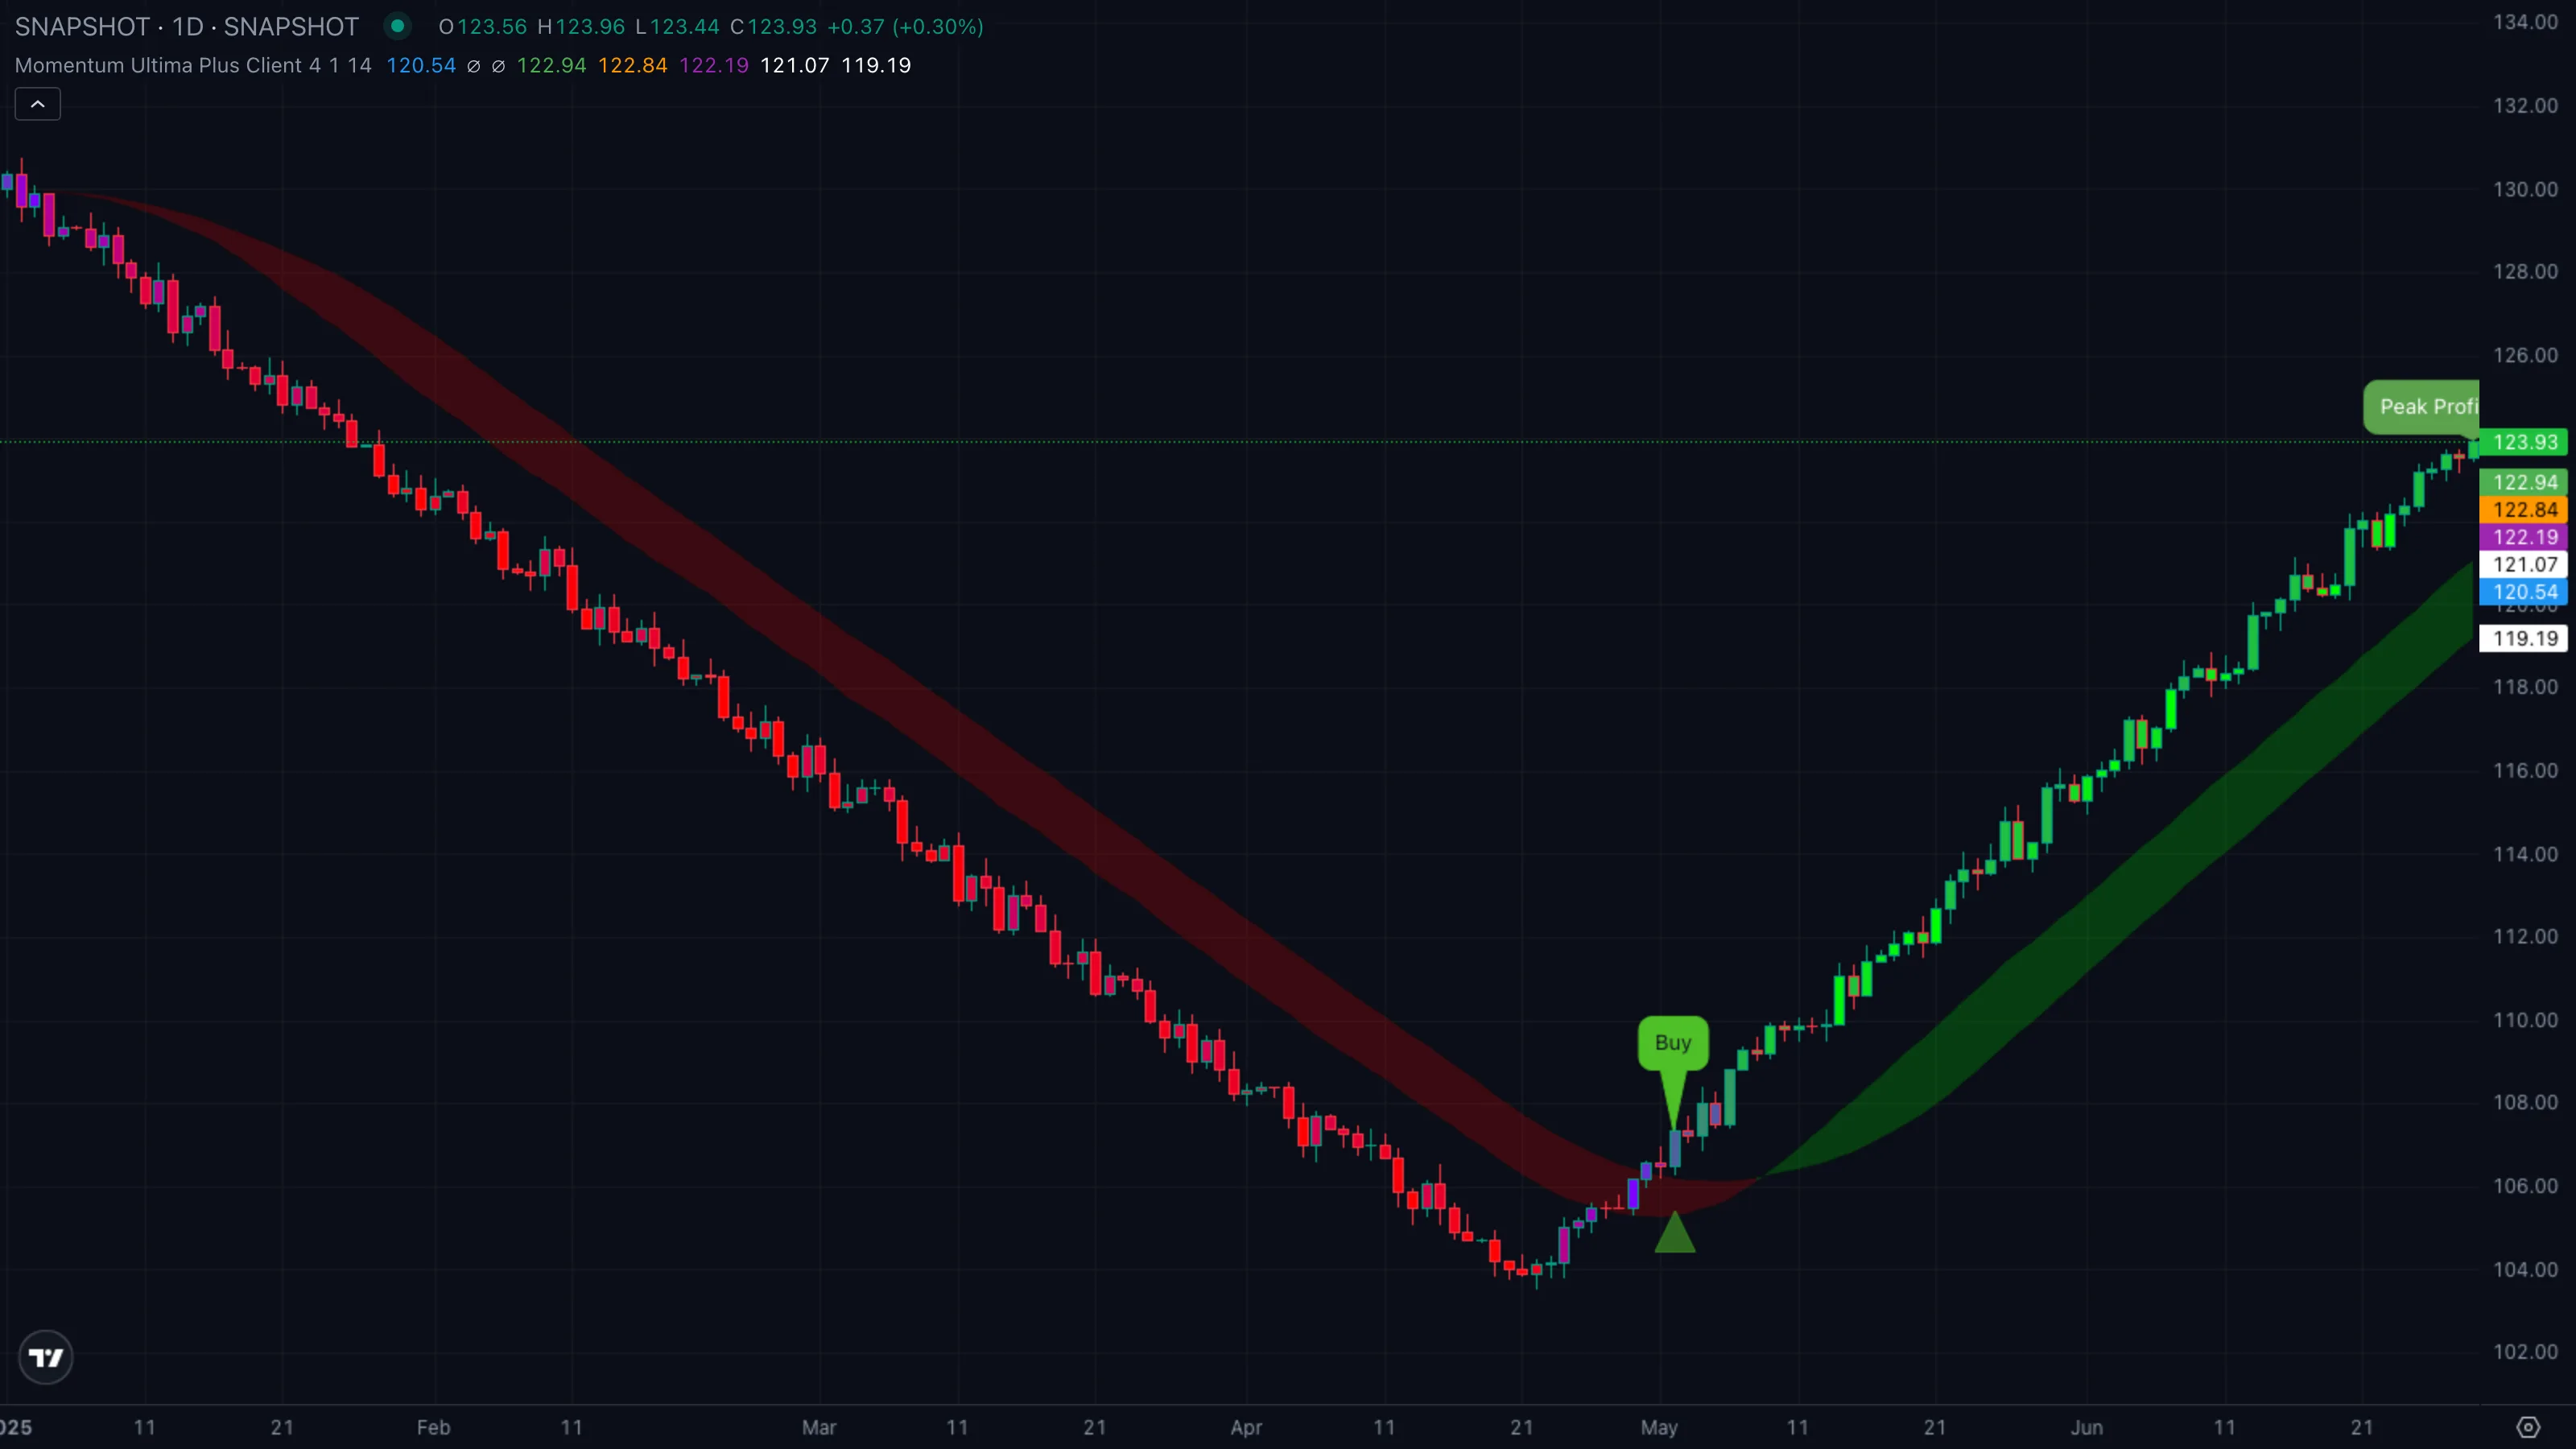
| What you see | ① Bars fade from lime through blue-grey into deep purple and red as RSIRelative Strength IndexA 0-to-100 momentum oscillator measuring the size of recent up-bars versus down-bars. Above 70 is hot, below 30 is cold, near 50 is neutral.Click for full definition → rolls over ② trend ribbon flips green to red beneath a topping range ③ a Strong Sell pill prints with stop above the swing highSwing High and Swing LowThe most recent confirmed pivot in either direction. Swing highs cap rallies until broken; swing lows support pullbacks until broken.Click for full definition → and target lines below. |
| What it means | A trend transition is happening in real time and all three lenses confirm. Bullish momentum has unwound, regime has flipped, and the SupertrendSupertrendA trailing line set above or below price using an ATR multiple. When close crosses it, the line flips to the opposite side and signals a regime change.Click for full definition → just broke down with SMASimple Moving AverageThe plain arithmetic mean of the last N closing prices. Reacts slower than an EMA of the same length because every bar in the window has equal weight.Click for full definition →(13) backing. |
| What to do | Wait for the first bounce after the pill into the slow SMASimple Moving AverageThe plain arithmetic mean of the last N closing prices. Reacts slower than an EMA of the same length because every bar in the window has equal weight.Click for full definition → or the underside of the now-red ribbon. Bounces give cleaner risk than shorting the pill bar itself. |
5. Trade Walkthrough
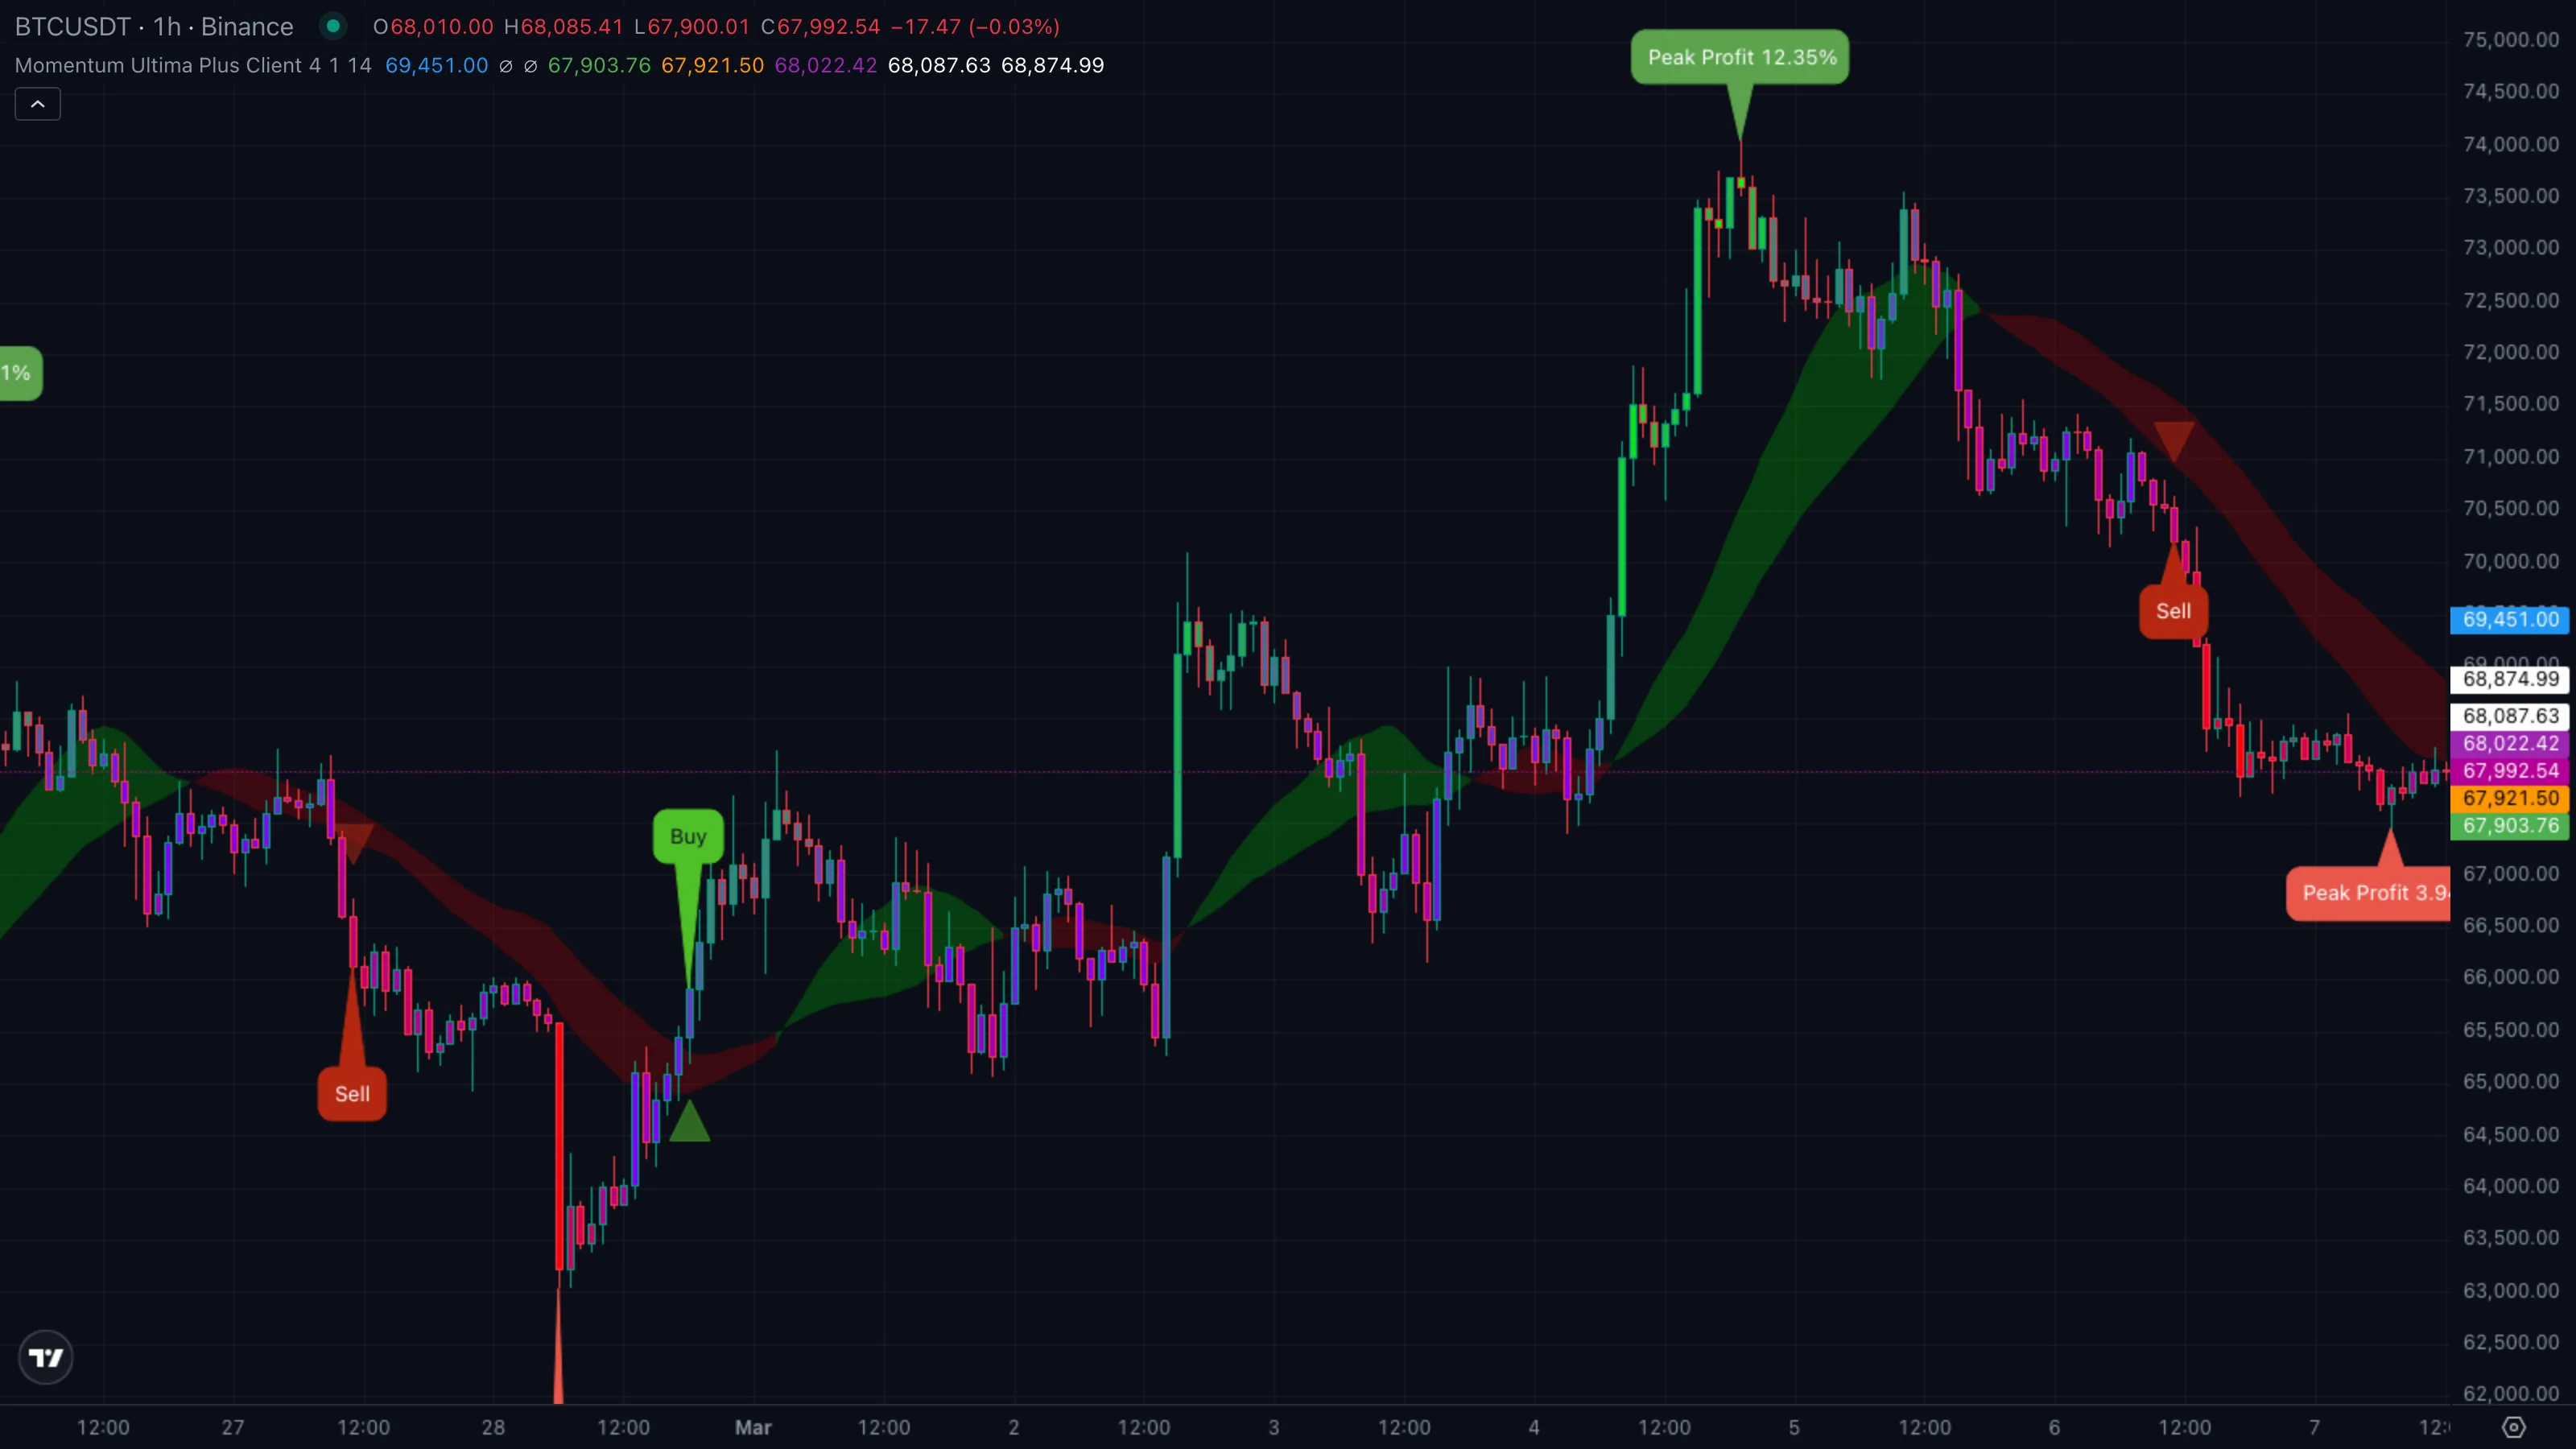
| Symbol | BTCUSDT |
|---|---|
| Timeframe | 1H |
| Venue | Binance |
| Window | 1 Mar to 9 Mar 2026 |
| Pattern | C — stacked bearish reversal |
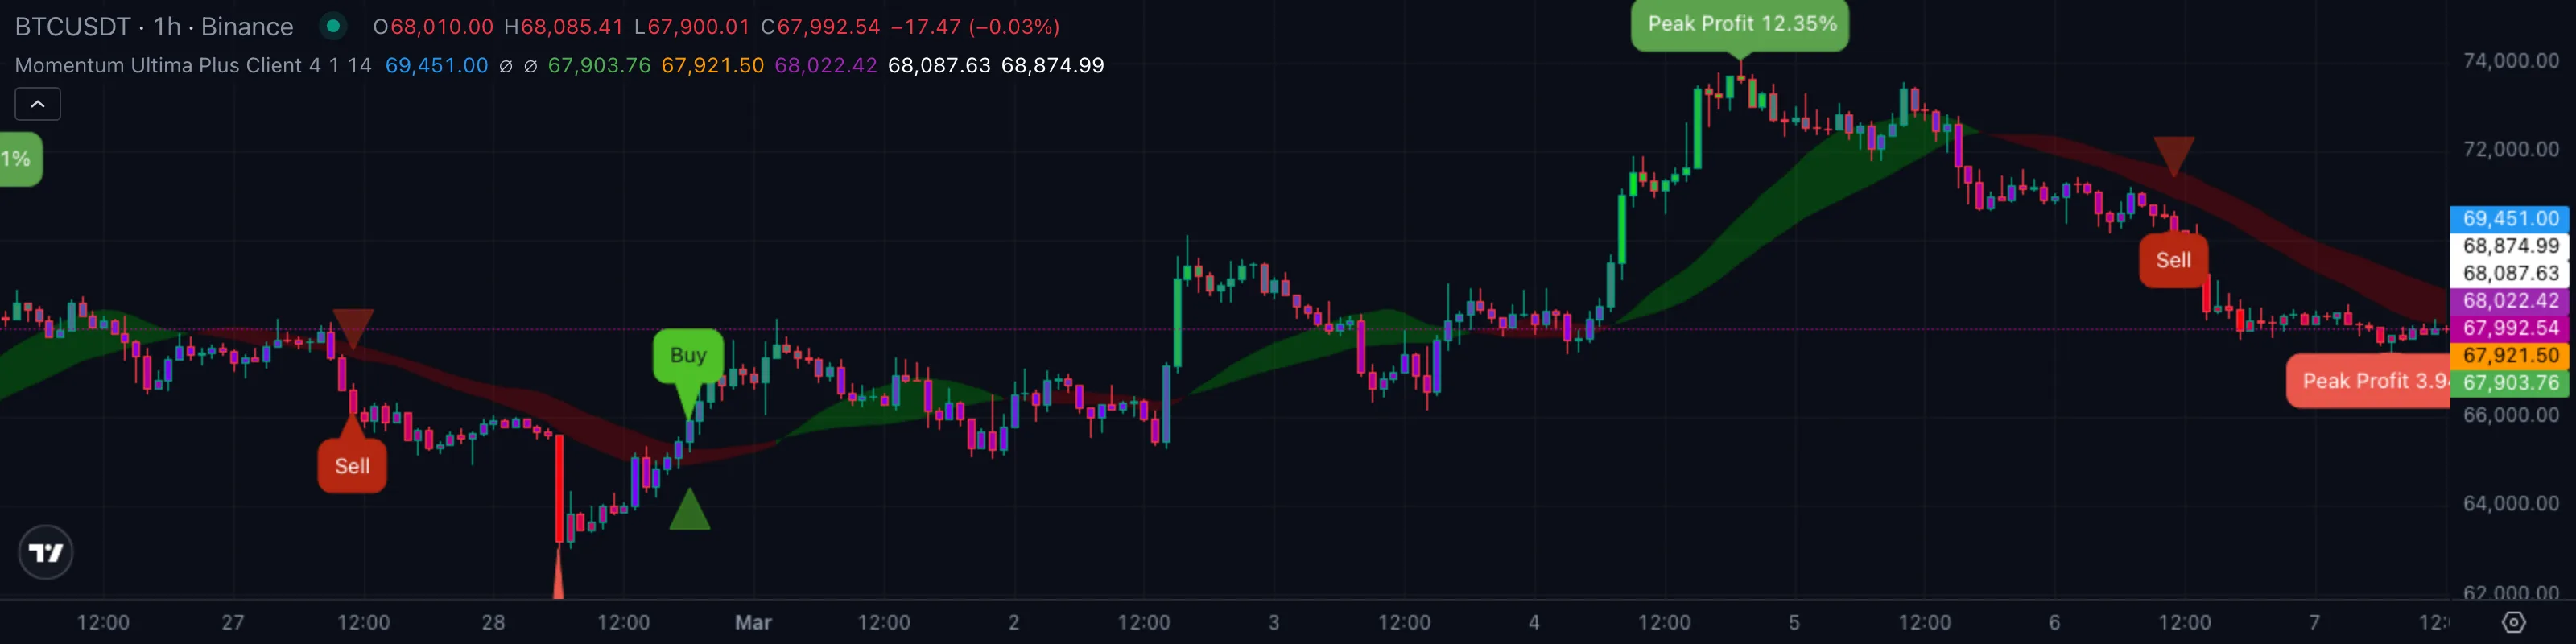
A textbook composite reversal. BTC ground higher into the 74,000s through the first week of March 2026 with bar colours steadily heating into bright green, then ran out of buyers, faded through blue, and printed a clean Strong Sell into the descent. Markers ①–④ on the chart map to the four phases of the trade below.
The sequence
| # | When | BTC price | Indicator state | What it tells you |
|---|---|---|---|---|
| ① | 1 Mar to 4 Mar | 70,500 to 74,200 grind | bars green, ribbon green | All lenses bullish. No reason to fade. |
| ② | 5 Mar | ~73,400 close | bars cool to blue, RSIRelative Strength IndexA 0-to-100 momentum oscillator measuring the size of recent up-bars versus down-bars. Above 70 is hot, below 30 is cold, near 50 is neutral.Click for full definition → rolling | Momentum lens flipping first. Heads-up for the regime to follow. |
| ③ | 5 Mar | ~72,800 close | Strong Sell pill | Pattern C trigger. SupertrendSupertrendA trailing line set above or below price using an ATR multiple. When close crosses it, the line flips to the opposite side and signals a regime change.Click for full definition → breaks down, SMASimple Moving AverageThe plain arithmetic mean of the last N closing prices. Reacts slower than an EMA of the same length because every bar in the window has equal weight.Click for full definition →(13) confirms, short SMAs still leading up. The real entry on the next bounce. |
| ④ | 7 Mar | ~67,200 low | bars deep red, ribbon red | Move tiring near 1RRisk Multiple (R)The distance from entry to stop expressed as one unit of risk. 1R = stop distance, 2R = twice stop distance.Click for full definition →-to-2RRisk Multiple (R)The distance from entry to stop expressed as one unit of risk. 1R = stop distance, 2R = twice stop distance.Click for full definition → targets. Cue to take profit before the bounce starts. |
The trade in one card
| What you skipped | Shorting the top at 74,200 with no confirmation. Would have been stopped on the next push. |
| What you took | PullbackPullback (Retracement)A short, counter-trend move within an established trend — buyers (or sellers) momentarily losing ground before the trend resumes. Often the lowest-risk place to enter the trend.Click for full definition → into the slow SMASimple Moving AverageThe plain arithmetic mean of the last N closing prices. Reacts slower than an EMA of the same length because every bar in the window has equal weight.Click for full definition → at ~73,500 right after the Strong Sell pill, ribbon already red. |
| Where you exited | Bars stayed deep red into 67,200, between the 1RRisk Multiple (R)The distance from entry to stop expressed as one unit of risk. 1R = stop distance, 2R = twice stop distance.Click for full definition → and 2RRisk Multiple (R)The distance from entry to stop expressed as one unit of risk. 1R = stop distance, 2R = twice stop distance.Click for full definition → target lines — clean profit-take. |
| Move captured | ~ +8.5 % short in roughly two days. |
Lesson
The bar-colour cool-off gives you the early warning. The Strong Sell pill with SMASimple Moving AverageThe plain arithmetic mean of the last N closing prices. Reacts slower than an EMA of the same length because every bar in the window has equal weight.Click for full definition →(13) confirmation gives you the trade. The bars holding deep red into the target band tells you when the move is tiring and it's time to step out.
6. Common Pitfalls
- Trading every SupertrendSupertrendA trailing line set above or below price using an ATR multiple. When close crosses it, the line flips to the opposite side and signals a regime change.Click for full definition → flip. The SupertrendSupertrendA trailing line set above or below price using an ATR multiple. When close crosses it, the line flips to the opposite side and signals a regime change.Click for full definition → by itself flips often. MUP only prints a label when SMASimple Moving AverageThe plain arithmetic mean of the last N closing prices. Reacts slower than an EMA of the same length because every bar in the window has equal weight.Click for full definition →(13) confirms — front-running the pill by trading the raw cross re-introduces all the chop the SMASimple Moving AverageThe plain arithmetic mean of the last N closing prices. Reacts slower than an EMA of the same length because every bar in the window has equal weight.Click for full definition → filter was built to remove.
- Ignoring the bar colour. A Buy pill on cool-blue bars is much weaker than the same pill on bright-green bars. The gradient tells you whether momentum is actually behind the cross or whether it's a SupertrendSupertrendA trailing line set above or below price using an ATR multiple. When close crosses it, the line flips to the opposite side and signals a regime change.Click for full definition → twitch.
- Treating "Strong" as bigger position size. "Strong" means earlier in the cycle, not higher conviction. Strong signals catch the reversal sooner but also have more room to be wrong before SMASimple Moving AverageThe plain arithmetic mean of the last N closing prices. Reacts slower than an EMA of the same length because every bar in the window has equal weight.Click for full definition →(8) and SMASimple Moving AverageThe plain arithmetic mean of the last N closing prices. Reacts slower than an EMA of the same length because every bar in the window has equal weight.Click for full definition →(9) catch up. Size on the stop distance MUP draws, not on the label.
- Counter-trading the ribbon. A Sell pill that prints while the ribbon is still green is a low-quality signal — the regime hasn't flipped yet. Take only pills that align with the dominant ribbon colour.
- Using it on a 1m chart in low-volume sessions. The factor of 4 and the ATRAverage True RangeA measure of typical bar-to-bar volatility. ATR rises when bars get bigger; many indicators use it as a noise floor — they only fire when a move clears a multiple of ATR.Click for full definition →-based stop assume well-behaved bars. On a 1m chart at 3 a.m. ATRAverage True RangeA measure of typical bar-to-bar volatility. ATR rises when bars get bigger; many indicators use it as a noise floor — they only fire when a move clears a multiple of ATR.Click for full definition → collapses and pills appear on every twitch. Stick to 5m or higher for execution; 1H or 4H for swing reads.
- Chasing the pill bar. Pills print at the close of the trigger bar, often the worst entry of the move. The composite read is what you trade — the pill is the alert, not the price level. Wait for the first pullbackPullback (Retracement)A short, counter-trend move within an established trend — buyers (or sellers) momentarily losing ground before the trend resumes. Often the lowest-risk place to enter the trend.Click for full definition → into the slow SMASimple Moving AverageThe plain arithmetic mean of the last N closing prices. Reacts slower than an EMA of the same length because every bar in the window has equal weight.Click for full definition → or the ribbon's edge with bar colour still cooperating.