

Momentum Wave
A forward-projected ribbon that reads the current trend's slope and tells you whether the path of least resistance is up, down, or "stand aside."
1. What This Indicator Watches For
Markets don't reverse on a dime. Once price is moving in a direction, it usually keeps moving in that direction for a few more bars before the herd changes its mind. Traders call this trend persistence — and most of the money in any given session is made by traders who are simply on the right side of the existing drift.
The hard part is distinguishing a real trend from a false start. Two questions you ask in front of every chart:
- Is there actually a trend right now, or is price just chopping in a range and pretending?
- If there is one, which way is it pointing, and how forcefully?
Momentum Wave is built to answer both at a glance, without you having to draw a single line. It paints the recent direction of price into the future as a fanning ribbon, then overlays a fast/slow EMAExponential Moving AverageA moving average that weights recent bars more heavily than old ones, so it reacts faster to fresh price action than a simple average of the same length.Click for full definition → combo whose colour tells you whether trend strength is currently strong enough to act on.
2. How It Works Under the Hood
Two engines run in parallel and the chart shows you both:
- The Wave — take an EMAExponential Moving AverageA moving average that weights recent bars more heavily than old ones, so it reacts faster to fresh price action than a simple average of the same length.Click for full definition → of price (default length 89, source
ohlc4), then plot eleven snapshots of it: today's value, yesterday's, the day before's, all the way back ten bars. Each snapshot is shifted forward in time by a progressively larger offset (default8bars per step). The result is a fan of lines projecting out to the right of the current bar — a literal picture of the MA's recent slope, extended into the future. - The Trend Ribbon — a fast EMAExponential Moving AverageA moving average that weights recent bars more heavily than old ones, so it reacts faster to fresh price action than a simple average of the same length.Click for full definition → (default 30) and a slow EMAExponential Moving AverageA moving average that weights recent bars more heavily than old ones, so it reacts faster to fresh price action than a simple average of the same length.Click for full definition → (default 60) on price, with the gap between them filled in. The fill colour is gated by ATRAverage True RangeA measure of typical bar-to-bar volatility. ATR rises when bars get bigger; many indicators use it as a noise floor — they only fire when a move clears a multiple of ATR.Click for full definition →: it only turns green or red when
emaFast − emaSlowexceeds 0.30 × ATRAverage True RangeA measure of typical bar-to-bar volatility. ATR rises when bars get bigger; many indicators use it as a noise floor — they only fire when a move clears a multiple of ATR.Click for full definition →(60). Inside that band, the fill stays yellow.
The ATRAverage True RangeA measure of typical bar-to-bar volatility. ATR rises when bars get bigger; many indicators use it as a noise floor — they only fire when a move clears a multiple of ATR.Click for full definition → gate is the important part. It's why Momentum Wave doesn't flip green/red on every minor wiggle — the difference between the two EMAs has to actually beat market noise before the indicator commits to a directional read.
How the ribbon picks its colour. Every bar, the indicator asks two simple questions:
- Are the fast and slow EMAs far apart? Wide apart means one side has clearly taken over. Tangled together means no one's in charge.
- Is that distance big enough to take seriously? The cutoff is set at 30 % of the average bar size — anything smaller than that is treated as random chop, not a real signal.
The colour falls out of those two answers:
| What you're seeing | Ribbon | Plain English |
|---|---|---|
| Fast EMAExponential Moving AverageA moving average that weights recent bars more heavily than old ones, so it reacts faster to fresh price action than a simple average of the same length.Click for full definition → pulls clearly above slow EMAExponential Moving AverageA moving average that weights recent bars more heavily than old ones, so it reacts faster to fresh price action than a simple average of the same length.Click for full definition →, gap bigger than the noise cutoff | 🟢 Green | Real uptrend — buyers are in control |
| Fast and slow EMAs are too close to call | 🟡 Yellow | Chop — no one's winning, stand aside |
| Fast EMAExponential Moving AverageA moving average that weights recent bars more heavily than old ones, so it reacts faster to fresh price action than a simple average of the same length.Click for full definition → falls clearly below slow EMAExponential Moving AverageA moving average that weights recent bars more heavily than old ones, so it reacts faster to fresh price action than a simple average of the same length.Click for full definition →, gap bigger than the noise cutoff | 🔴 Red | Real downtrend — sellers are in control |
The "30 % of average bar size" cutoff is the whole reason Momentum Wave stays disciplined. Without it, the ribbon would flash green / red every time the two EMAs grazed each other. The gap has to genuinely beat the day's typical price swing before the indicator commits to a colour.
3. What You See on the Chart
| Element | Looks like | Means |
|---|---|---|
| Outer wave bands | Two thin black lines projected forward | Highest / lowest MA values from the last smooth bars — a visual "envelope" the wave fans inside |
| Inner fan (silver / gray) | A bundle of light lines extending right of price | Past MA values shifted forward — the slope and shape of the recent trajectory |
| Fast EMAExponential Moving AverageA moving average that weights recent bars more heavily than old ones, so it reacts faster to fresh price action than a simple average of the same length.Click for full definition → line | A thick line, length 30 | Short-term trend pulse |
| Slow EMAExponential Moving AverageA moving average that weights recent bars more heavily than old ones, so it reacts faster to fresh price action than a simple average of the same length.Click for full definition → line | A thick line, length 60 | Medium-term trend baseline |
| Fill between Fast & Slow | Tinted area between the two thick lines | Trend state — colour-coded |
| Green fill (#7cb518) | Lime-green tint | Bullish: fast pulling away from slow by more than 0.3 × ATRAverage True RangeA measure of typical bar-to-bar volatility. ATR rises when bars get bigger; many indicators use it as a noise floor — they only fire when a move clears a multiple of ATR.Click for full definition → |
| Red fill (#fb1707) | Red tint | Bearish: fast falling under slow by more than 0.3 × ATRAverage True RangeA measure of typical bar-to-bar volatility. ATR rises when bars get bigger; many indicators use it as a noise floor — they only fire when a move clears a multiple of ATR.Click for full definition → |
| Yellow fill (#f3de2c) | Yellow tint | Neutral: gap is inside the ATRAverage True RangeA measure of typical bar-to-bar volatility. ATR rises when bars get bigger; many indicators use it as a noise floor — they only fire when a move clears a multiple of ATR.Click for full definition → band — chop, stay flat |
Default colour scheme: black for the outer wave, silver/gray for the inner fan, green/red/yellow for the trend ribbon. Black wave = trajectory. Coloured ribbon = strength.
4. Reading It in 3 Patterns
Pattern A — Green ribbon + rising wave
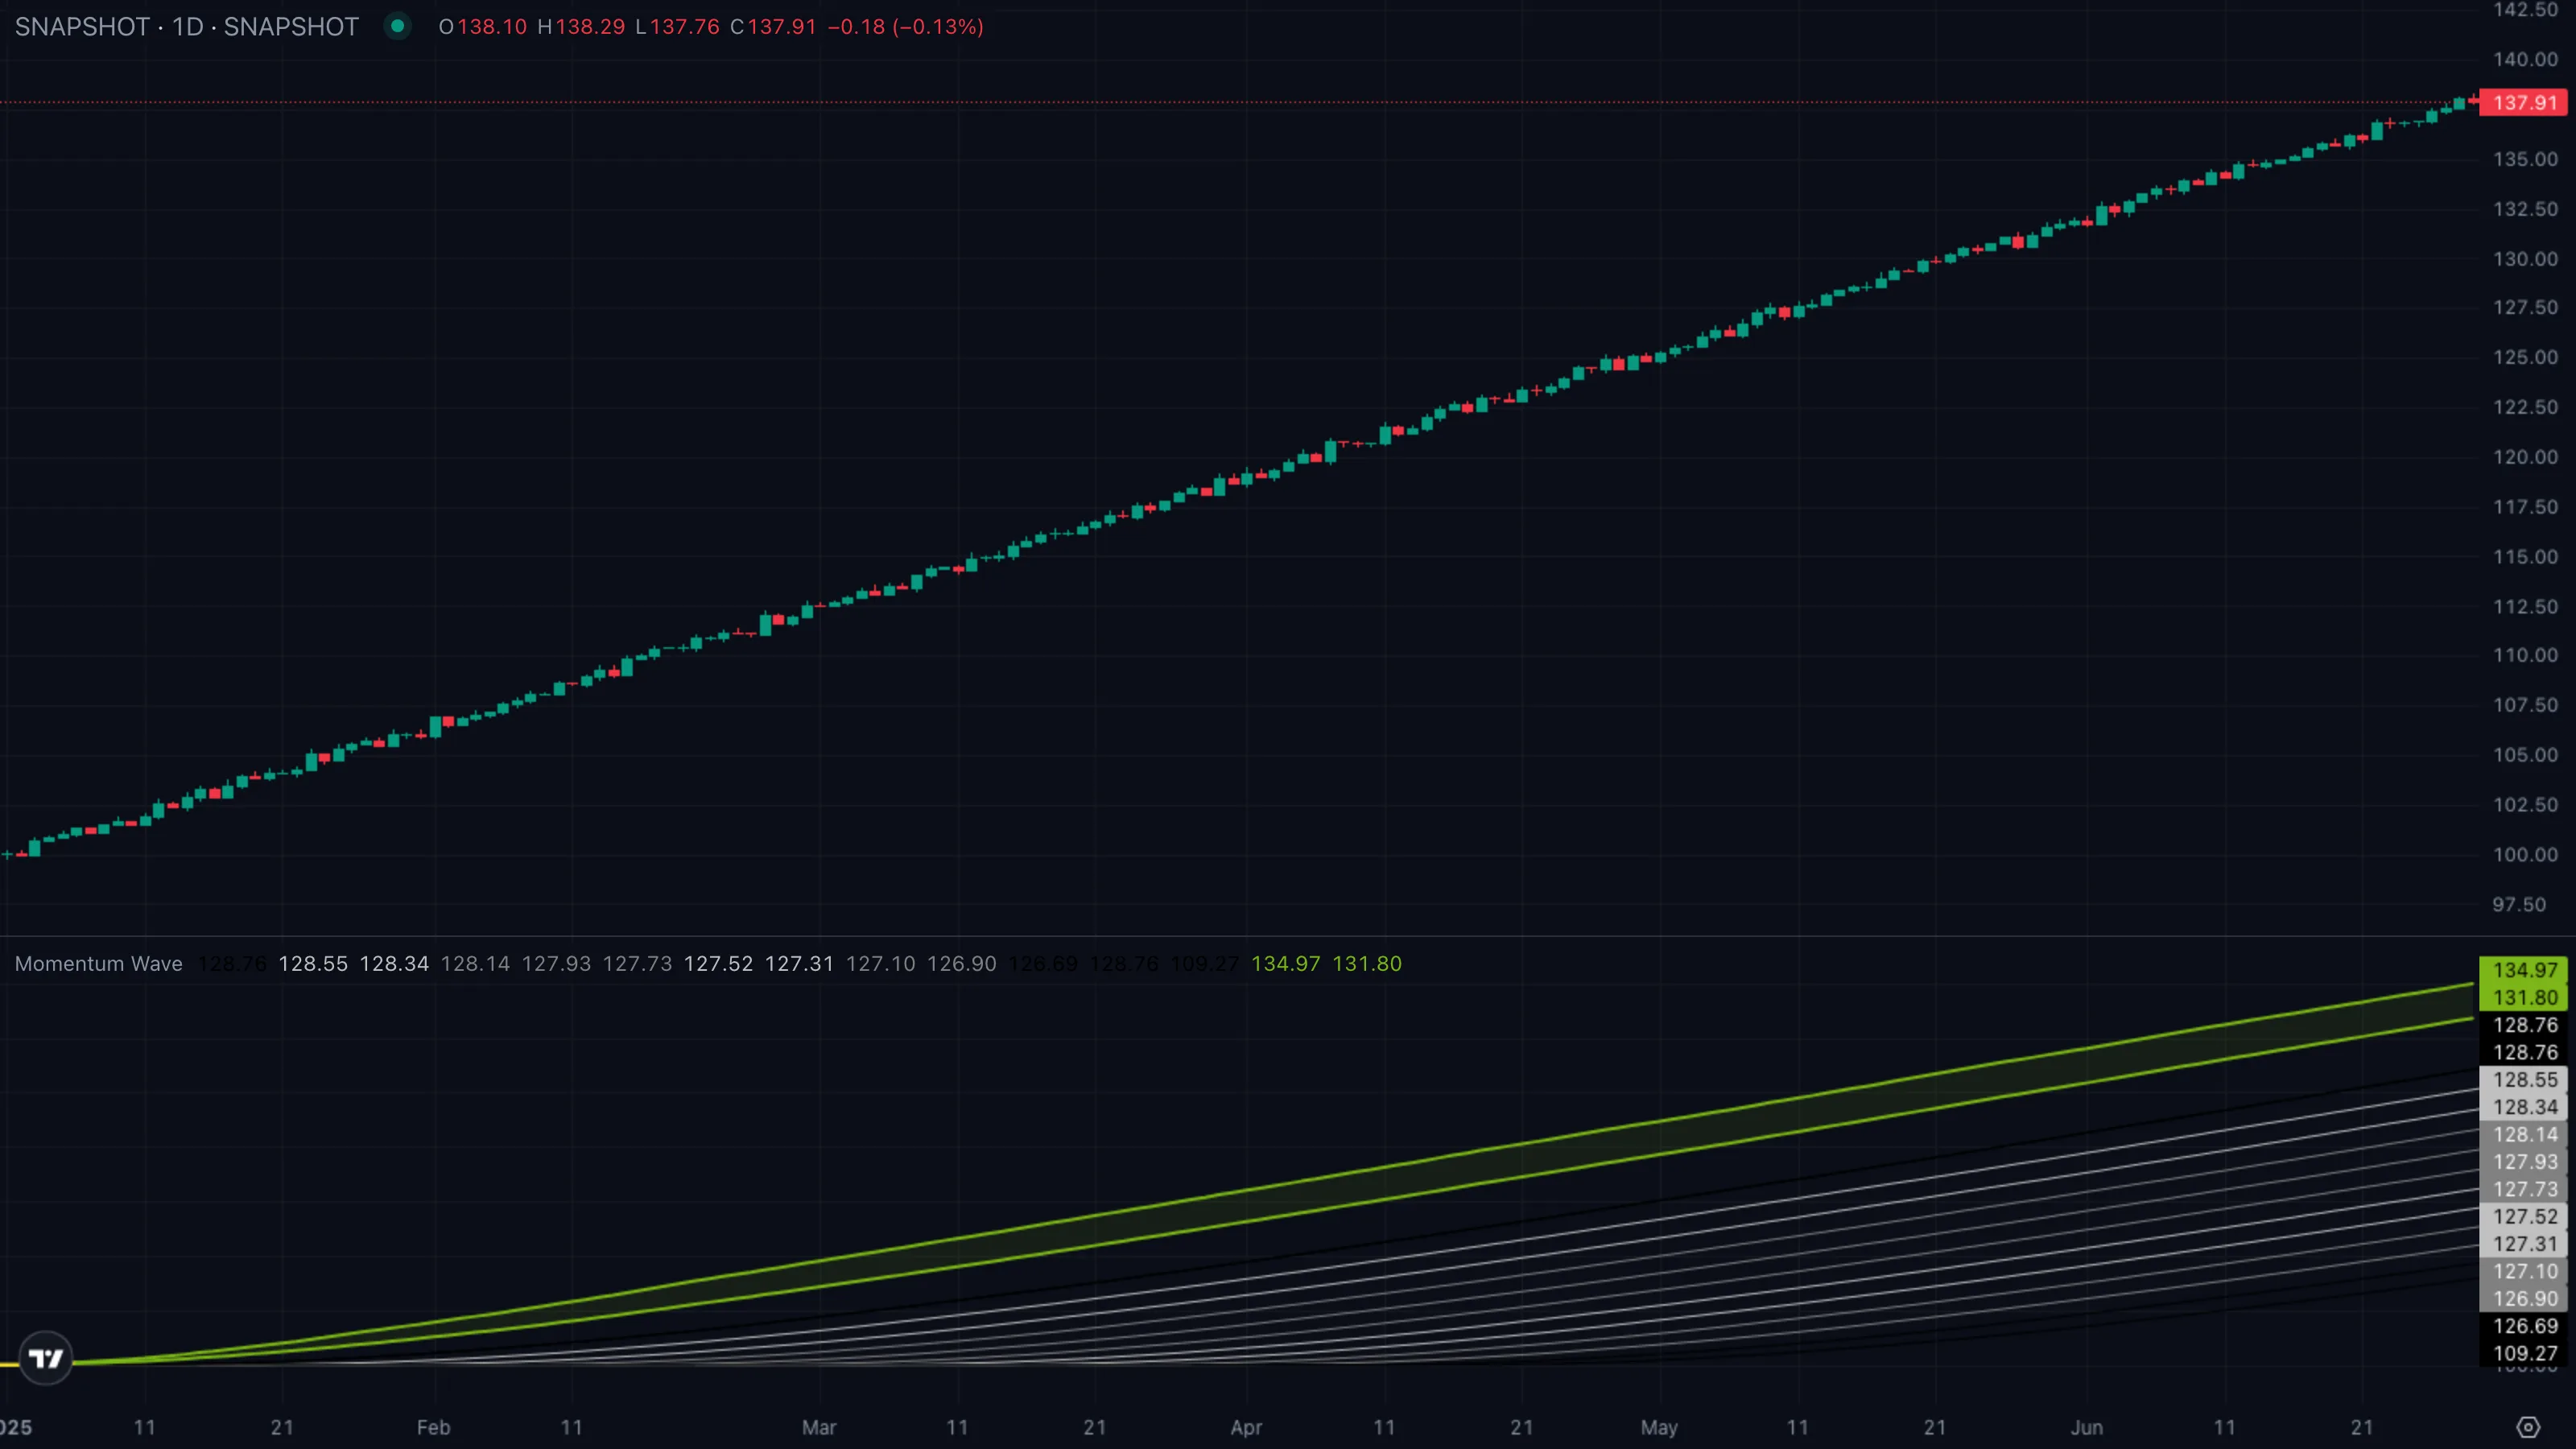
| What you see | ① Trend candles step steadily higher ② trend ribbon is solidly green with fast EMAExponential Moving AverageA moving average that weights recent bars more heavily than old ones, so it reacts faster to fresh price action than a simple average of the same length.Click for full definition → above slow ③ wave fan slopes upward to the right. |
| What it means | Both engines agree — short-term momentum and recent trajectory both point up. The probability of price working higher over the next handful of bars is elevated. |
| What to do | Bias long. Buy pullbacksPullback (Retracement)A short, counter-trend move within an established trend — buyers (or sellers) momentarily losing ground before the trend resumes. Often the lowest-risk place to enter the trend.Click for full definition → into the slow EMAExponential Moving AverageA moving average that weights recent bars more heavily than old ones, so it reacts faster to fresh price action than a simple average of the same length.Click for full definition → or the lower edge of the wave envelope. Don't fade rallies; the path of least resistance is up. |
Pattern B — Yellow ribbon + flat wave
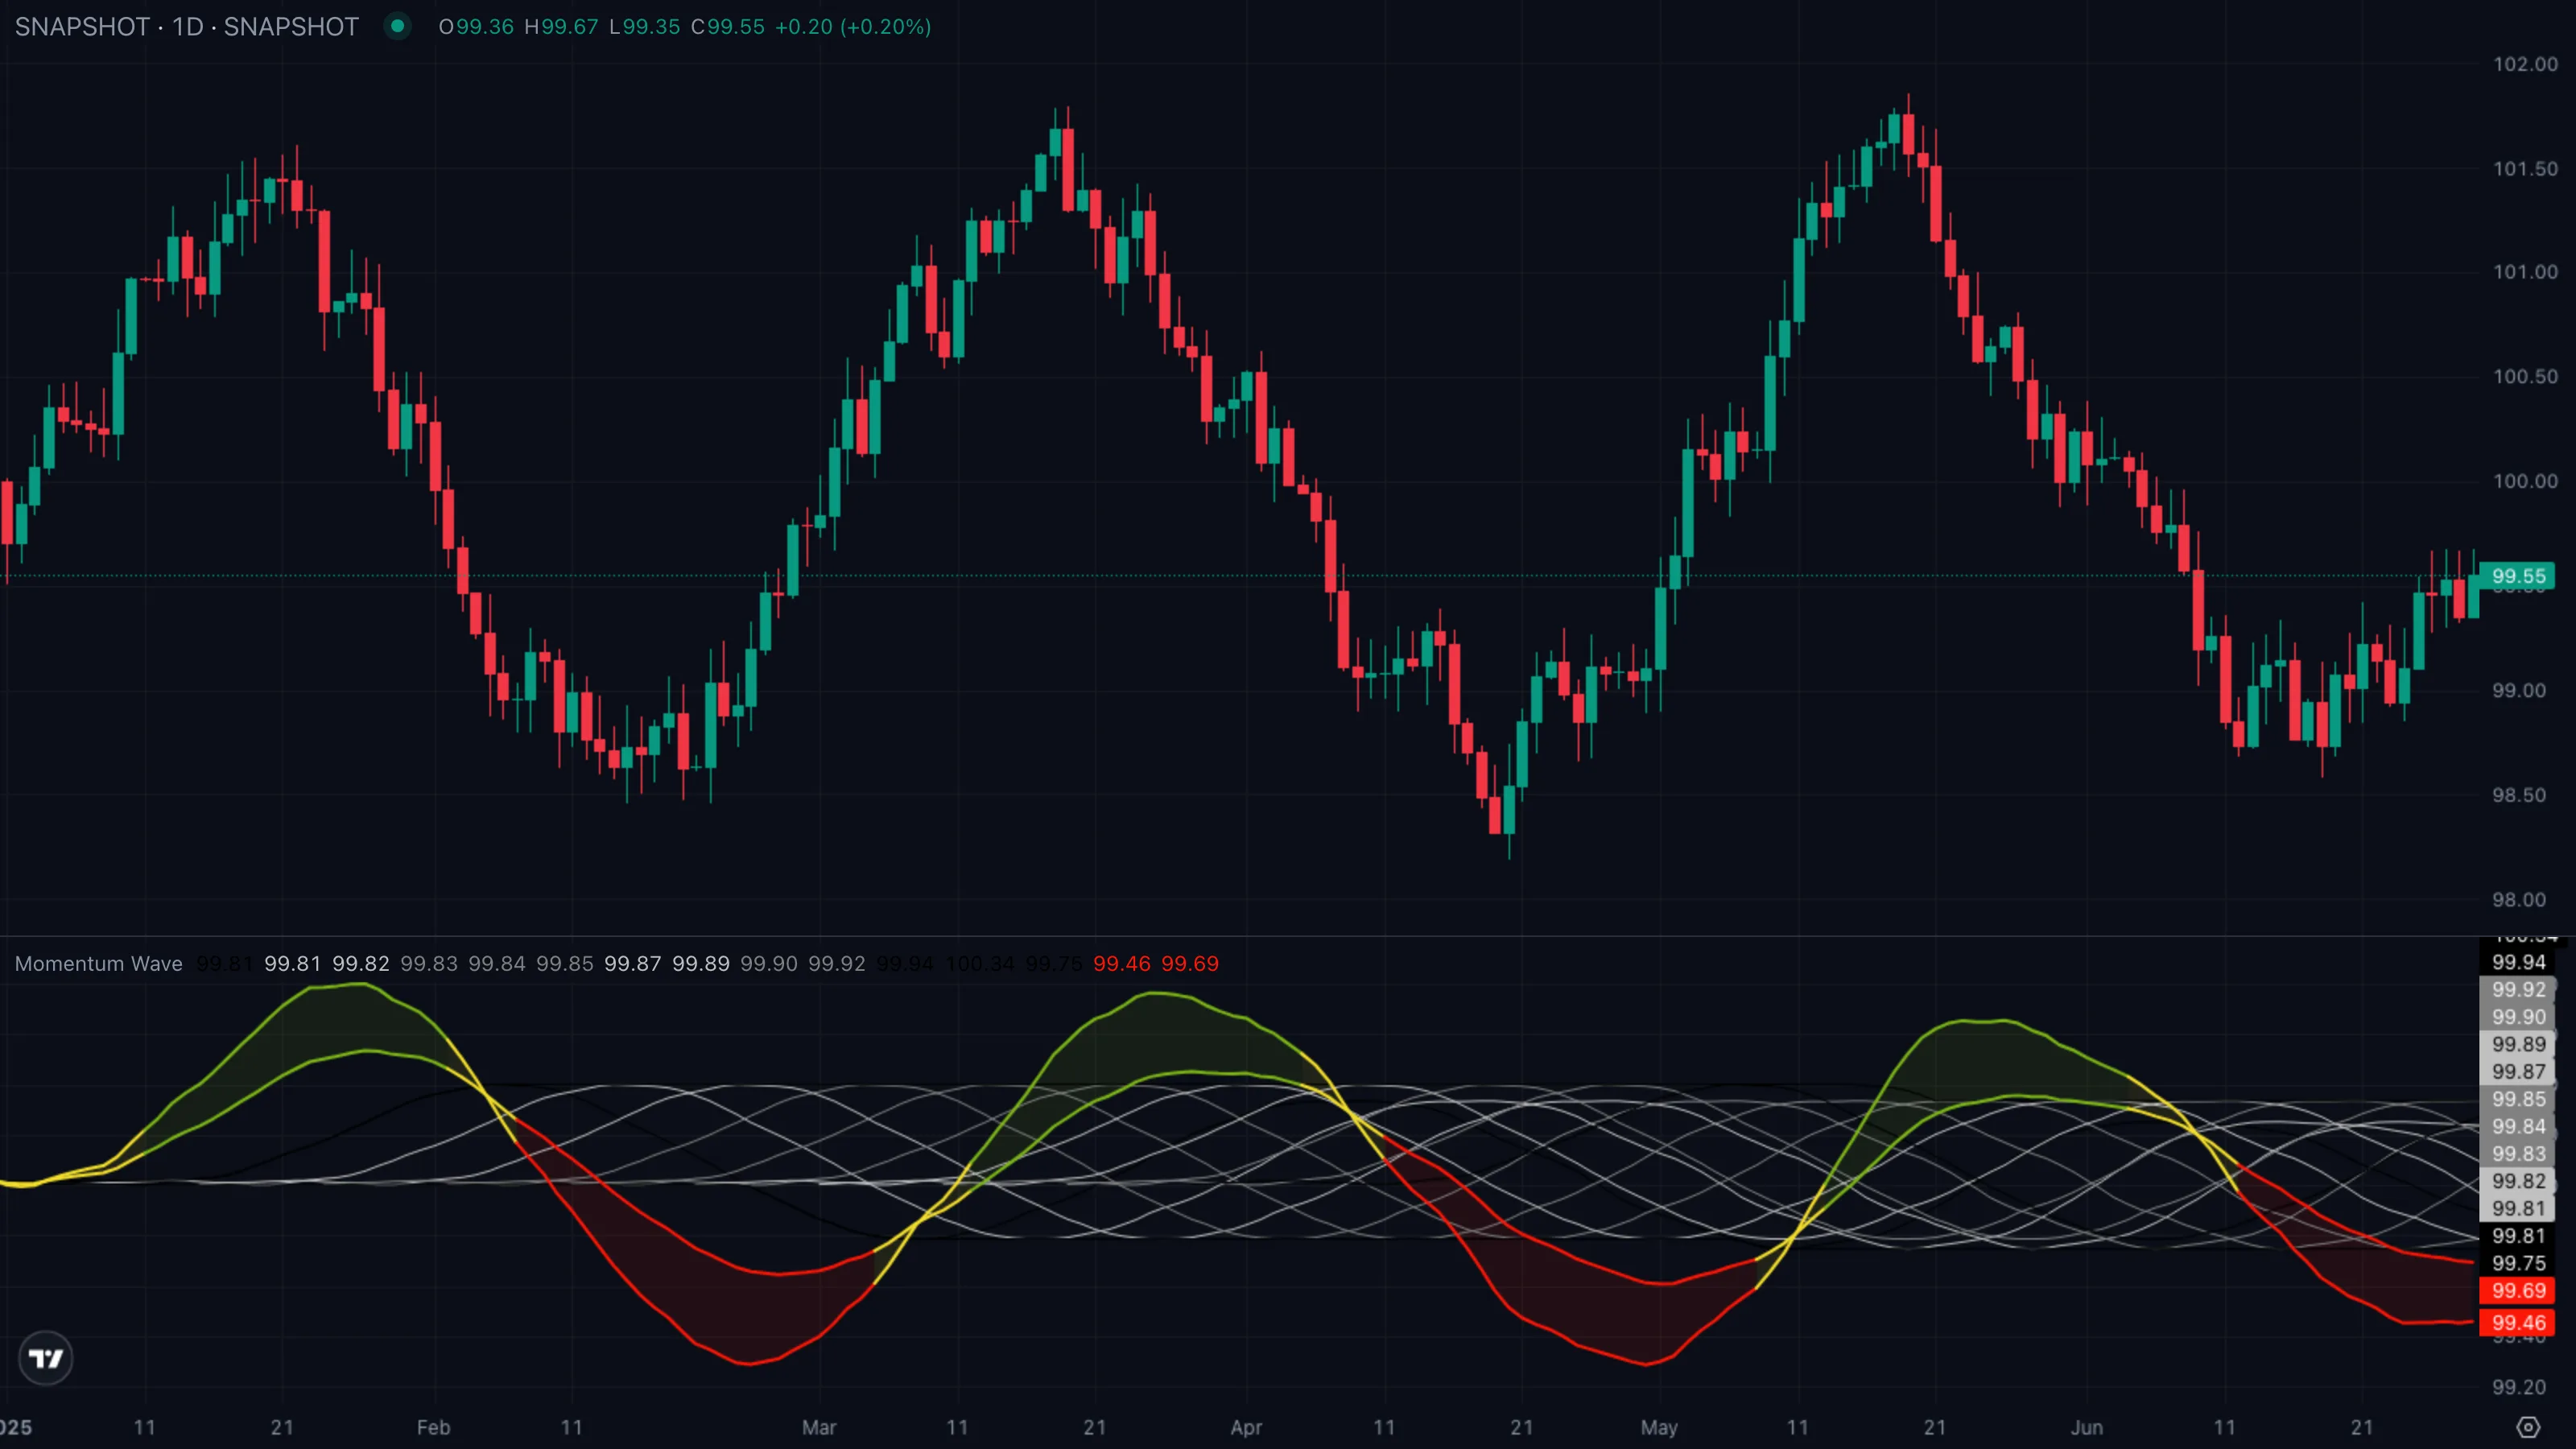
| What you see | ① Price oscillates inside a tight range ② fill between fast and slow EMAExponential Moving AverageA moving average that weights recent bars more heavily than old ones, so it reacts faster to fresh price action than a simple average of the same length.Click for full definition → stays yellow ③ wave fan is roughly horizontal. |
| What it means | No trend. The gap between fast and slow EMAExponential Moving AverageA moving average that weights recent bars more heavily than old ones, so it reacts faster to fresh price action than a simple average of the same length.Click for full definition → can't beat ATRAverage True RangeA measure of typical bar-to-bar volatility. ATR rises when bars get bigger; many indicators use it as a noise floor — they only fire when a move clears a multiple of ATR.Click for full definition → — there's just no edge in either direction. This is the indicator explicitly telling you to stand down. |
| What to do | Stand aside. Mean-reversionMean ReversionThe expectation that price, after stretching far from a baseline (a moving average, prior range), will snap back toward it. Works best in chop and range-bound markets.Click for full definition → strategies might work here, but trend-followingTrend FollowingThe opposite of mean reversion — staying with a directional move once it's established, exiting only when the trend itself breaks. Works best in trending markets.Click for full definition → ones will get chopped up. Wait for the ribbon to commit to a colour. |
Pattern C — Colour flip + wave inflection
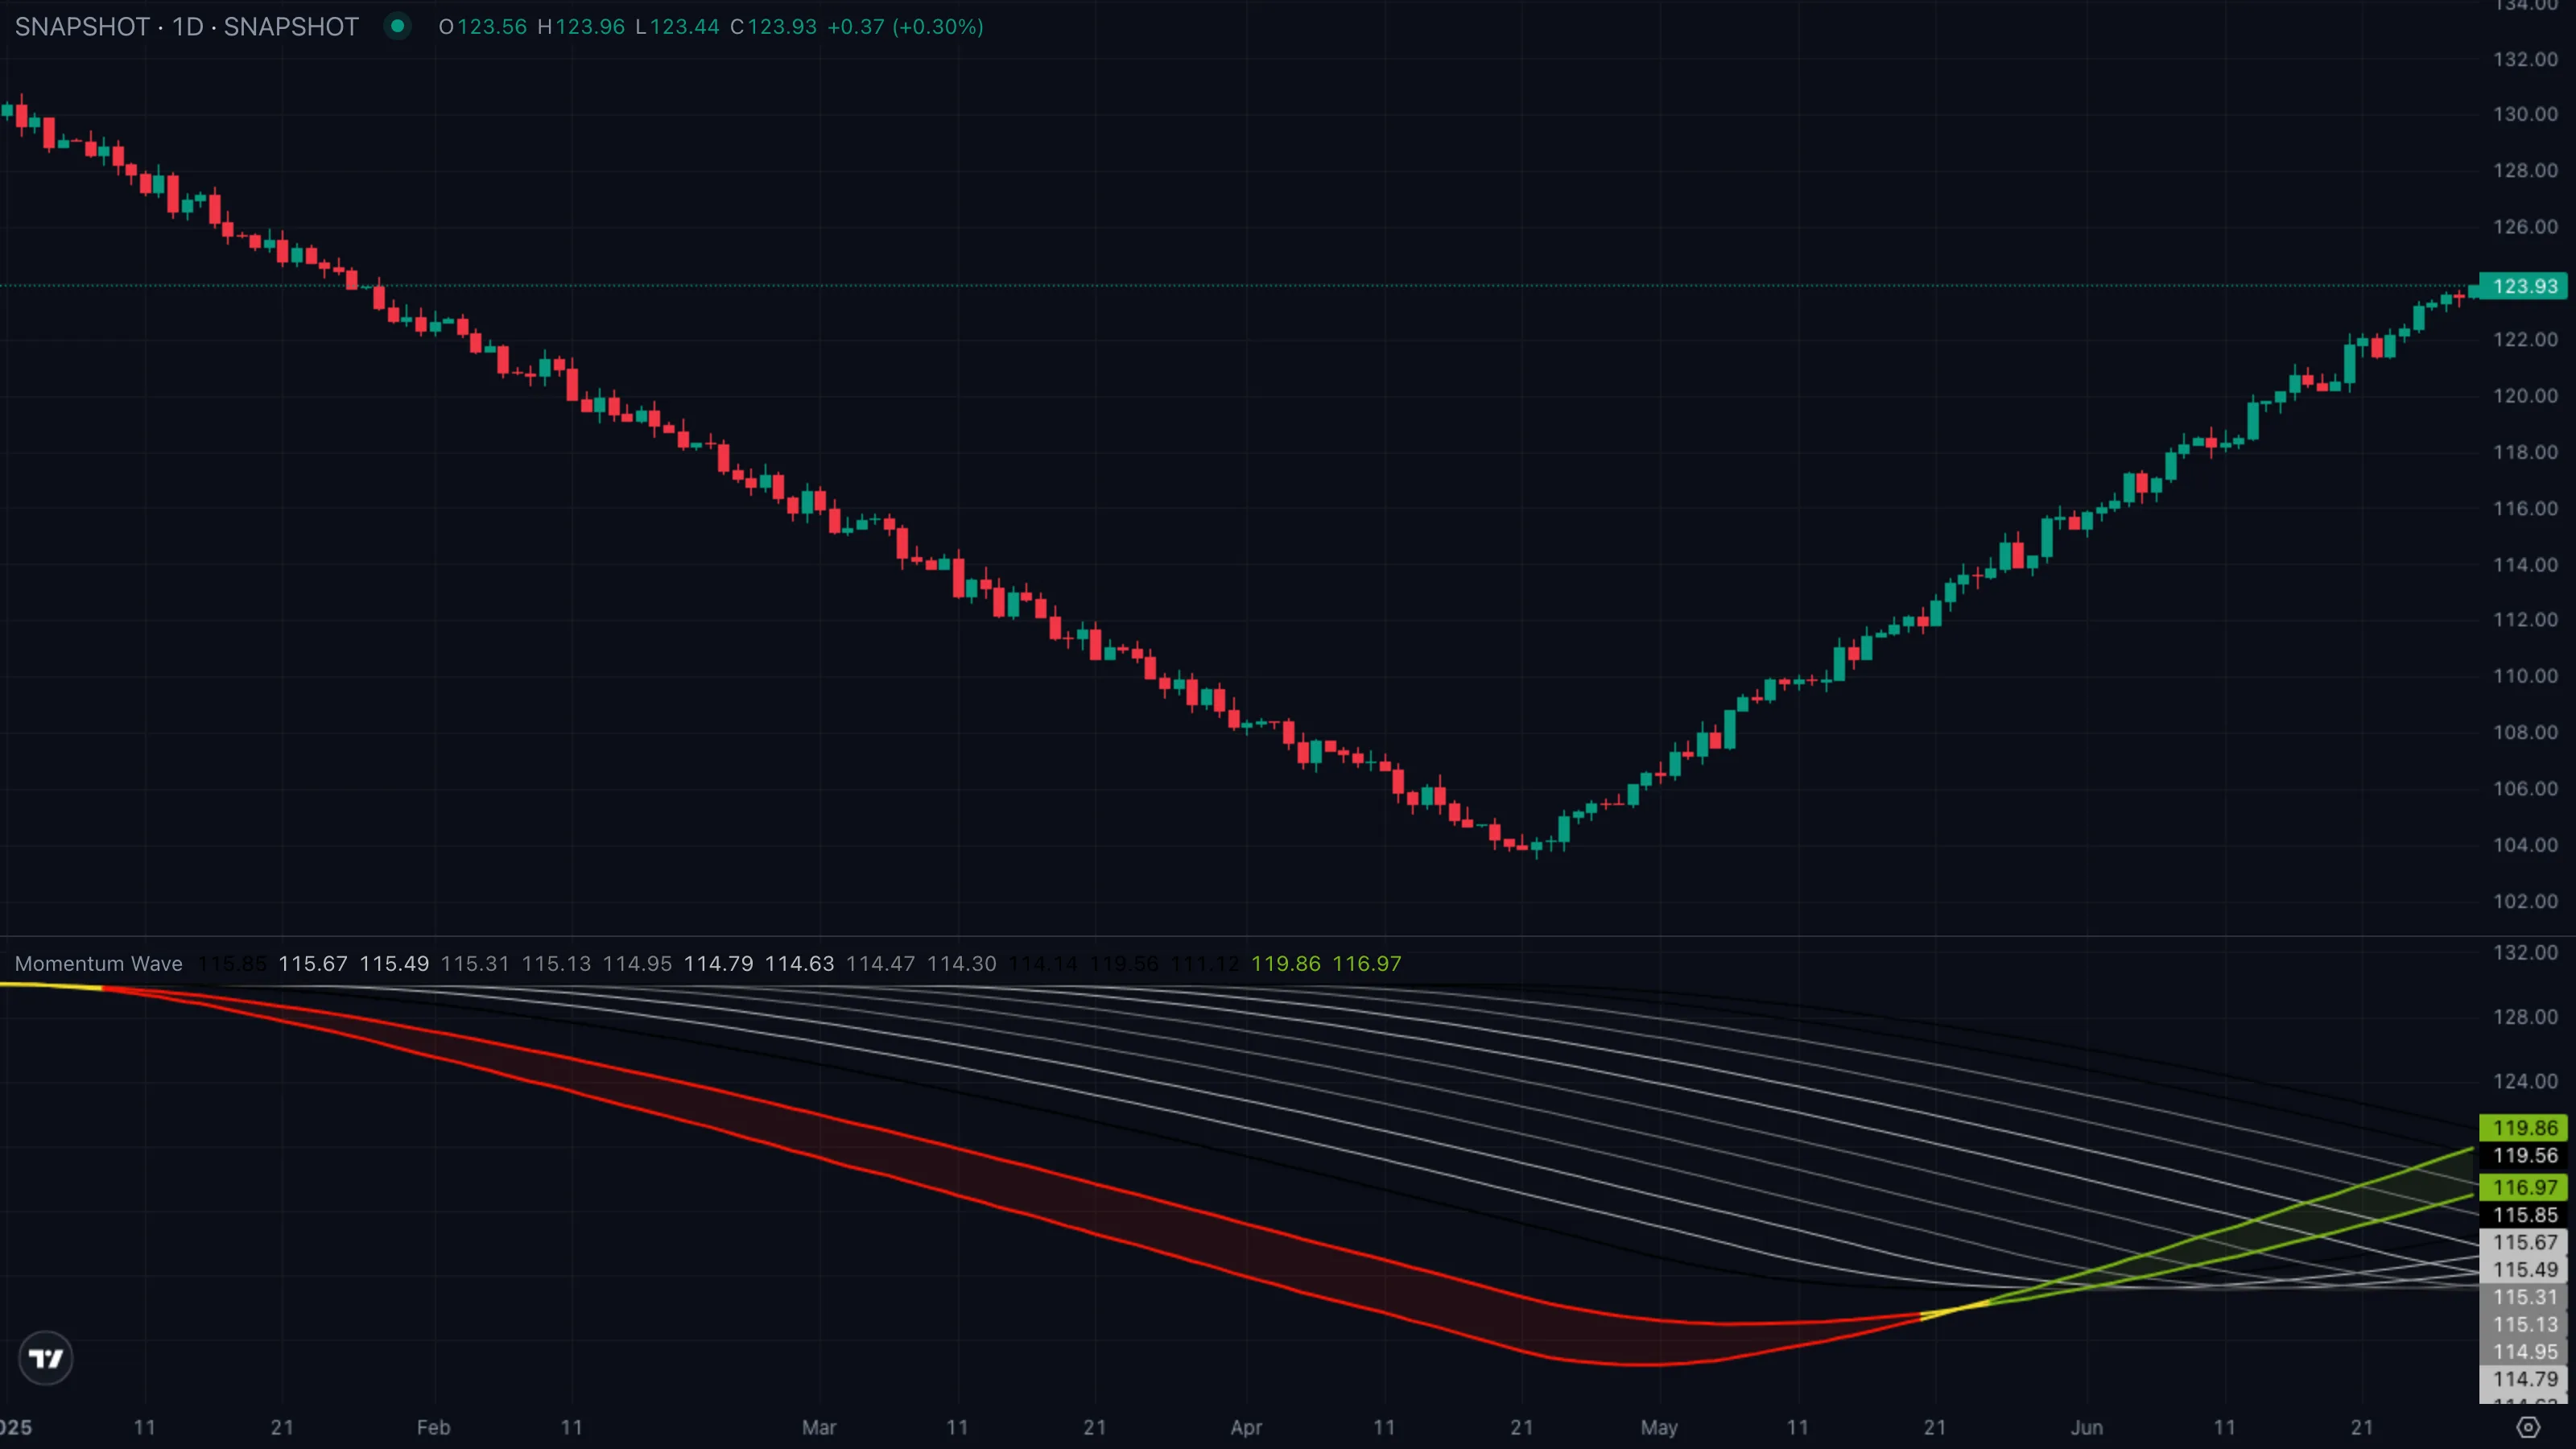
| What you see | ① Red ribbon during the decline ② ribbon flips through yellow as the low forms ③ green ribbon confirms the new bull leg as the wave fan curls up. |
| What it means | A trend transition is happening in real time. Early signal — by the time both confirm, the trend usually has more room to run. |
| What to do | Wait for the first pullbackPullback (Retracement)A short, counter-trend move within an established trend — buyers (or sellers) momentarily losing ground before the trend resumes. Often the lowest-risk place to enter the trend.Click for full definition → after the flip rather than chasing the bar where the colour changed. Entries on retracementsPullback (Retracement)A short, counter-trend move within an established trend — buyers (or sellers) momentarily losing ground before the trend resumes. Often the lowest-risk place to enter the trend.Click for full definition → into the slow EMAExponential Moving AverageA moving average that weights recent bars more heavily than old ones, so it reacts faster to fresh price action than a simple average of the same length.Click for full definition → or lower wave edge tend to give better risk/reward than market-buying the flip bar. |
5. Trade Walkthrough
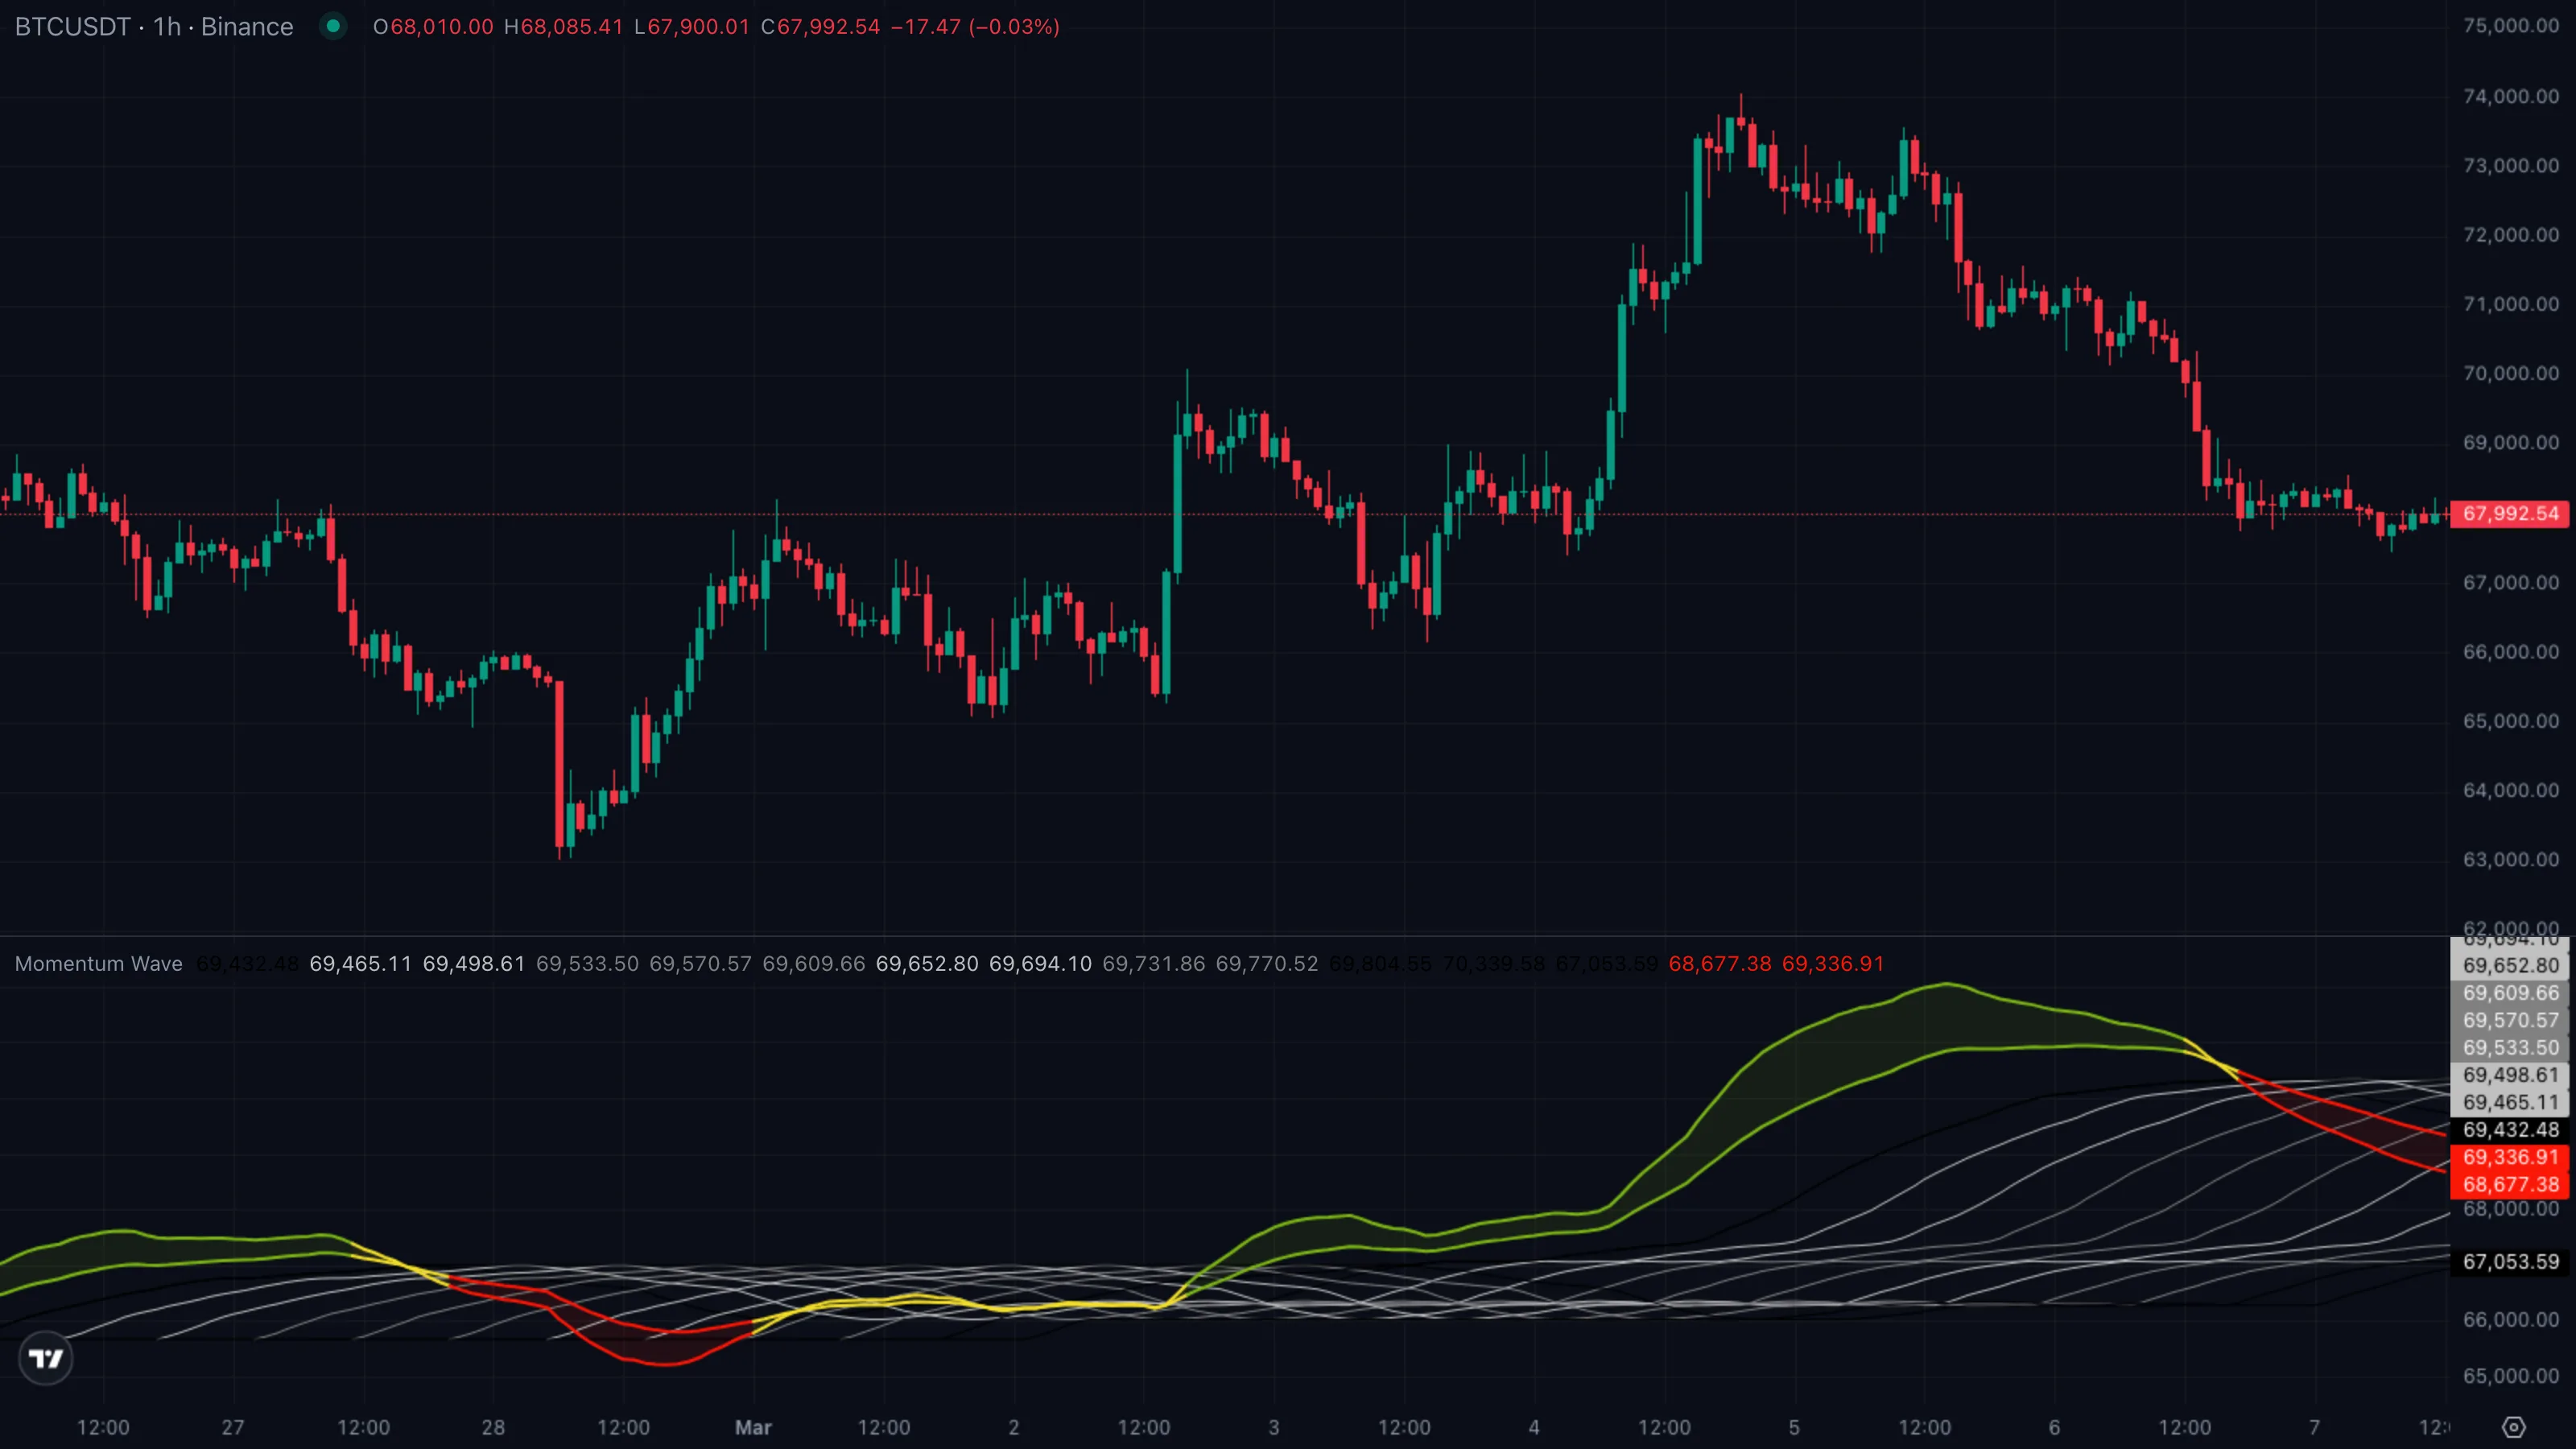
| Symbol | BTCUSDT |
|---|---|
| Timeframe | 1H |
| Venue | Binance |
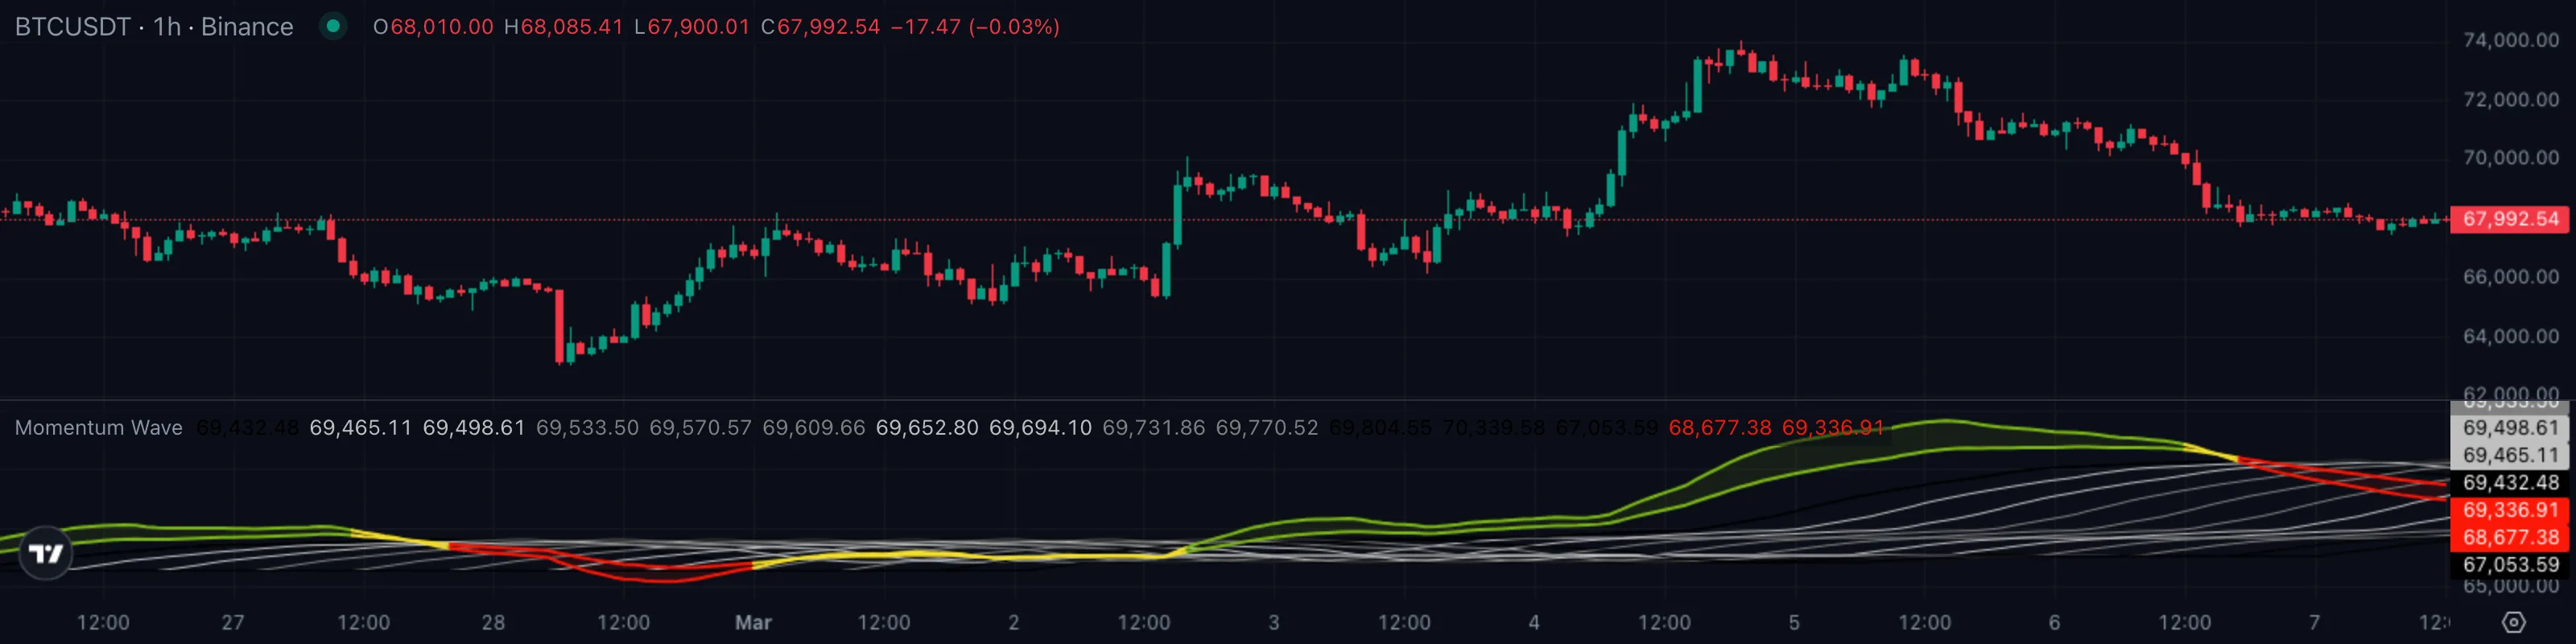
| Window | 26 Feb to 7 Mar 2026 |
| Pattern | C — colour flip + wave inflection |
A textbook setup. BTC chopped between 63,000 and 70,000 for the back half of February with no committed direction, then flipped green on 2 March and ran roughly +12 % over the following two days. The numbered markers ①–④ on the chart map to the four phases of the trade below.
The sequence
| # | When | BTC price | Ribbon | What it tells you |
|---|---|---|---|---|
| ① | 26 Feb to 2 Mar | 63,000 to 70,000 chop | yellow / red | Stand-aside regime. Fast and slow EMAs tangled, wave fan flat. |
| ② | 2 Mar | ~69,200 close | flips green | Pattern C trigger. Fast EMAExponential Moving AverageA moving average that weights recent bars more heavily than old ones, so it reacts faster to fresh price action than a simple average of the same length.Click for full definition → pulls past slow by more than 0.3 × ATRAverage True RangeA measure of typical bar-to-bar volatility. ATR rises when bars get bigger; many indicators use it as a noise floor — they only fire when a move clears a multiple of ATR.Click for full definition →; wave fan starts curling up. |
| ③ | 3 Mar | ~66,200 low | stays green | First pullbackPullback (Retracement)A short, counter-trend move within an established trend — buyers (or sellers) momentarily losing ground before the trend resumes. Often the lowest-risk place to enter the trend.Click for full definition → into the slow EMAExponential Moving AverageA moving average that weights recent bars more heavily than old ones, so it reacts faster to fresh price action than a simple average of the same length.Click for full definition →. The real entry. |
| ④ | 4 Mar | ~74,000 high | fading toward yellow | Move tiring. Cue to take profit before the trend turns. |
The trade in one card
| What you skipped | Market-buying the flip bar at 69,200 — the chase trade. Would have been underwater within a day. |
| What you took | PullbackPullback (Retracement)A short, counter-trend move within an established trend — buyers (or sellers) momentarily losing ground before the trend resumes. Often the lowest-risk place to enter the trend.Click for full definition → into the slow EMAExponential Moving AverageA moving average that weights recent bars more heavily than old ones, so it reacts faster to fresh price action than a simple average of the same length.Click for full definition → at ~66,200, ribbon still green. |
| Where you exited | Ribbon fades to yellow as price stalls near 74,000. |
| Move captured | ~ +11.8 % in roughly two days. |
Lesson
The flip bar gives you the alert. The first pullbackPullback (Retracement)A short, counter-trend move within an established trend — buyers (or sellers) momentarily losing ground before the trend resumes. Often the lowest-risk place to enter the trend.Click for full definition → that holds the slow EMAExponential Moving AverageA moving average that weights recent bars more heavily than old ones, so it reacts faster to fresh price action than a simple average of the same length.Click for full definition →, with the ribbon still green, gives you the trade. The colour fade back to yellow tells you when the move is tiring and it's time to step out.
6. Common Pitfalls
- Trading every flip. The ribbon will sometimes flicker green → yellow → green over a few bars in choppy conditions. Wait for the colour to hold across at least two or three bars before treating it as a real signal.
- Ignoring the wave's slope. Some traders only look at the ribbon colour. The wave fan is the second confirmation — if the ribbon is green but the wave is flat or curling down, the trend is fragile.
- Using it on a 1m chart in low-volume sessions. The 0.3 × ATRAverage True RangeA measure of typical bar-to-bar volatility. ATR rises when bars get bigger; many indicators use it as a noise floor — they only fire when a move clears a multiple of ATR.Click for full definition → gate works well on liquid, well-behaved bars. On a 1m chart at 3 a.m., ATRAverage True RangeA measure of typical bar-to-bar volatility. ATR rises when bars get bigger; many indicators use it as a noise floor — they only fire when a move clears a multiple of ATR.Click for full definition → is tiny and the ribbon will go green/red on every twitch. Stick to 5m or higher for execution; 1H+ for swing reads.
- Missing the colour state during fast moves. Strong trends often flash through "yellow" in a single bar between green and red. If you're watching a chart that just broke 2× ATRAverage True RangeA measure of typical bar-to-bar volatility. ATR rises when bars get bigger; many indicators use it as a noise floor — they only fire when a move clears a multiple of ATR.Click for full definition → in one bar, the absence of yellow is itself the signal — it means the move is too fast for the gate to register a transition.
- Treating the forward projection as a price prediction. The wave doesn't predict where price will be in 8 bars. It shows where the current MA's footprint would land if extended forward — i.e., the slope you're trading off. Trends end; the wave will look exactly the same at the moment a top forms. Always pair it with price action on the actual current bar.