

Sniper v3
A precision entry tool that waits for a clean four-EMAExponential Moving AverageA moving average that weights recent bars more heavily than old ones, so it reacts faster to fresh price action than a simple average of the same length.Click for full definition → stack to line up, then drops a buy or sell with a pre-anchoredAnchored VWAPA VWAP that begins at a chosen pivot bar (a swing high or swing low) and runs forward. Anchoring makes the absolute level meaningful instead of drifting with whatever bars happen to load.Click for full definition → stop and five risk-multiple targets already on the chart.
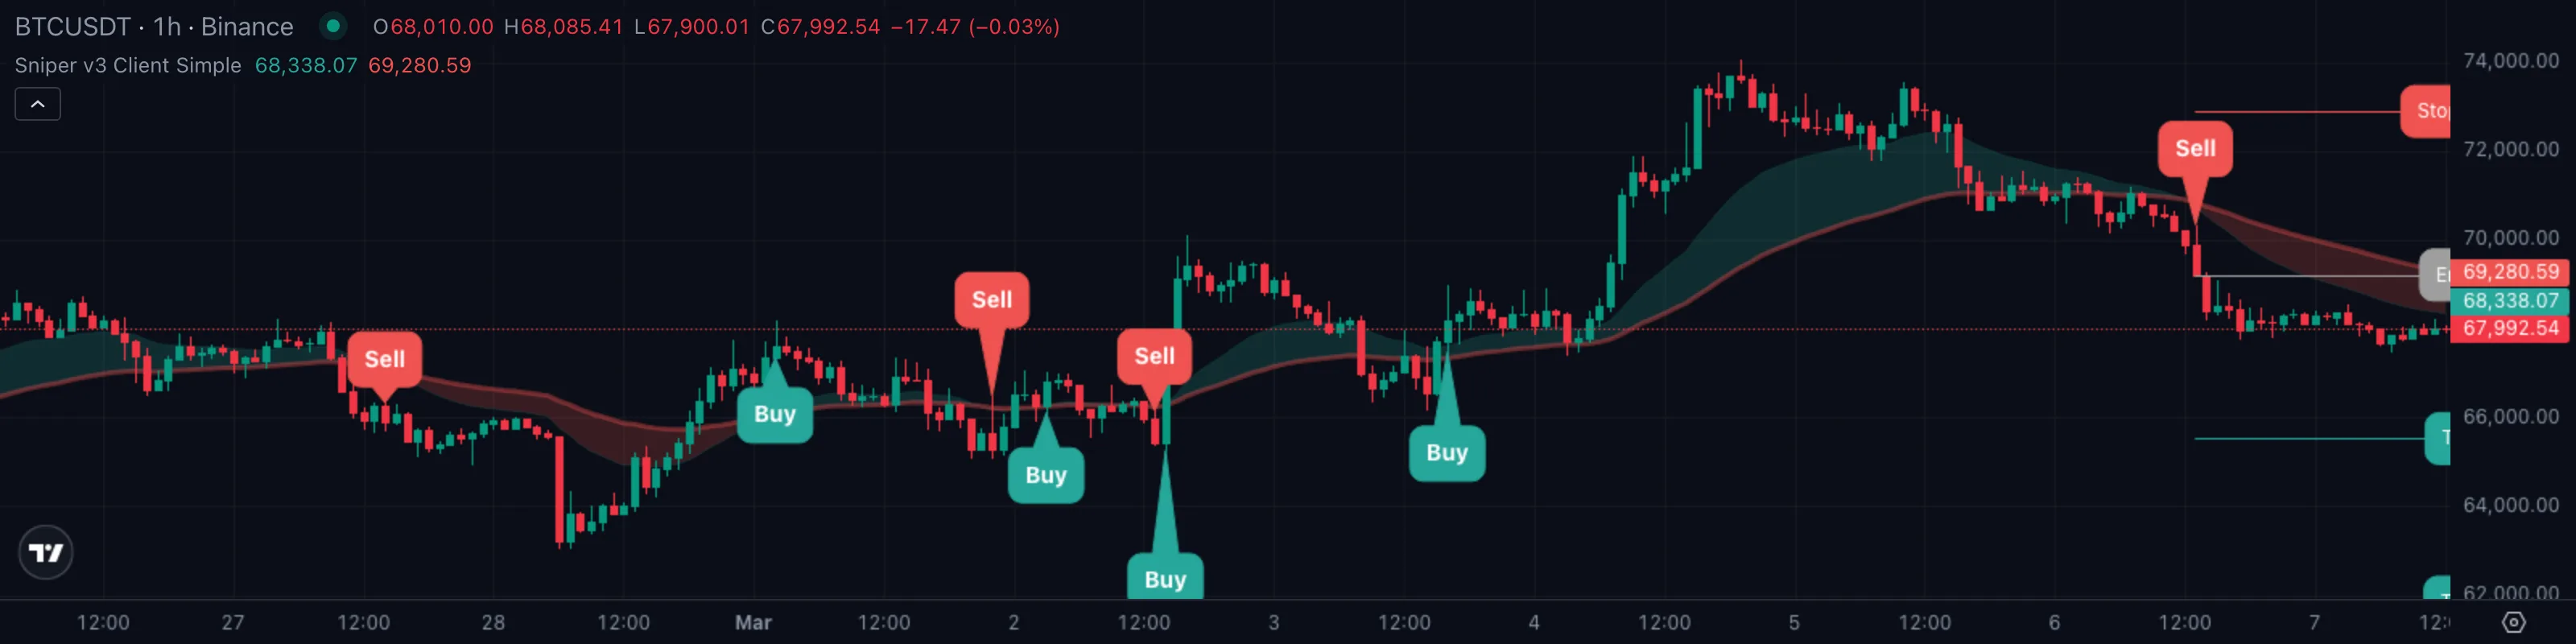
1. What This Indicator Watches For
Most retail trades die for the same reason: the entry was fine but the stop was a guess and the targets were wishful. By the time price wobbles, the trader is staring at a P&L with no plan, no anchorAnchored VWAPA VWAP that begins at a chosen pivot bar (a swing high or swing low) and runs forward. Anchoring makes the absolute level meaningful instead of drifting with whatever bars happen to load.Click for full definition →, and closes at the worst possible spot. The fix is not a smarter signal — it is a signal that shows up with the risk geometry already built in.
Two questions a serious trader needs answered before clicking Buy:
- Is everything actually pointing the same way right now, or is one timeframe disagreeing with another?
- Where exactly is my stop, and where exactly do I scale out — decided BEFORE the entry bar, not after it goes against me?
Sniper v3 only fires when all four of its EMAs line up into a clean fan. The moment it does, it pins the stop to the most recent bar that broke against the trend and lays out five targets at fixed multiples of that risk distance. You either take the entry on its terms or you skip it.
2. How It Works Under the Hood
Three engines run together. Two paint the chart, one fills a side panel.
- The four-EMAExponential Moving AverageA moving average that weights recent bars more heavily than old ones, so it reacts faster to fresh price action than a simple average of the same length.Click for full definition → stack. Four EMAs at lengths 8, 13, 21, 55 are layered on price. When the fastest sits on top, the next-fastest just below, the third below that, and the slowest at the very bottom, that is a clean bullish fan. Inverted, it is a bearish fan. Sniper v3 only takes a trade when the fan is fully sorted in one direction.
- The Trend Band. A coloured fill sits between EMAExponential Moving AverageA moving average that weights recent bars more heavily than old ones, so it reacts faster to fresh price action than a simple average of the same length.Click for full definition → 21 and EMAExponential Moving AverageA moving average that weights recent bars more heavily than old ones, so it reacts faster to fresh price action than a simple average of the same length.Click for full definition → 55. Green when the fast edge is above the slow edge, red the other way. It is the at-a-glance regime read.
- The Smart Panel. A side dashboard reports current position, the chart's SMASimple Moving AverageThe plain arithmetic mean of the last N closing prices. Reacts slower than an EMA of the same length because every bar in the window has equal weight.Click for full definition → 200 trend, RSIRelative Strength IndexA 0-to-100 momentum oscillator measuring the size of recent up-bars versus down-bars. Above 70 is hot, below 30 is cold, near 50 is neutral.Click for full definition → condition, latest-bar notional volume, the volatility regime, and the 15-minute, 1-hour, 4-hour, and Daily trend on Binance. The four MTF rows confirm the trade is not fighting higher timeframes.
How Sniper v3 picks an entry. Every bar, the indicator asks two simple questions:
- Is the slow EMAExponential Moving AverageA moving average that weights recent bars more heavily than old ones, so it reacts faster to fresh price action than a simple average of the same length.Click for full definition → the lowest of the four? If yes, every faster EMAExponential Moving AverageA moving average that weights recent bars more heavily than old ones, so it reacts faster to fresh price action than a simple average of the same length.Click for full definition → is above it — the fan is fully sorted bullish. Inverted for shorts (slow EMAExponential Moving AverageA moving average that weights recent bars more heavily than old ones, so it reacts faster to fresh price action than a simple average of the same length.Click for full definition → is the highest).
- Did this fan stack JUST sort itself this bar? A buy only fires on the first bar the bullish fan locks in. If the fan was already sorted last bar, this bar is too late and no signal prints.
| What you're seeing | State | Plain English |
|---|---|---|
| Fan fully sorted bullish on a fresh bar, no long open | 🟢 Buy fires | Clean sniper buy. Entry, stop, and 5 TPs print on the chart. |
| EMAExponential Moving AverageA moving average that weights recent bars more heavily than old ones, so it reacts faster to fresh price action than a simple average of the same length.Click for full definition → 21 above EMAExponential Moving AverageA moving average that weights recent bars more heavily than old ones, so it reacts faster to fresh price action than a simple average of the same length.Click for full definition → 55, fan only partly sorted | 🟡 Band green, no signal | Bullish lean, but the four-EMAExponential Moving AverageA moving average that weights recent bars more heavily than old ones, so it reacts faster to fresh price action than a simple average of the same length.Click for full definition → fan isn't clean enough yet. |
| Fan inverts on a fresh bar, no short open | 🔴 Sell fires | Clean sniper sell with the same risk geometry. |
The "fresh bar" rule is the whole reason Sniper v3 stays disciplined. Without it, a long-running trend would print a Buy on every bar. The fan has to transition into a clean stack to count. Signals are sparse by design.
3. What You See on the Chart
| Element | Looks like | Means |
|---|---|---|
| EMAExponential Moving AverageA moving average that weights recent bars more heavily than old ones, so it reacts faster to fresh price action than a simple average of the same length.Click for full definition → 21 / EMAExponential Moving AverageA moving average that weights recent bars more heavily than old ones, so it reacts faster to fresh price action than a simple average of the same length.Click for full definition → 55 lines | A faint and a thicker line | Fast and slow edges of the Trend Band |
| Green band fill | Tinted area between the lines | EMAExponential Moving AverageA moving average that weights recent bars more heavily than old ones, so it reacts faster to fresh price action than a simple average of the same length.Click for full definition → 21 above EMAExponential Moving AverageA moving average that weights recent bars more heavily than old ones, so it reacts faster to fresh price action than a simple average of the same length.Click for full definition → 55 — bullish regime |
| Red band fill | Tinted area between the lines | EMAExponential Moving AverageA moving average that weights recent bars more heavily than old ones, so it reacts faster to fresh price action than a simple average of the same length.Click for full definition → 21 below EMAExponential Moving AverageA moving average that weights recent bars more heavily than old ones, so it reacts faster to fresh price action than a simple average of the same length.Click for full definition → 55 — bearish regime |
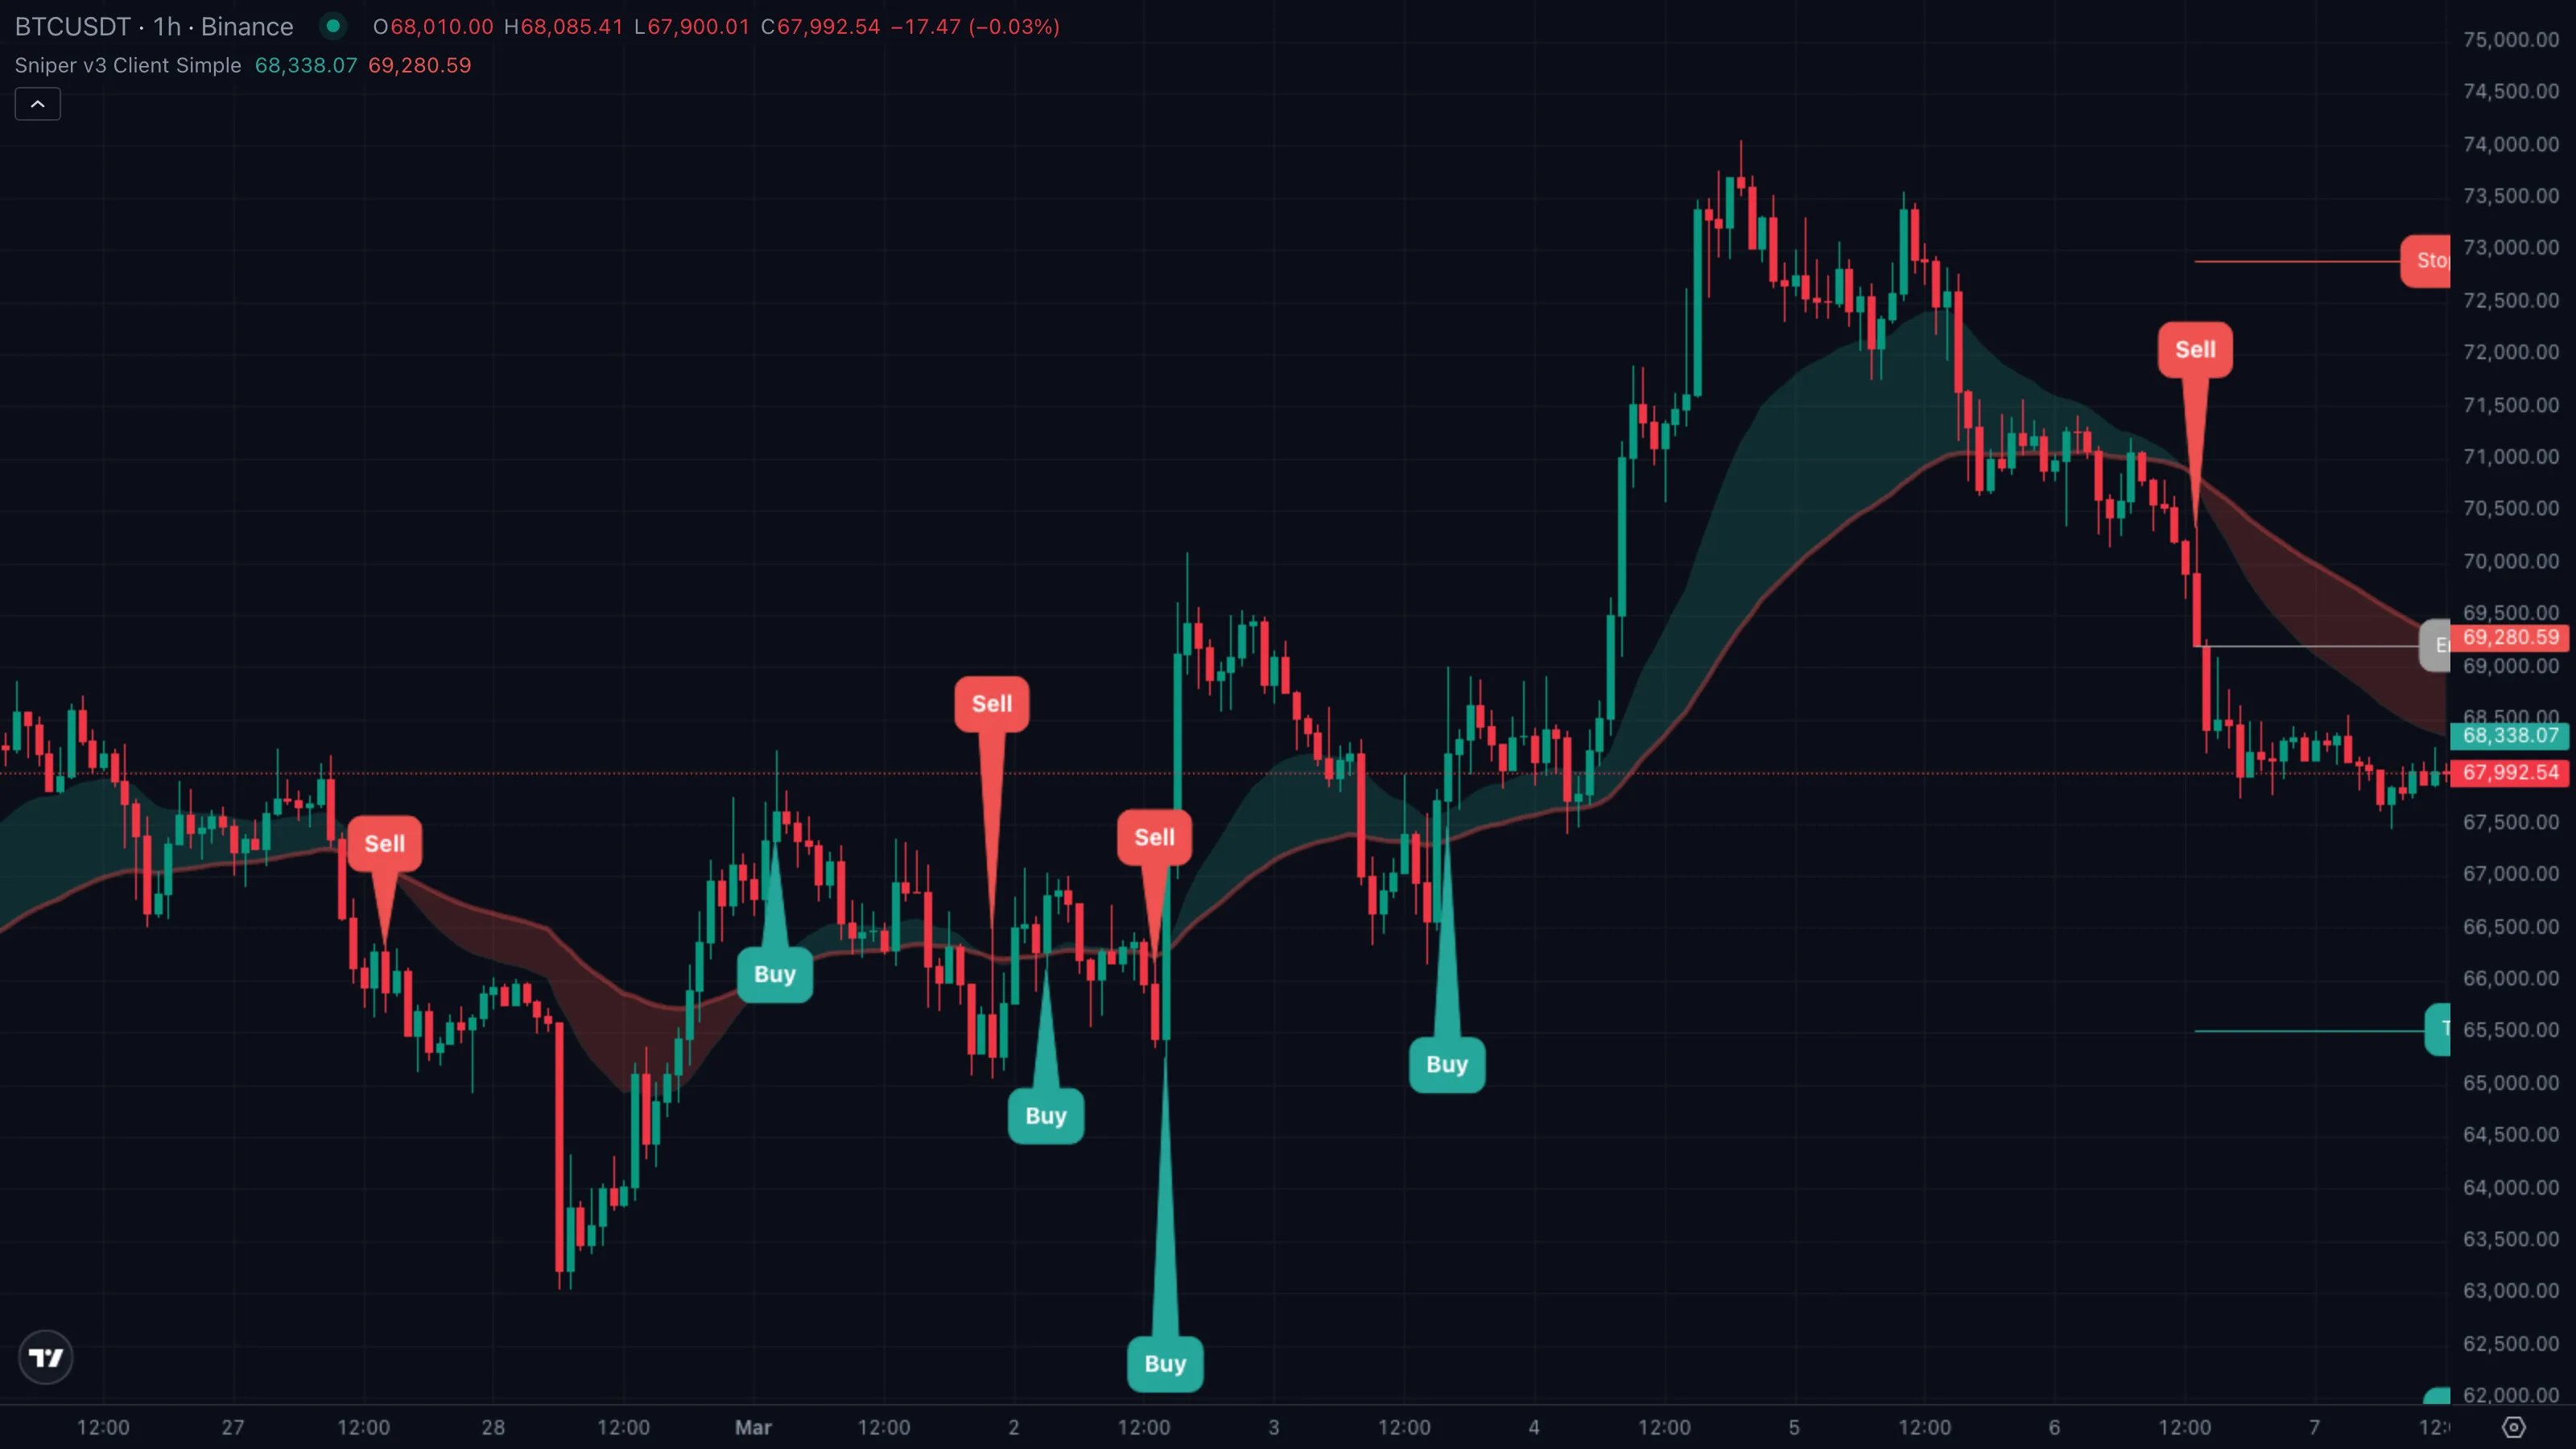
| Buy / Sell callout | Green bubble below or red bubble above the firing bar | A long or short signal fired |
| Entry line | Grey horizontal line with a grey tag | Trade's actual entry price |
| Stop-loss line | Red horizontal line with a red tag | Where the trade is invalidated |
| TP 1 to TP 5 lines | Five green horizontals, darker green once hit | The five risk-multiple profit targets |
| Smart Panel | Dashboard pinned bottom-right | Trend, RSIRelative Strength IndexA 0-to-100 momentum oscillator measuring the size of recent up-bars versus down-bars. Above 70 is hot, below 30 is cold, near 50 is neutral.Click for full definition →, volume, volatility, and four MTF rows |
The Trend Band is the slow read; the callouts and the level overlay are the trade. The Smart Panel is the sanity check.
4. Reading It in 3 Patterns
Pattern A — Clean sniper buy
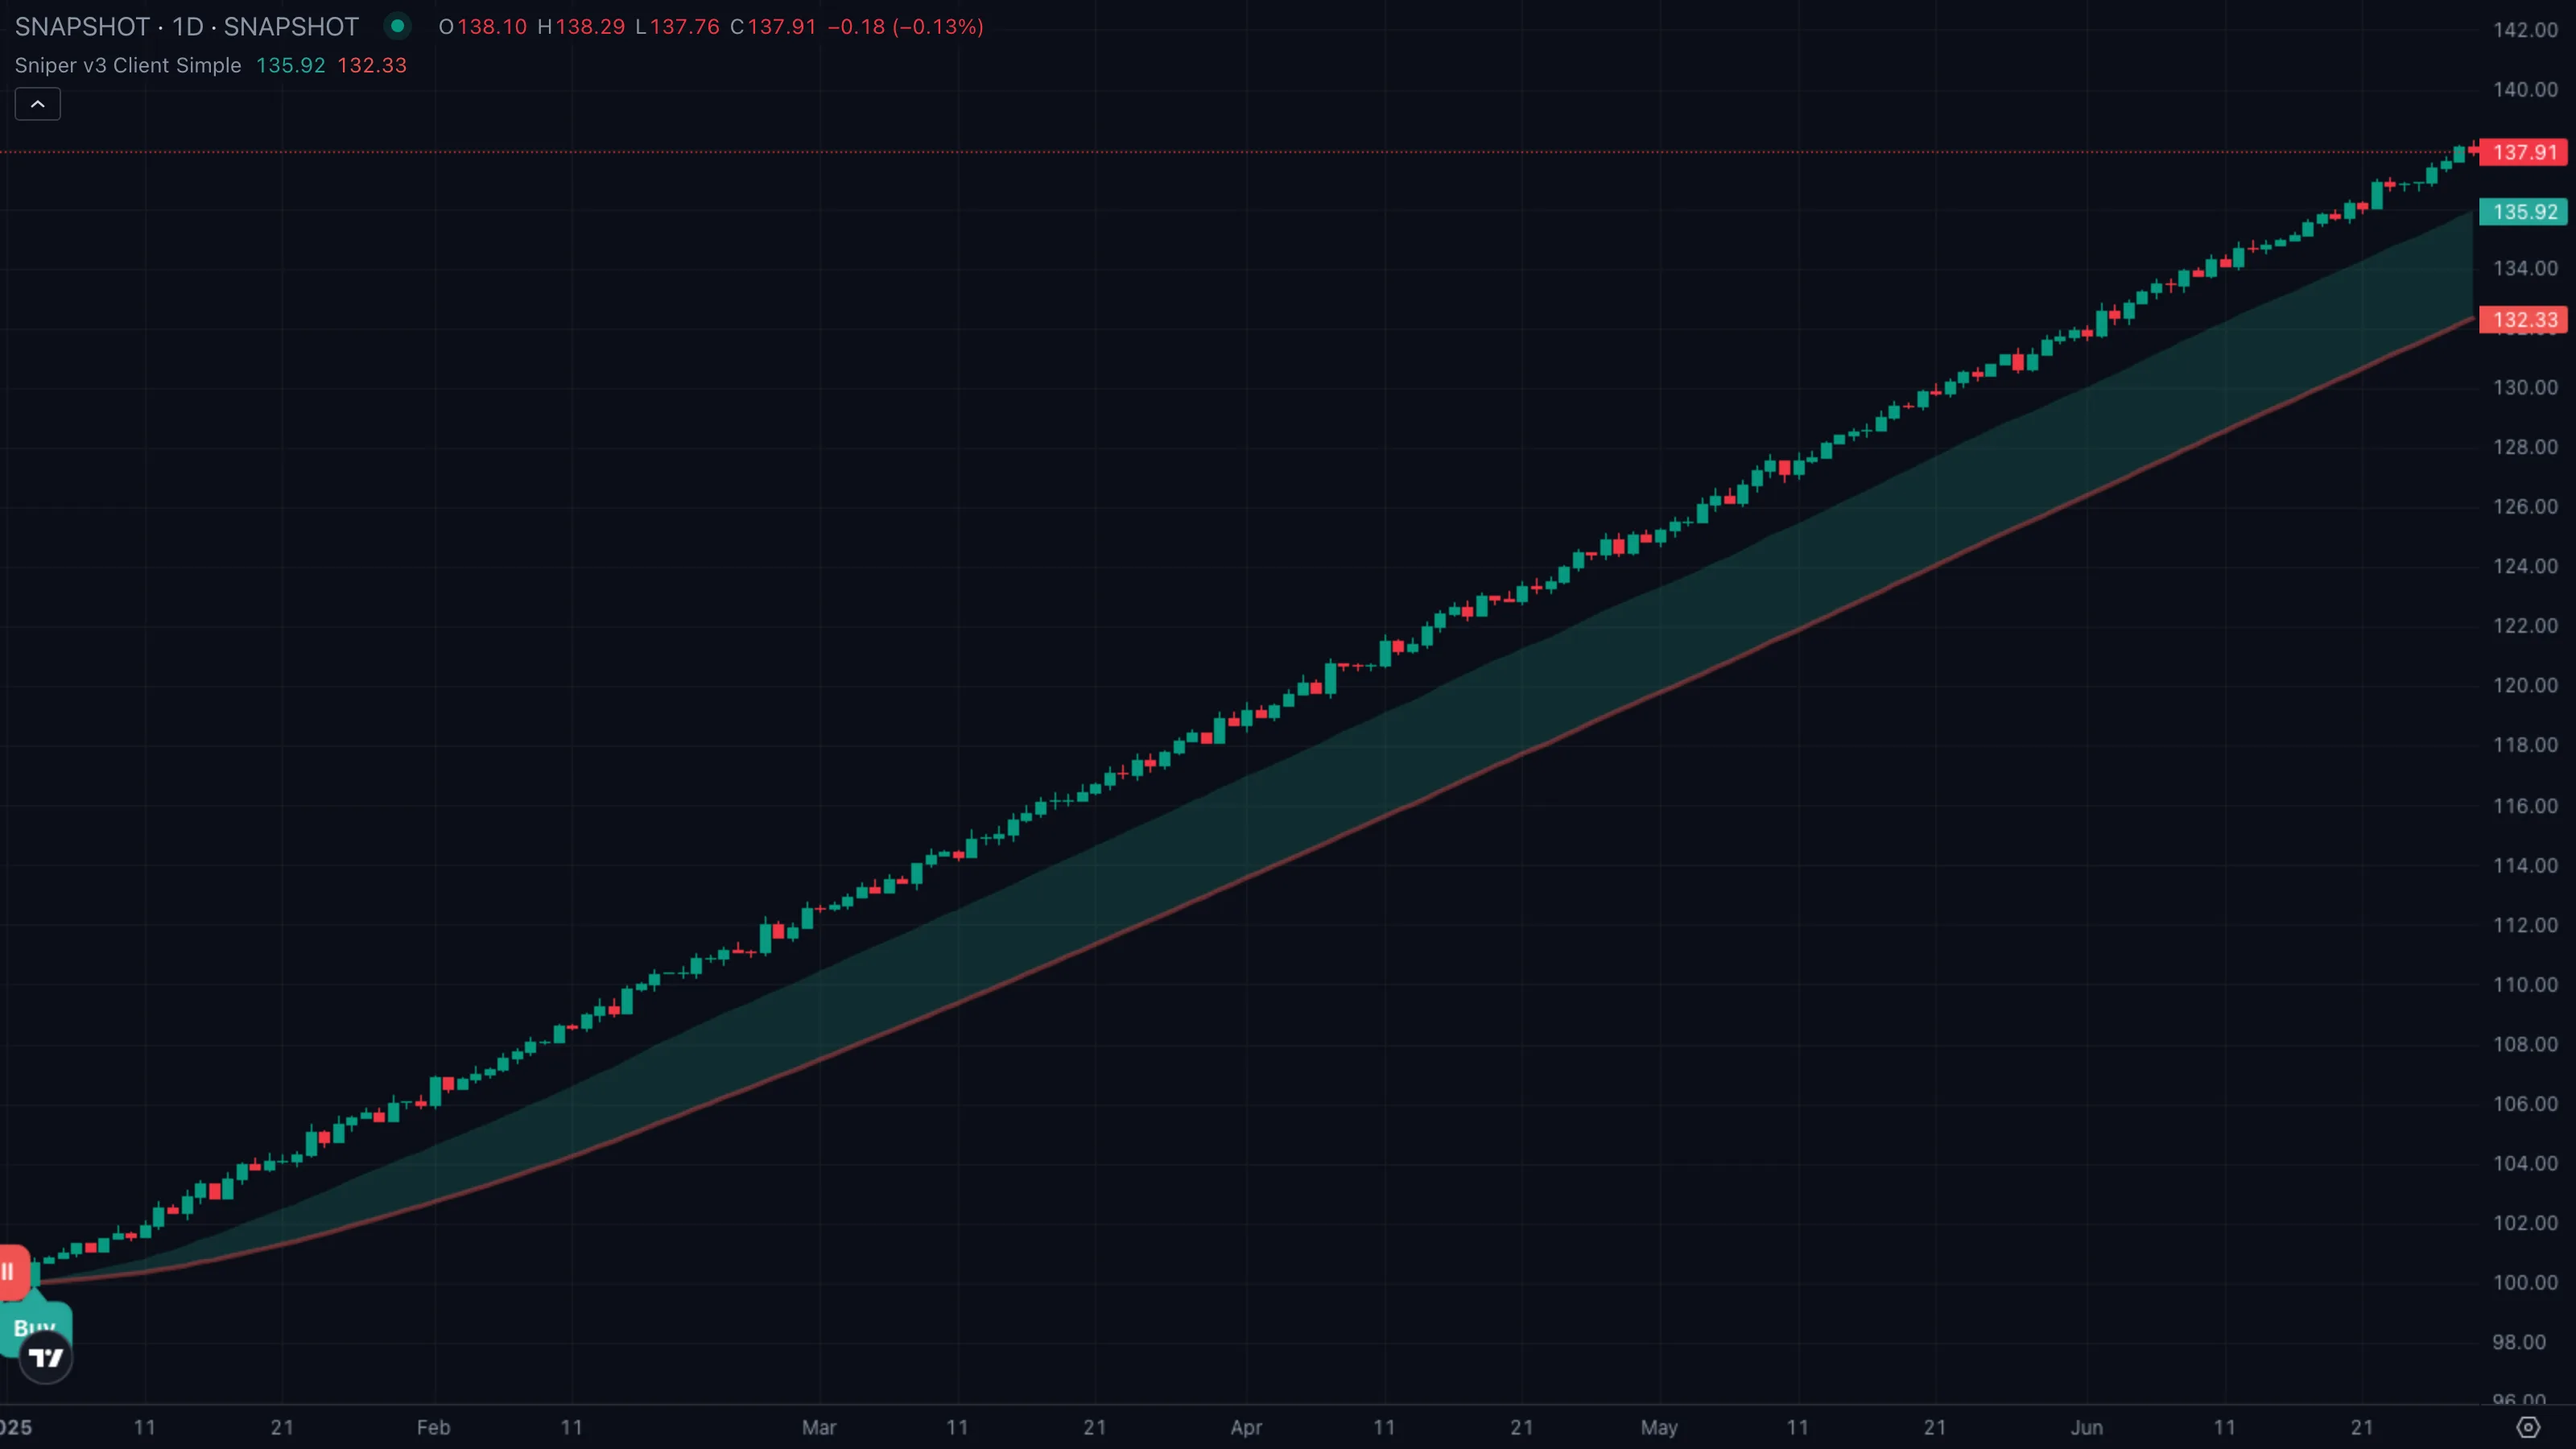
| What you see | ① Trend Band green ② four EMAs sort cleanly into a bullish fan ③ Buy callout prints below the firing bar ④ Entry, Stop-loss, and TP 1 to TP 5 lines extend to the right edge. |
| What it means | Regime and precision agree. Risk is already anchoredAnchored VWAPA VWAP that begins at a chosen pivot bar (a swing high or swing low) and runs forward. Anchoring makes the absolute level meaningful instead of drifting with whatever bars happen to load.Click for full definition → to the most recent close that broke against the trend, so you know exactly where you're wrong. |
| What to do | Take the entry. Honour the stop. Scale out at TP 1 (the stop tightens to break-even automatically) and let the rest run toward TP 3 to TP 5. |
Pattern B — Risk-anchoredAnchored VWAPA VWAP that begins at a chosen pivot bar (a swing high or swing low) and runs forward. Anchoring makes the absolute level meaningful instead of drifting with whatever bars happen to load.Click for full definition → entry with break-even slide
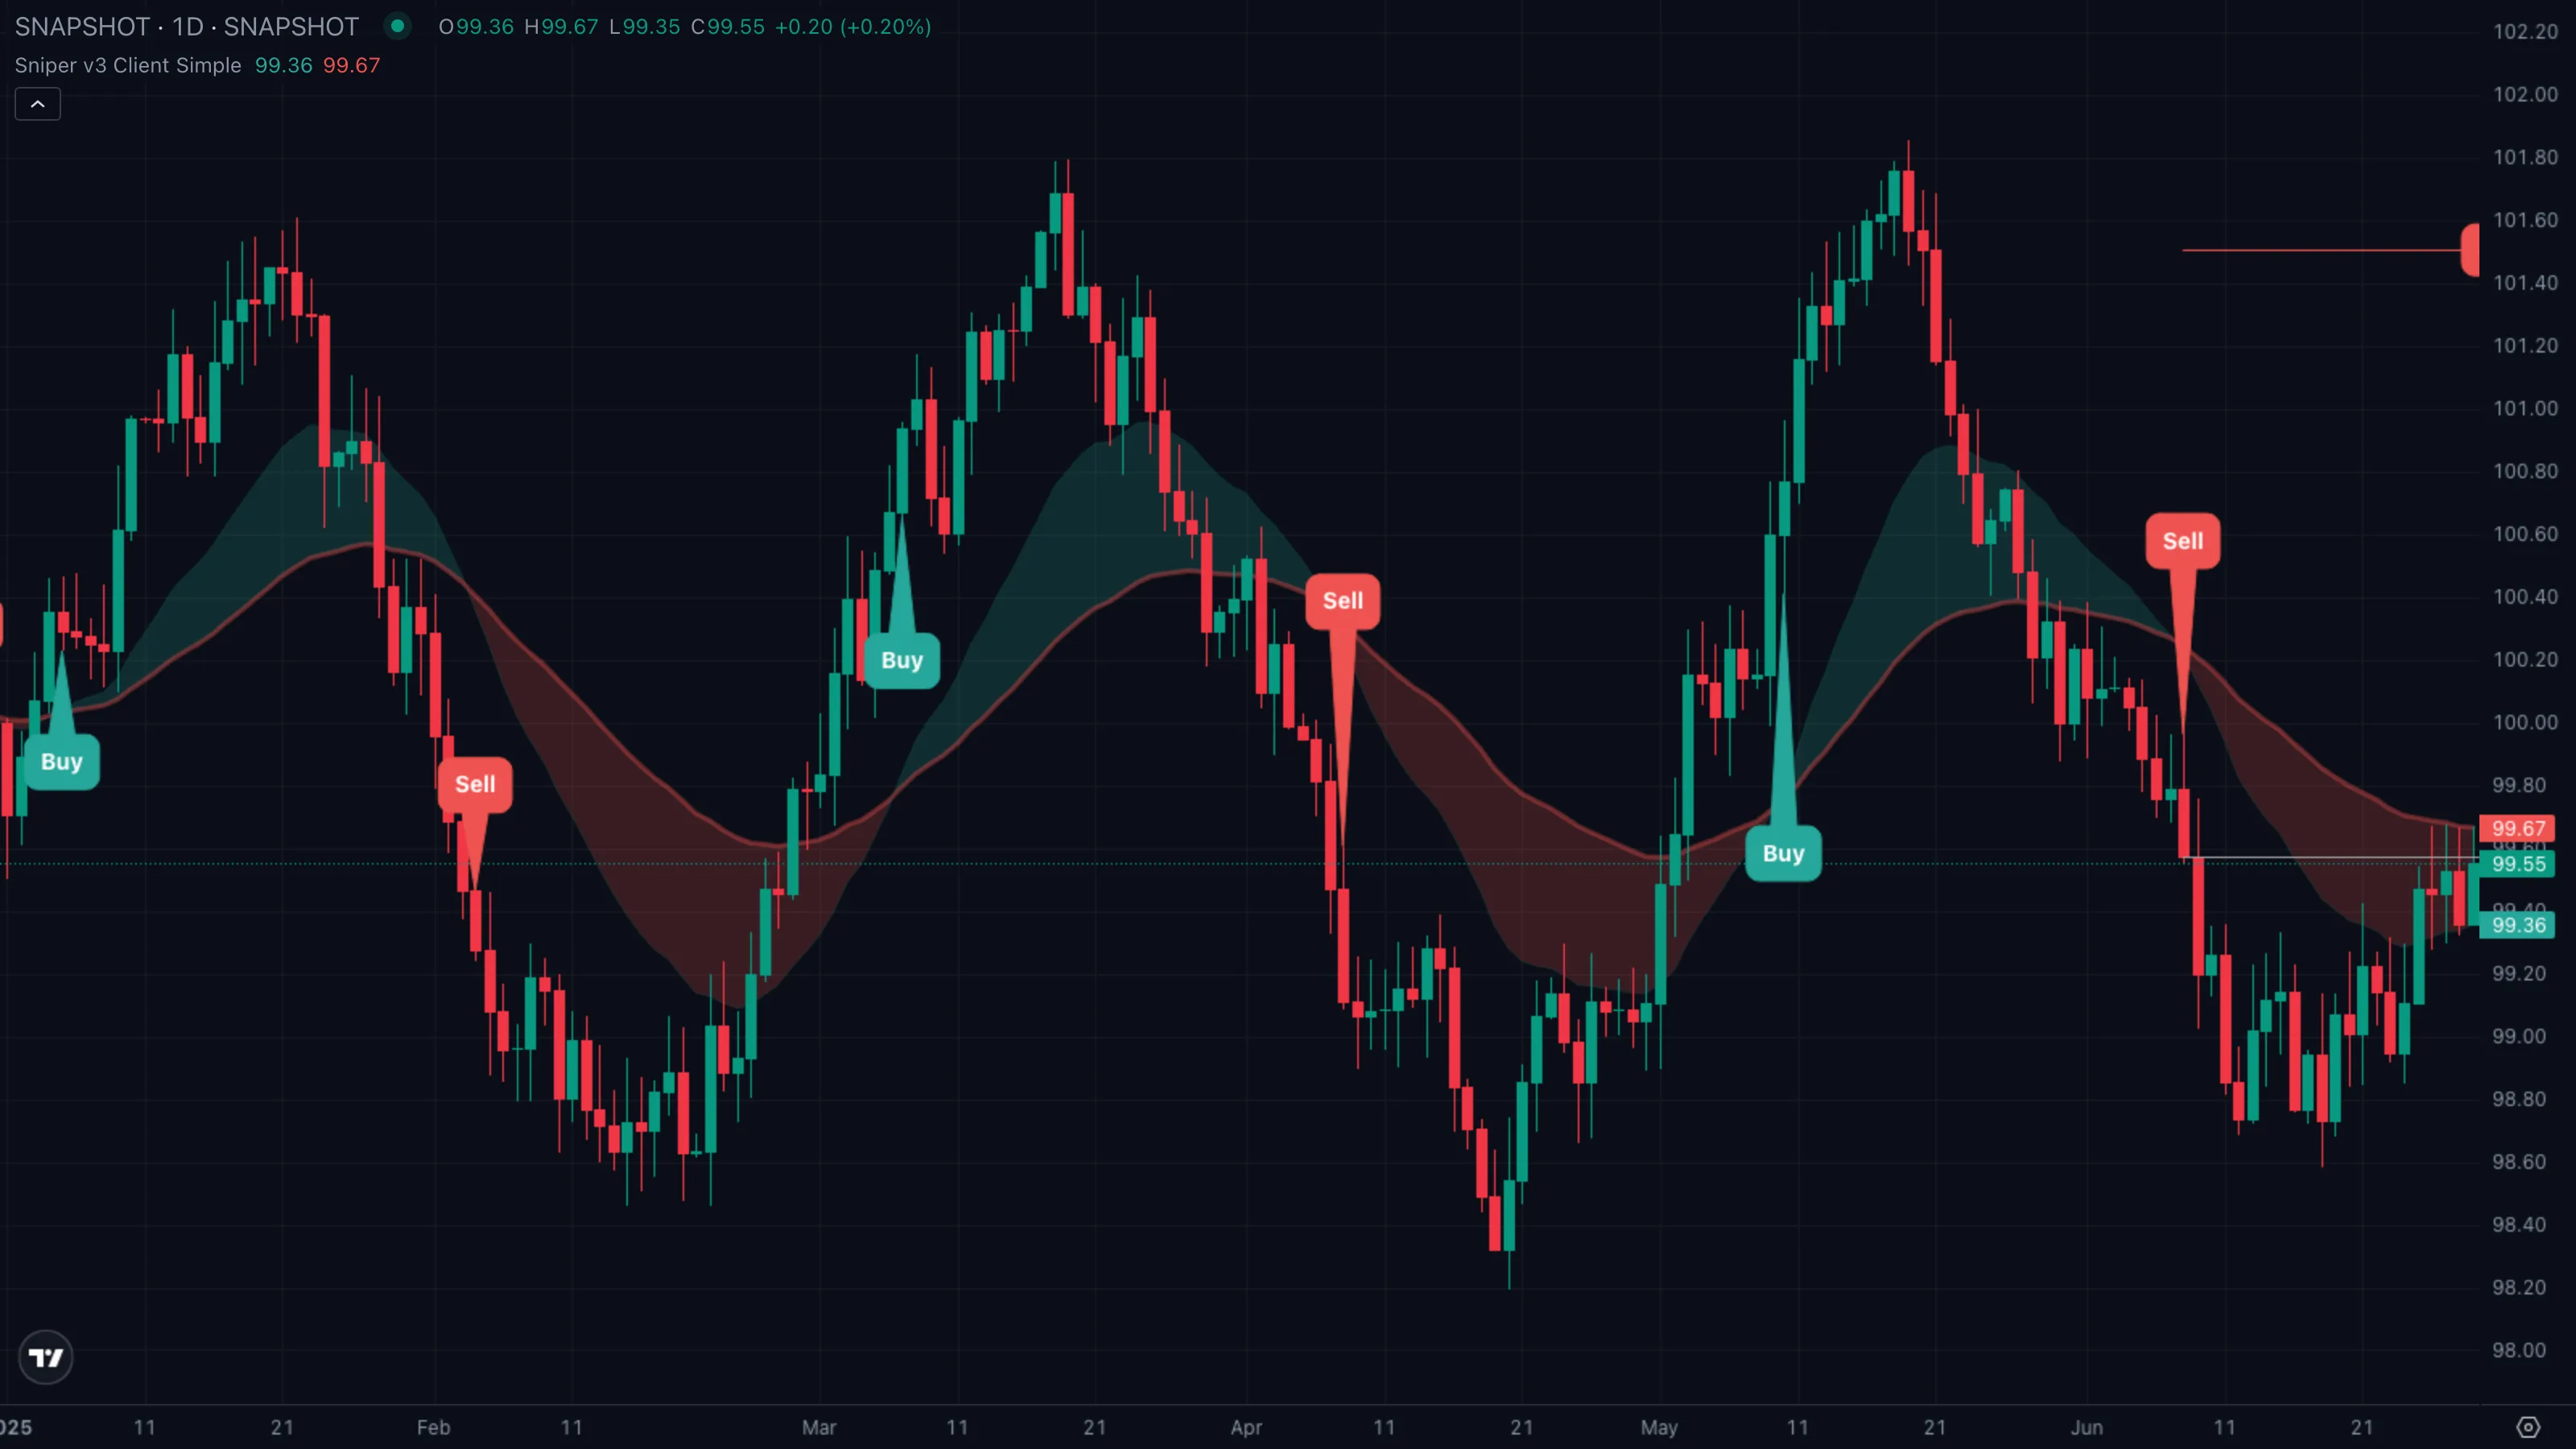
| What you see | ① Buy fires with stop pinned to the recent dip ② price tags TP 1 and that line darkens ③ the Stop-loss line jumps up to sit on the Entry line ④ price grinds toward TP 2 and TP 3. |
| What it means | The trade is now a free option. Worst case you exit flat; best case you ride higher TPs at zero residual risk. This is the structural pay-off Sniper v3 is built around. |
| What to do | Don't micromanage. The next decision point is a TP rung or the new stop — not a single red bar. |
Pattern C — Missed signal due to filter
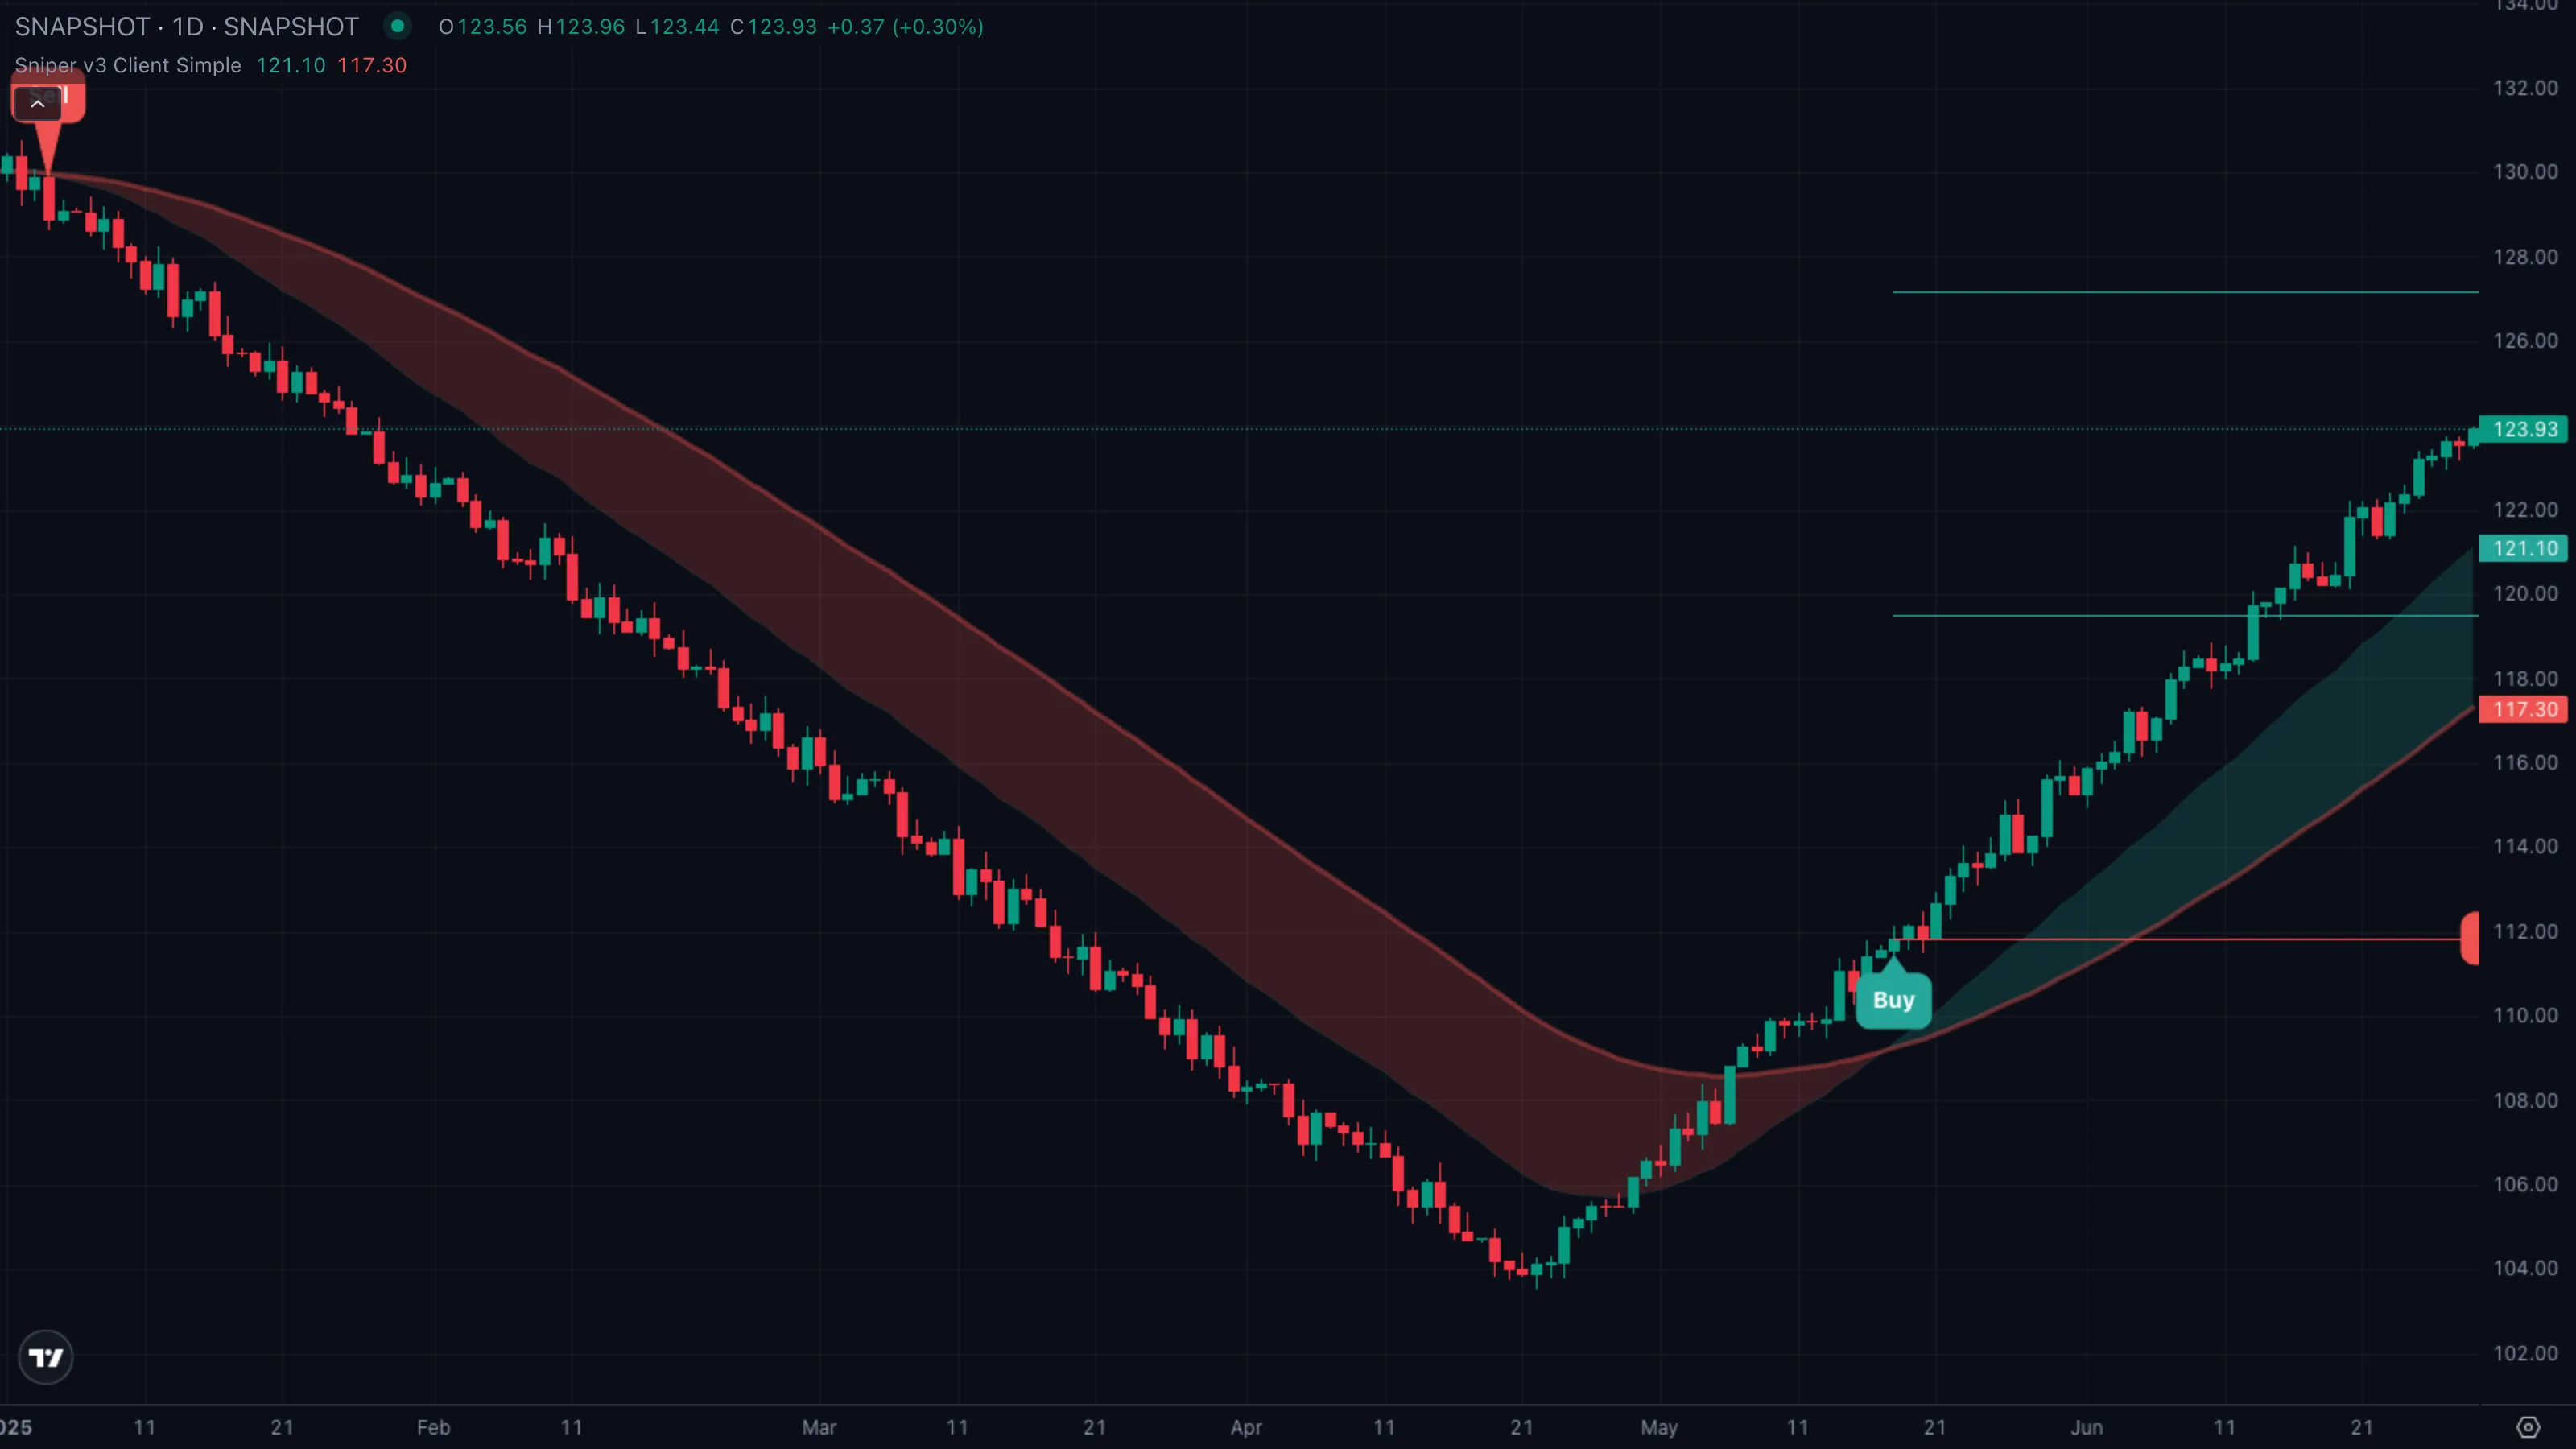
| What you see | ① Trend Band turns green and price drifts higher ② the four EMAs braid — EMAExponential Moving AverageA moving average that weights recent bars more heavily than old ones, so it reacts faster to fresh price action than a simple average of the same length.Click for full definition → 21 dips under EMAExponential Moving AverageA moving average that weights recent bars more heavily than old ones, so it reacts faster to fresh price action than a simple average of the same length.Click for full definition → 13, EMAExponential Moving AverageA moving average that weights recent bars more heavily than old ones, so it reacts faster to fresh price action than a simple average of the same length.Click for full definition → 8 pokes below EMAExponential Moving AverageA moving average that weights recent bars more heavily than old ones, so it reacts faster to fresh price action than a simple average of the same length.Click for full definition → 13 ③ no Buy callout ever prints. |
| What it means | The fan never sorted cleanly on a fresh bar. The band agreed with the move; the precision filter rejected it. The indicator only fires when all four EMAs line up — not when "it kind of looks bullish." |
| What to do | Skip without regret. Missing a move because the filter held is the trade-off that stops you chasing tangled drifts that collapse on the next bar. |
5. Trade Walkthrough
| Symbol | BTCUSDT |
|---|---|
| Timeframe | 1H |
| Venue | Binance |
| Window | 10 Mar to 22 Mar 2026 |
| Pattern | A — clean sniper buy with break-even slide |
A textbook Sniper v3 long. BTC drifted between 78,000 and 80,500 for the first half of the window with the four EMAs braided. On 14 March the fan locked into a clean bullish stack on a fresh bar and Sniper v3 printed a Buy at the close. The stop pinned to the 76,200 dip from earlier in the week — initial risk roughly 1,850 points. Price tagged TP 1 within a day, the stop slid to break-even automatically, and the runner reached TP 3 by 20 March for a clean 3RRisk Multiple (R)The distance from entry to stop expressed as one unit of risk. 1R = stop distance, 2R = twice stop distance.Click for full definition → outcome.
The sequence
| # | When | BTC price | Indicator state | What it tells you |
|---|---|---|---|---|
| ① | 10 Mar to 13 Mar | 78,000 to 80,500 chop | Band yellow-green, EMAs braided | Stand-aside regime. The fan never sorts cleanly, no signal. |
| ② | 14 Mar | ~78,050 close | Buy fires | Four-EMAExponential Moving AverageA moving average that weights recent bars more heavily than old ones, so it reacts faster to fresh price action than a simple average of the same length.Click for full definition → fan sorts bullish on a fresh bar. Entry, stop at 76,200, TPs from 79,900 to 87,300 print. |
| ③ | 15 Mar | ~79,900 high | TP 1 hit, stop slides to BE | First rung tags. Stop tightens to entry automatically. The trade is now a free option. |
| ④ | 20 Mar | ~83,600 high | TP 3 hit, runner active | Move captured roughly +7 % from entry, position still alive toward TP 4 and TP 5. |
The trade in one card
| What you skipped | Buying the chop bars on 11 to 13 March because the fan was tangled — exactly the trades the filter is designed to block. |
| What you took | The Buy on 14 March at ~78,050 with the stop pre-anchoredAnchored VWAPA VWAP that begins at a chosen pivot bar (a swing high or swing low) and runs forward. Anchoring makes the absolute level meaningful instead of drifting with whatever bars happen to load.Click for full definition → at 76,200 (no guesswork). |
| Where you exited | TP 3 at ~83,600, with TP 1 and TP 2 already booked along the way and the stop at break-even on the runner. |
| Move captured | ~ +7.1 % in roughly six days, 3RRisk Multiple (R)The distance from entry to stop expressed as one unit of risk. 1R = stop distance, 2R = twice stop distance.Click for full definition → on the risk you defined at entry. |
Lesson
The clean four-EMAExponential Moving AverageA moving average that weights recent bars more heavily than old ones, so it reacts faster to fresh price action than a simple average of the same length.Click for full definition → fan on a fresh bar gives you the alert. The pre-anchoredAnchored VWAPA VWAP that begins at a chosen pivot bar (a swing high or swing low) and runs forward. Anchoring makes the absolute level meaningful instead of drifting with whatever bars happen to load.Click for full definition → stop and five TPs turn the alert into a tradeable plan. The automatic break-even slide after TP 1 is what lets the runner work without you watching every candle.
6. Common Pitfalls
- Reading the Trend Band as a signal. The green or red fill is a regime read, not a trade. Plenty of bars are green without ever firing a Buy because the four-EMAExponential Moving AverageA moving average that weights recent bars more heavily than old ones, so it reacts faster to fresh price action than a simple average of the same length.Click for full definition → fan never sorts cleanly. No callout, no Sniper v3 long.
- Moving the stop manually. The stop is anchoredAnchored VWAPA VWAP that begins at a chosen pivot bar (a swing high or swing low) and runs forward. Anchoring makes the absolute level meaningful instead of drifting with whatever bars happen to load.Click for full definition → to the most recent close that broke against the trend. Pulling it tighter "to feel safer" defeats the geometry — clean sniper trades often wick into the original stop area once before working. Trust the level; after TP 1 the indicator slides it to break-even on its own.
- Bailing at TP 1. Closing the whole position at TP 1 turns a 3RRisk Multiple (R)The distance from entry to stop expressed as one unit of risk. 1R = stop distance, 2R = twice stop distance.Click for full definition → or 4R trade into a 1RRisk Multiple (R)The distance from entry to stop expressed as one unit of risk. 1R = stop distance, 2R = twice stop distance.Click for full definition → trade. The structureMarket StructureThe pattern of swing highs and lows price prints as it moves. Healthy uptrends print higher highs and higher lows; healthy downtrends print the mirror.Click for full definition → is built so the runner toward TP 3 to TP 5 is a free option once TP 1 hits and the stop has tightened.
- Ignoring the MTF rows in the Smart Panel. A 1H Buy is higher quality when 4H and Daily are also Bullish. When higher timeframes disagree, the runner targets are less likely to fill — size down or skip.
- Trading every signal in chop. When Volatility reads Ranging and RSIRelative Strength IndexA 0-to-100 momentum oscillator measuring the size of recent up-bars versus down-bars. Above 70 is hot, below 30 is cold, near 50 is neutral.Click for full definition → is mid-range, fan stacks tend to undo themselves within a few bars. Pattern C's "missed signal" is the honest outcome; forcing a trade in chop usually pays the stop.