

Strong Buy Strong Sell
A high-conviction signal printer that only fires when a fast trend flip, a slower baseline, and a tiny short-term smoothing pair all agree — designed to keep you out of the chop other indicators get caught in.
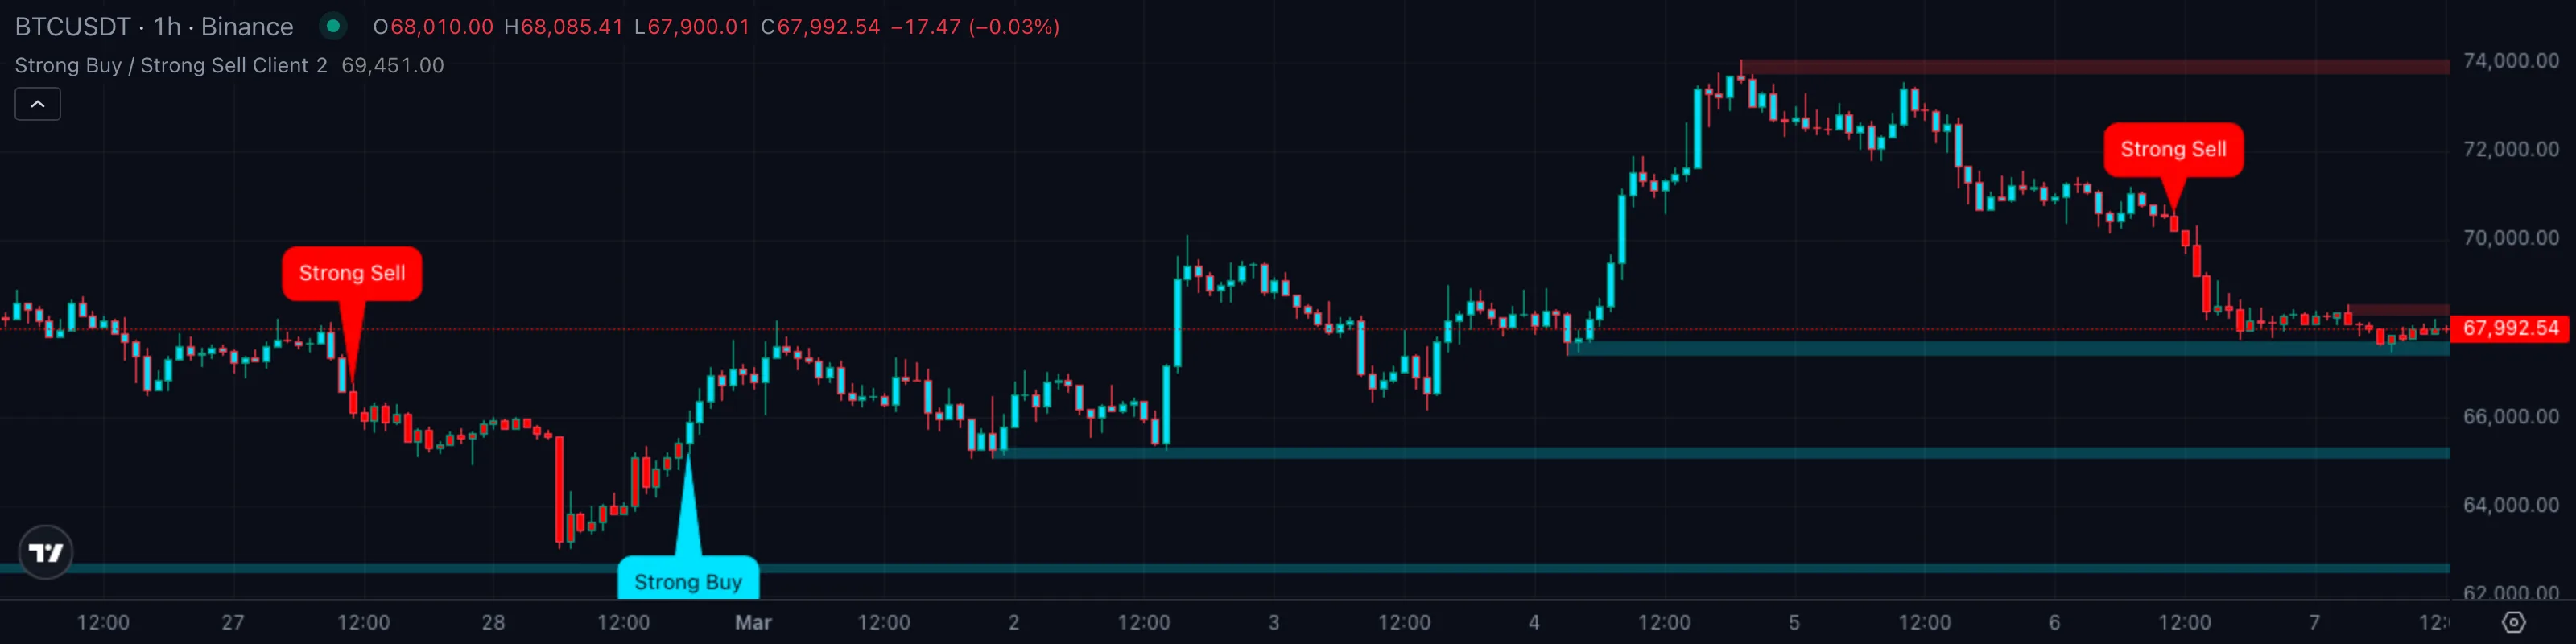
1. What This Indicator Watches For
Most signal indicators have the same problem: they fire too often. A simple moving-average cross will paint a "buy" arrow on every minor wiggle, and after a few weeks of watching arrows that go nowhere, you stop trusting them. The fix isn't a smarter cross — it's a stack of filters that all have to agree before anything is allowed onto the chart.
Two practical questions every trend trader asks before pulling the trigger:
- Did the trend actually flip, or is price just poking through a line for a single bar?
- Is the broader regime confirming the same direction, or am I about to fight a bigger trend?
Strong Buy Strong Sell answers both at once. It uses a SupertrendSupertrendA trailing line set above or below price using an ATR multiple. When close crosses it, the line flips to the opposite side and signals a regime change.Click for full definition → cross as the trigger, a longer SMASimple Moving AverageThe plain arithmetic mean of the last N closing prices. Reacts slower than an EMA of the same length because every bar in the window has equal weight.Click for full definition → as a regime gate, and a fast SMASimple Moving AverageThe plain arithmetic mean of the last N closing prices. Reacts slower than an EMA of the same length because every bar in the window has equal weight.Click for full definition → pair as a tie-breaker for "Strong" vs "Normal" — and it only paints a label when all three line up. The result is far fewer arrows on the chart, but each one carries real weight. Supply and demandSupply and Demand ZoneA horizontal band drawn at a recent swing extreme where buyers (demand) or sellers (supply) last took control. Treated as likely support or resistance until price closes through it.Click for full definition → boxes appear at the same time so you can see where price is likely to react on the way to the next signal.
2. How It Works Under the Hood
Three engines run in parallel and the chart shows you the verdict, not the inputs:
- The Trigger (SupertrendSupertrendA trailing line set above or below price using an ATR multiple. When close crosses it, the line flips to the opposite side and signals a regime change.Click for full definition → cross). A SupertrendSupertrendA trailing line set above or below price using an ATR multiple. When close crosses it, the line flips to the opposite side and signals a regime change.Click for full definition → line built on ATRAverage True RangeA measure of typical bar-to-bar volatility. ATR rises when bars get bigger; many indicators use it as a noise floor — they only fire when a move clears a multiple of ATR.Click for full definition → length 11 with a sensitivity multiplier of 2 (final factor of 4) tracks price from above in downtrends and from below in uptrends. The exact moment the close crosses through the line is the trigger — every signal starts here. Without a fresh cross there is no label, full stop.
- The Regime Gate (SMASimple Moving AverageThe plain arithmetic mean of the last N closing prices. Reacts slower than an EMA of the same length because every bar in the window has equal weight.Click for full definition → 13). A 13-bar simple moving averageSimple Moving AverageThe plain arithmetic mean of the last N closing prices. Reacts slower than an EMA of the same length because every bar in the window has equal weight.Click for full definition → acts as a one-question sanity check. A buy is only allowed if the close is at or above SMASimple Moving AverageThe plain arithmetic mean of the last N closing prices. Reacts slower than an EMA of the same length because every bar in the window has equal weight.Click for full definition → 13. A sell is only allowed if the close is at or below SMASimple Moving AverageThe plain arithmetic mean of the last N closing prices. Reacts slower than an EMA of the same length because every bar in the window has equal weight.Click for full definition → 13. If the trigger fires while price is on the wrong side of this gate, the signal is silently rejected — that's the indicator's main false-positive filter.
- The Strength Tie-Breaker (SMASimple Moving AverageThe plain arithmetic mean of the last N closing prices. Reacts slower than an EMA of the same length because every bar in the window has equal weight.Click for full definition → 8 vs SMASimple Moving AverageThe plain arithmetic mean of the last N closing prices. Reacts slower than an EMA of the same length because every bar in the window has equal weight.Click for full definition → 9). Once a signal passes the gate, the indicator looks at the relationship between an 8-period SMASimple Moving AverageThe plain arithmetic mean of the last N closing prices. Reacts slower than an EMA of the same length because every bar in the window has equal weight.Click for full definition → and a 9-period SMASimple Moving AverageThe plain arithmetic mean of the last N closing prices. Reacts slower than an EMA of the same length because every bar in the window has equal weight.Click for full definition →. If the faster SMASimple Moving AverageThe plain arithmetic mean of the last N closing prices. Reacts slower than an EMA of the same length because every bar in the window has equal weight.Click for full definition → is above the slower one on a buy bar, the label upgrades from "Buy" to "Strong Buy." Same logic on the sell side, mirrored. The two SMAs are very close in length so this isn't really a trend test — it's a check that short-term smoothing is leaning the same way as the trigger.
How the label picks its wording. Every bar, the indicator asks two simple questions:
- Did the close just cross the SupertrendSupertrendA trailing line set above or below price using an ATR multiple. When close crosses it, the line flips to the opposite side and signals a regime change.Click for full definition → line, with the regime gate agreeing? If no, nothing is printed. If yes, this becomes a Buy or a Sell candidate.
- Is the very-short SMASimple Moving AverageThe plain arithmetic mean of the last N closing prices. Reacts slower than an EMA of the same length because every bar in the window has equal weight.Click for full definition → pair leaning the same way as the trigger? If yes, the label upgrades to Strong. If not, it stays at the Normal level.
The four possible outcomes:
| What you're seeing | Label | Plain English |
|---|---|---|
| Cross up, regime confirms, short SMAs aligned bullish | 🟢 Strong Buy | All three engines agree on the long side |
| Cross up, regime confirms, short SMAs not yet aligned | 🟢 Buy | Trigger and gate agree, fine-grain smoothing is lagging |
| Cross down, regime confirms, short SMAs aligned bearish | 🔴 Strong Sell | All three engines agree on the short side |
| Cross down, regime confirms, short SMAs not yet aligned | 🔴 Sell | Trigger and gate agree, fine-grain smoothing is lagging |
| Cross fires but regime disagrees | 🟡 No label | Filter rejected the trigger — stand aside |
The regime gate is the whole reason this indicator behaves so differently from a vanilla SupertrendSupertrendA trailing line set above or below price using an ATR multiple. When close crosses it, the line flips to the opposite side and signals a regime change.Click for full definition →. A naked SupertrendSupertrendA trailing line set above or below price using an ATR multiple. When close crosses it, the line flips to the opposite side and signals a regime change.Click for full definition → will flip you long inside a downtrend the instant a single counter-trend bar pokes through it; the SMASimple Moving AverageThe plain arithmetic mean of the last N closing prices. Reacts slower than an EMA of the same length because every bar in the window has equal weight.Click for full definition → 13 gate quietly throws those flips away. What survives onto the chart has already passed two independent agreement checks.
3. What You See on the Chart
| Element | Looks like | Means |
|---|---|---|
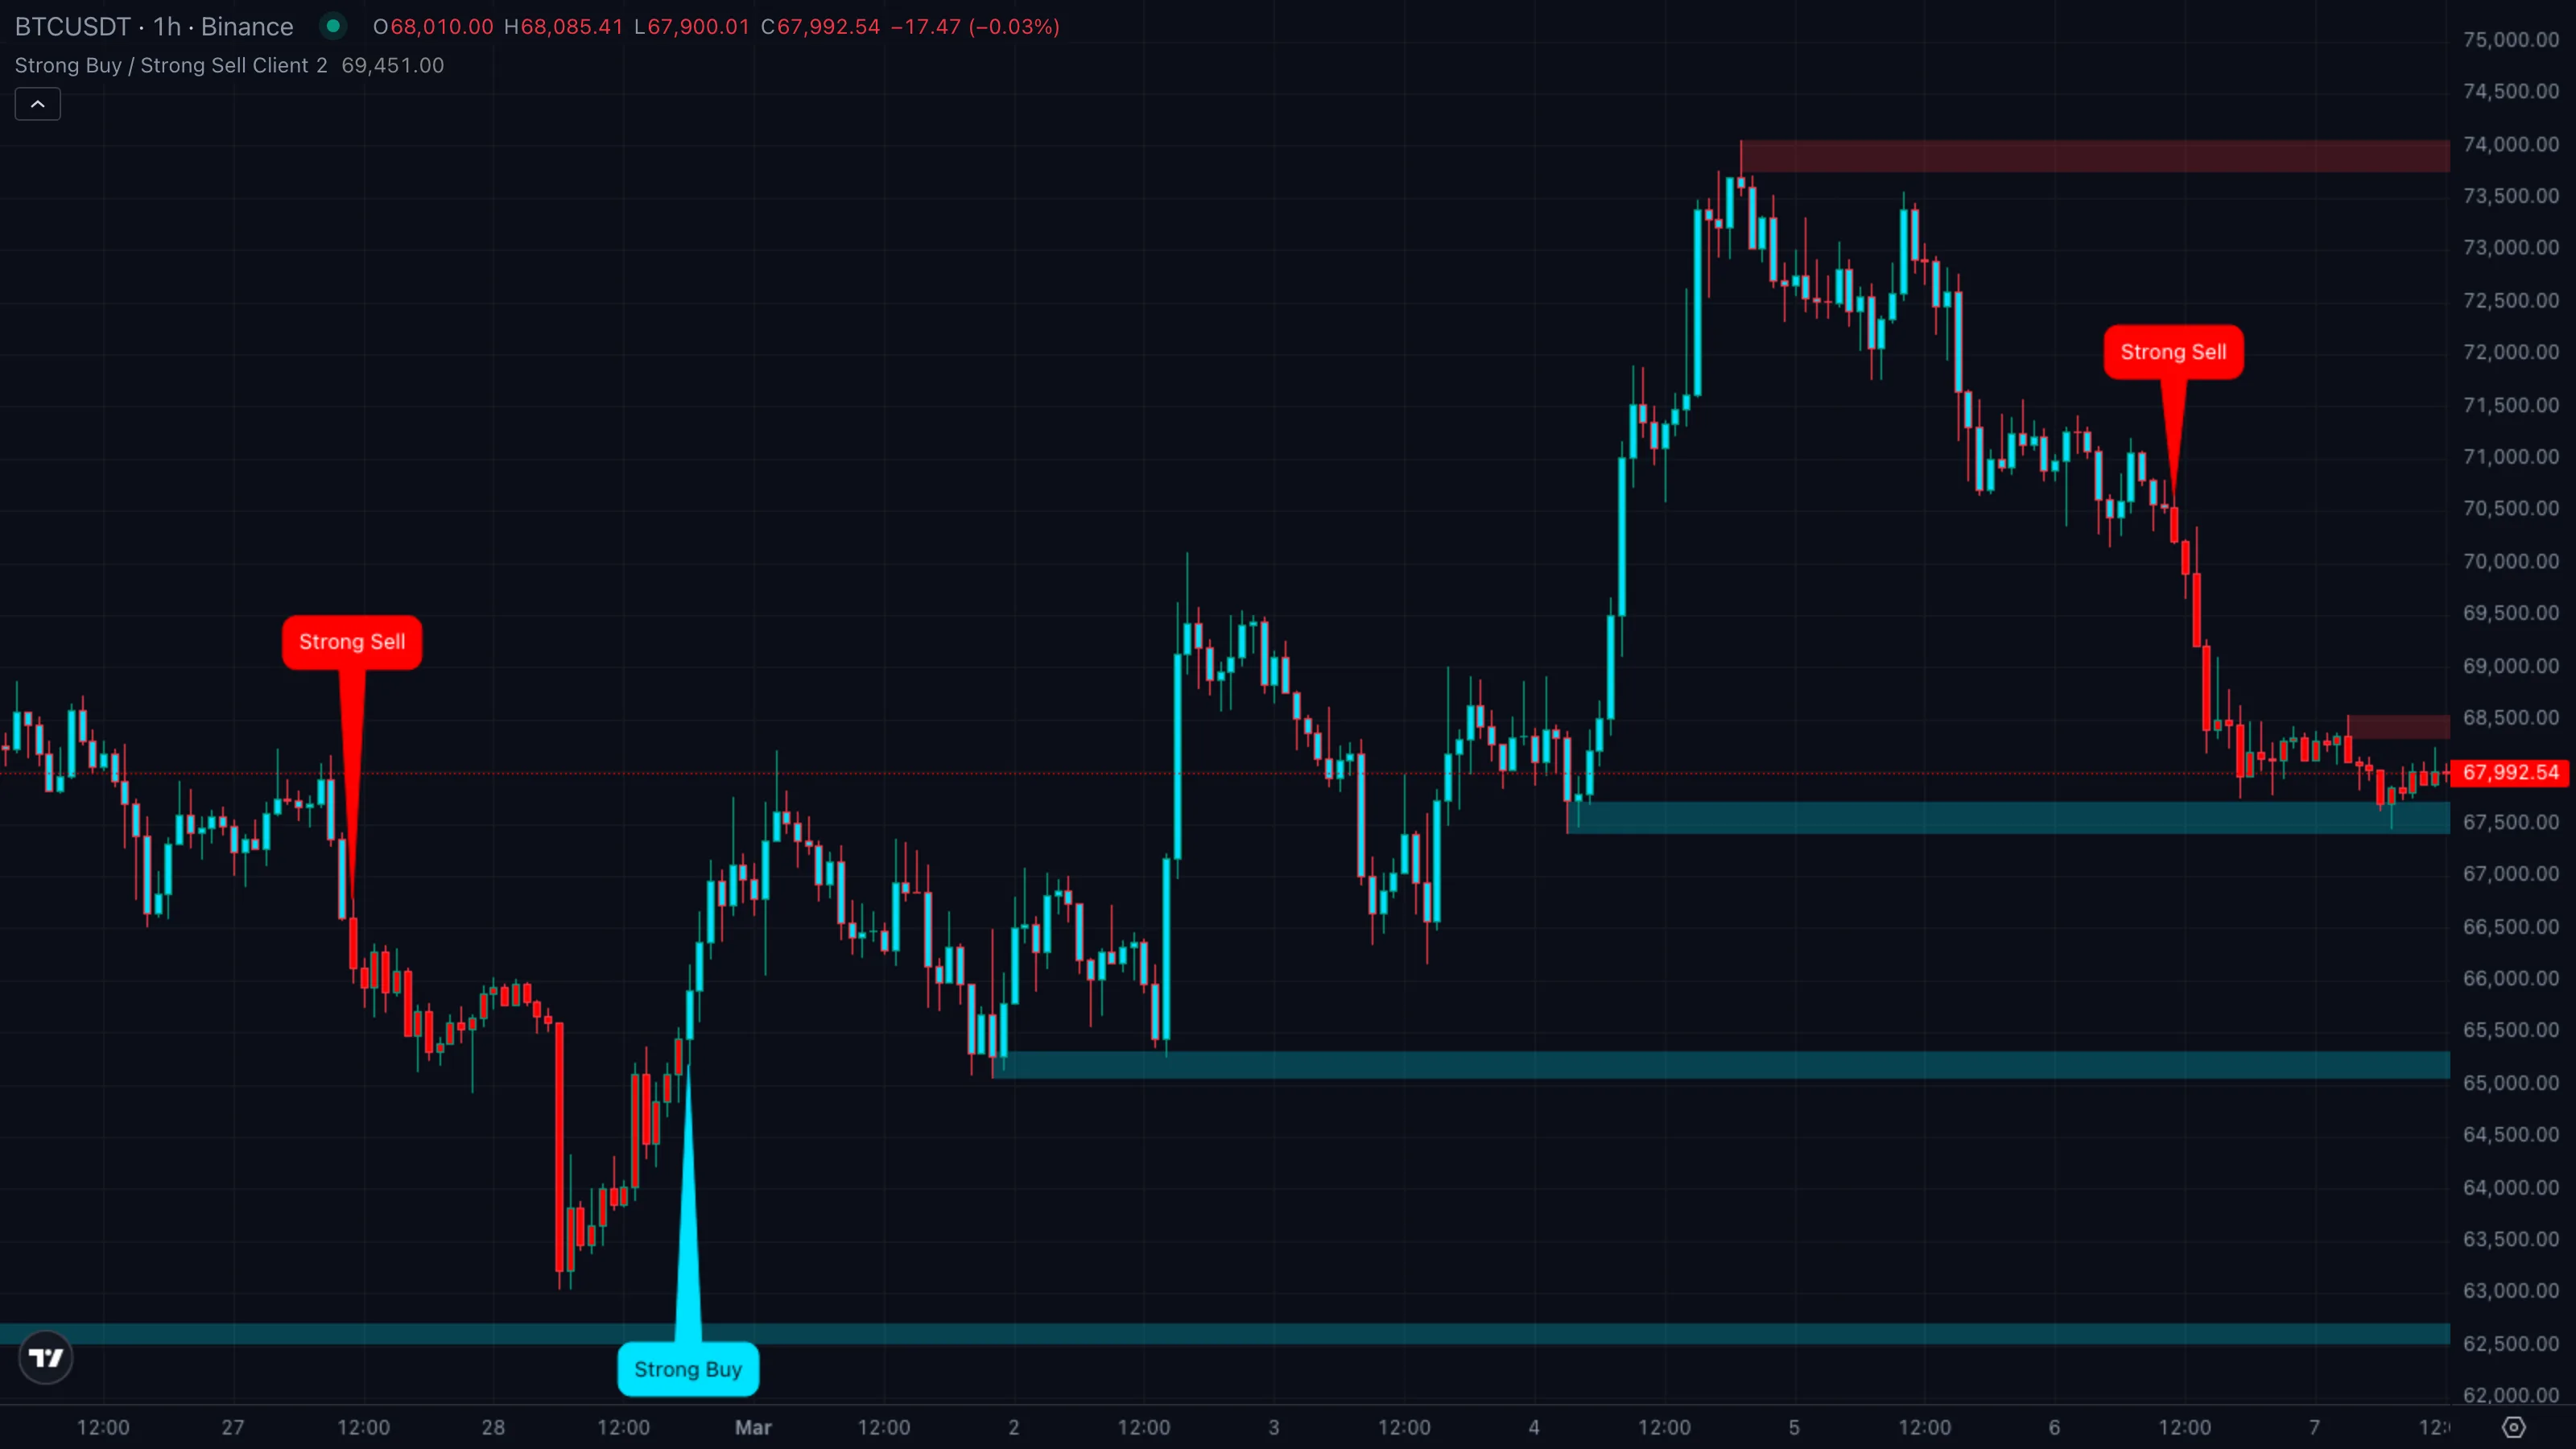
| Strong Buy callout | Cyan bubble below the bar with dark text | All three engines agreed on the long side |
| Buy callout | Cyan bubble below the bar, lighter wording | Trigger and regime agreed, strength tie-breaker did not |
| Strong Sell callout | Red bubble above the bar with white text | All three engines agreed on the short side |
| Sell callout | Red bubble above the bar, lighter wording | Trigger and regime agreed, strength tie-breaker did not |
| Bar coloring | Cyan candles when above SupertrendSupertrendA trailing line set above or below price using an ATR multiple. When close crosses it, the line flips to the opposite side and signals a regime change.Click for full definition →, red when below | Direction of the underlying trigger line at every bar |
| Demand zoneSupply and Demand ZoneA horizontal band drawn at a recent swing extreme where buyers (demand) or sellers (supply) last took control. Treated as likely support or resistance until price closes through it.Click for full definition → | Cyan rectangle extending right from a swing lowSwing High and Swing LowThe most recent confirmed pivot in either direction. Swing highs cap rallies until broken; swing lows support pullbacks until broken.Click for full definition → | Recent area where buyers stepped in — likely support |
| Supply zoneSupply and Demand ZoneA horizontal band drawn at a recent swing extreme where buyers (demand) or sellers (supply) last took control. Treated as likely support or resistance until price closes through it.Click for full definition → | Red rectangle extending right from a swing highSwing High and Swing LowThe most recent confirmed pivot in either direction. Swing highs cap rallies until broken; swing lows support pullbacks until broken.Click for full definition → | Recent area where sellers stepped in — likely resistance |
| No label on a bar | Plain coloured candle, nothing else | Either no cross, or the cross was rejected by a filter |
The supply and demandSupply and Demand ZoneA horizontal band drawn at a recent swing extreme where buyers (demand) or sellers (supply) last took control. Treated as likely support or resistance until price closes through it.Click for full definition → zones are drawn at the most recent qualifying swing extremes and stay on the chart until price closes through them — at which point the zone is treated as broken and removed.
4. Reading It in 3 Patterns
Pattern A — Strong Buy fires and the trend follows through
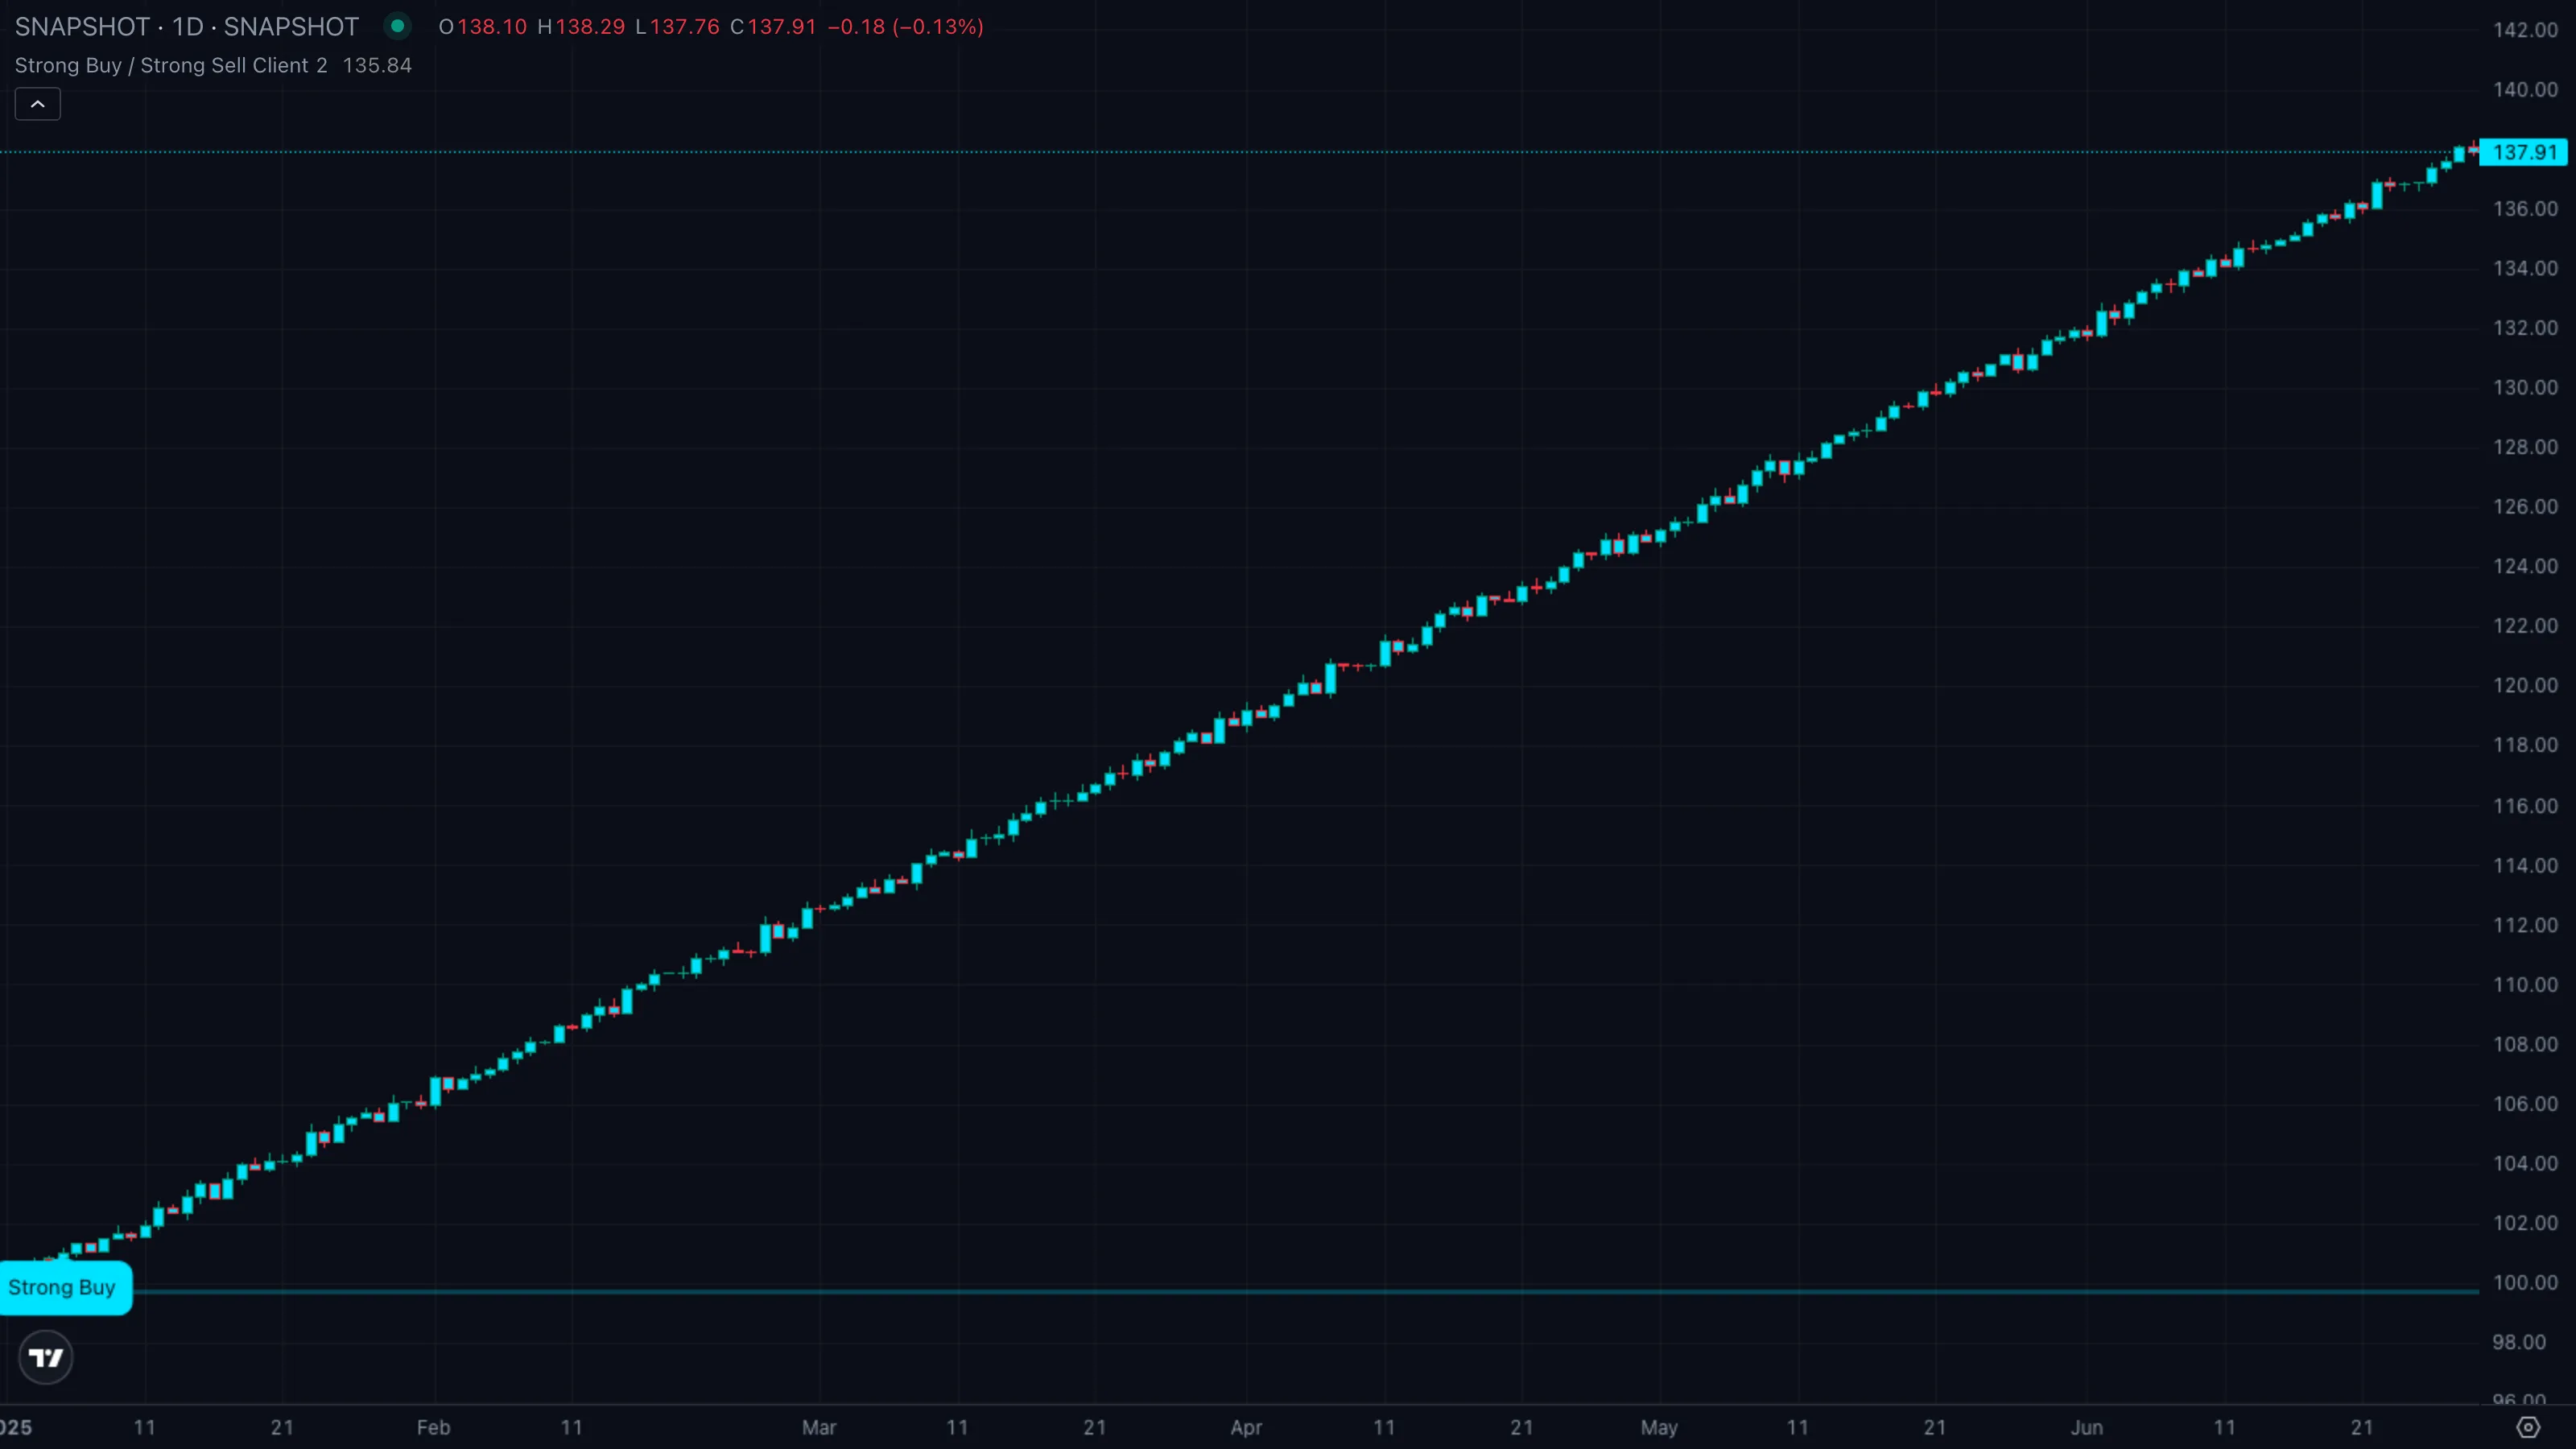
| What you see | ① Price stretches above the SupertrendSupertrendA trailing line set above or below price using an ATR multiple. When close crosses it, the line flips to the opposite side and signals a regime change.Click for full definition → line for the first time in days ② a cyan Strong Buy callout prints under the cross bar ③ candles step higher and tag the previous supply zoneSupply and Demand ZoneA horizontal band drawn at a recent swing extreme where buyers (demand) or sellers (supply) last took control. Treated as likely support or resistance until price closes through it.Click for full definition → overhead. |
| What it means | All three engines agreed at the same bar. Trigger fired, the close was sitting comfortably above SMASimple Moving AverageThe plain arithmetic mean of the last N closing prices. Reacts slower than an EMA of the same length because every bar in the window has equal weight.Click for full definition → 13, and short-term smoothing was already leaning bullish. The label is the indicator's most-confident long signal. |
| What to do | Bias long. The cleanest entry is the first pullbackPullback (Retracement)A short, counter-trend move within an established trend — buyers (or sellers) momentarily losing ground before the trend resumes. Often the lowest-risk place to enter the trend.Click for full definition → after the callout, ideally into the nearest demand zoneSupply and Demand ZoneA horizontal band drawn at a recent swing extreme where buyers (demand) or sellers (supply) last took control. Treated as likely support or resistance until price closes through it.Click for full definition → or back to the SupertrendSupertrendA trailing line set above or below price using an ATR multiple. When close crosses it, the line flips to the opposite side and signals a regime change.Click for full definition → line. Trail stops under the demand zoneSupply and Demand ZoneA horizontal band drawn at a recent swing extreme where buyers (demand) or sellers (supply) last took control. Treated as likely support or resistance until price closes through it.Click for full definition → or under SMASimple Moving AverageThe plain arithmetic mean of the last N closing prices. Reacts slower than an EMA of the same length because every bar in the window has equal weight.Click for full definition → 13. |
Pattern B — No signal in chop, suppressed by the regime filter
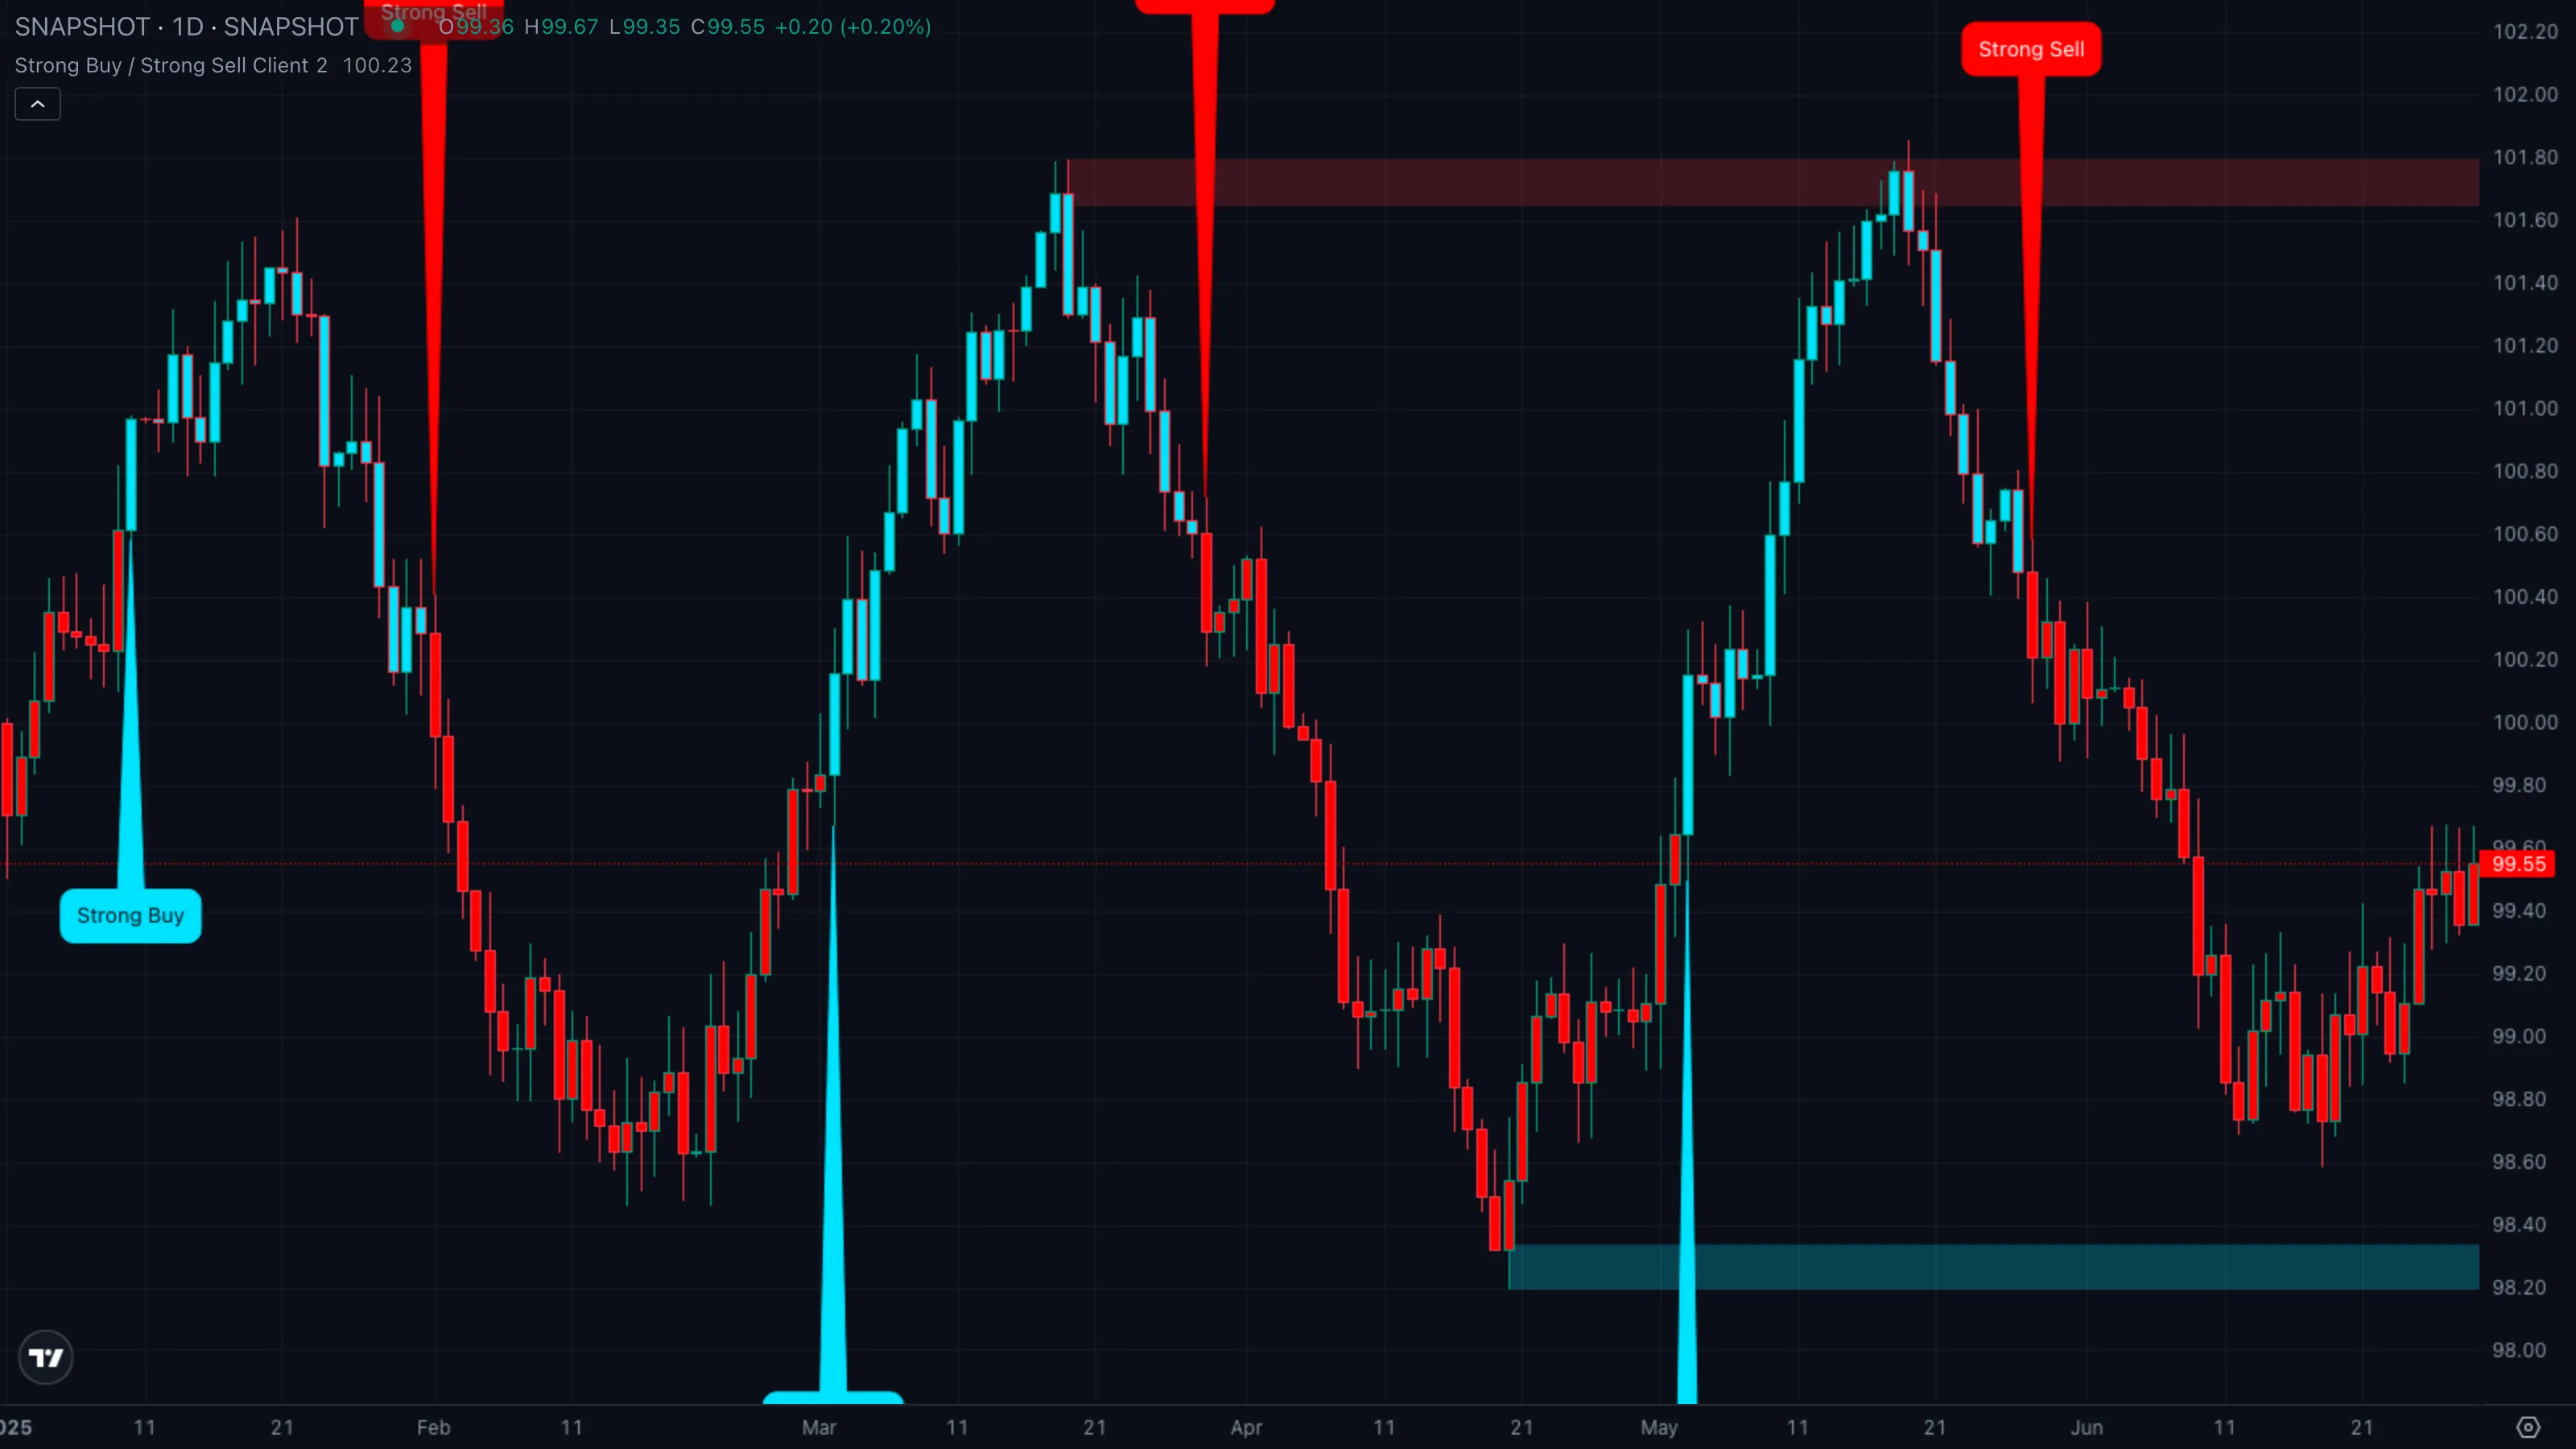
| What you see | ① Price oscillates above and below the SupertrendSupertrendA trailing line set above or below price using an ATR multiple. When close crosses it, the line flips to the opposite side and signals a regime change.Click for full definition → line every few bars ② SMASimple Moving AverageThe plain arithmetic mean of the last N closing prices. Reacts slower than an EMA of the same length because every bar in the window has equal weight.Click for full definition → 13 sits flat in the middle of the range ③ no callouts appear even though the underlying line keeps flipping. |
| What it means | The trigger is firing on every cross but the regime gate keeps rejecting it. When price closes back through SMASimple Moving AverageThe plain arithmetic mean of the last N closing prices. Reacts slower than an EMA of the same length because every bar in the window has equal weight.Click for full definition → 13 immediately after each cross, the indicator treats the flip as noise and refuses to print anything. This is the filter doing its job. |
| What to do | Stand aside. The absence of a callout in this regime is itself the message — there is no high-conviction setup here. Wait for price to break out of the range and for SMASimple Moving AverageThe plain arithmetic mean of the last N closing prices. Reacts slower than an EMA of the same length because every bar in the window has equal weight.Click for full definition → 13 to start sloping before re-engaging. |
Pattern C — Strong Sell fires after a failed rally
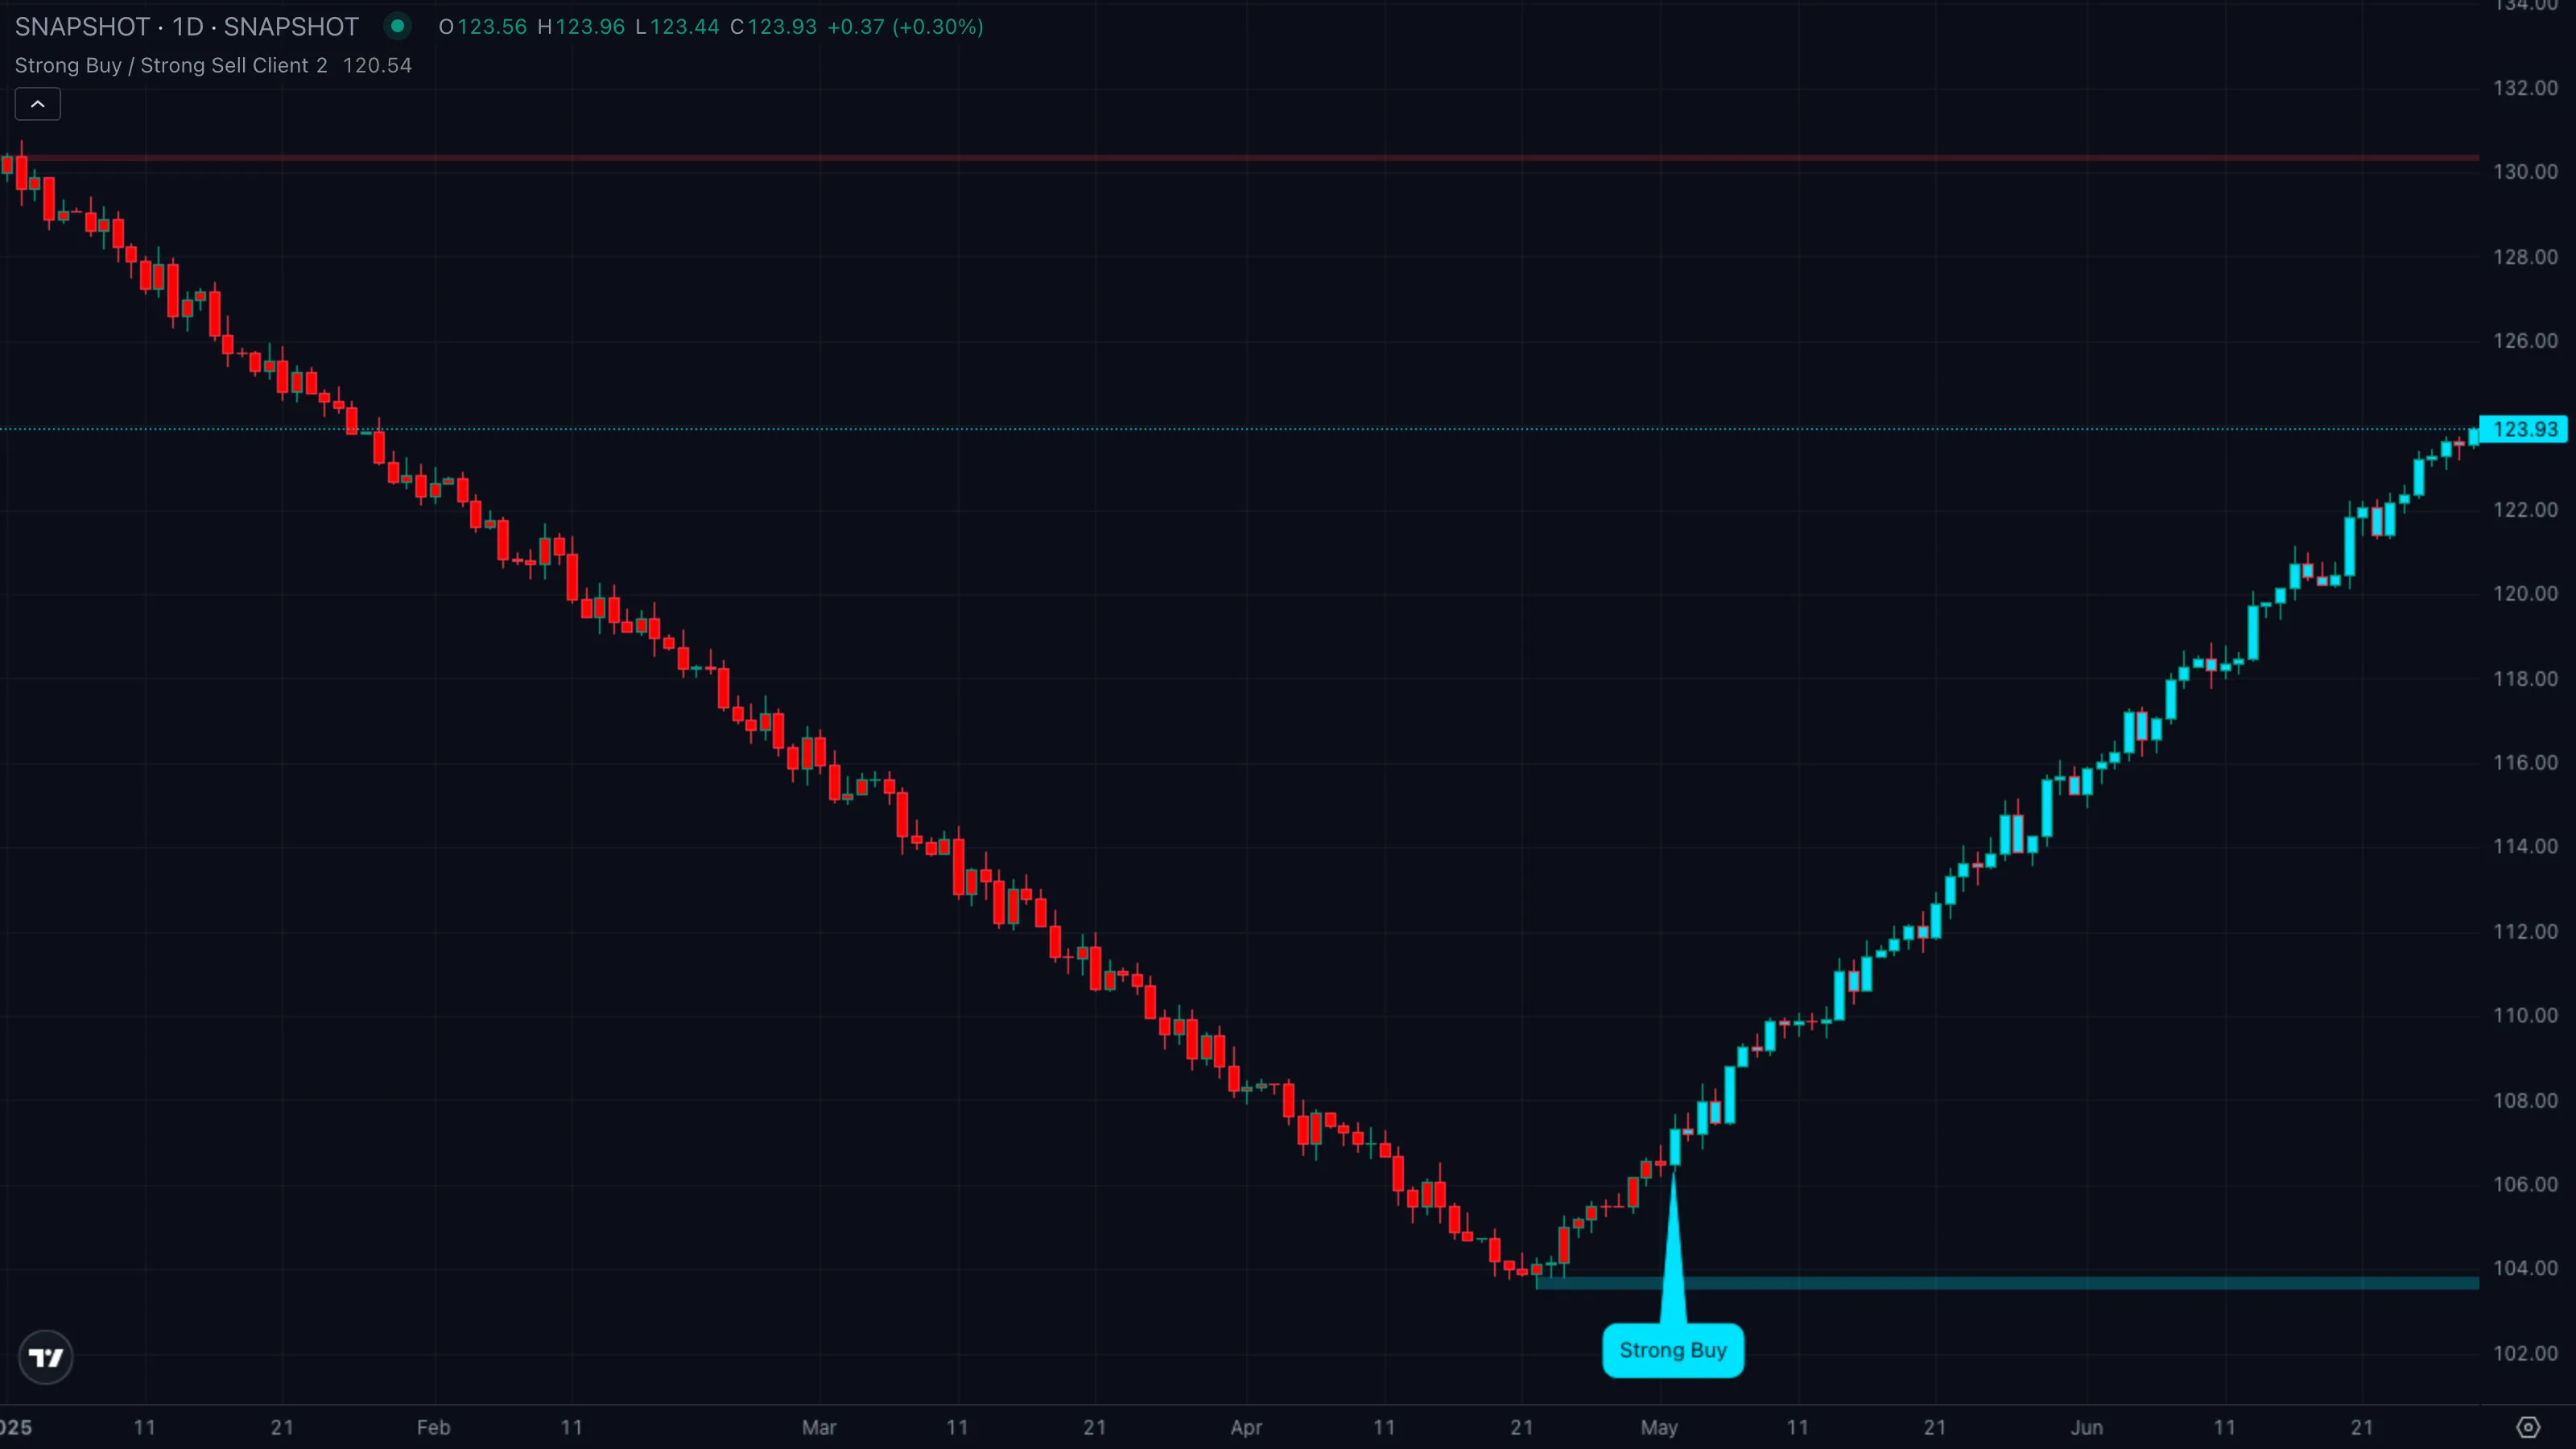
| What you see | ① An attempted rally fails just under a red supply zoneSupply and Demand ZoneA horizontal band drawn at a recent swing extreme where buyers (demand) or sellers (supply) last took control. Treated as likely support or resistance until price closes through it.Click for full definition → ② price closes back through the SupertrendSupertrendA trailing line set above or below price using an ATR multiple. When close crosses it, the line flips to the opposite side and signals a regime change.Click for full definition → line and through SMASimple Moving AverageThe plain arithmetic mean of the last N closing prices. Reacts slower than an EMA of the same length because every bar in the window has equal weight.Click for full definition → 13 in the same bar ③ a red Strong Sell callout prints above the bar with the short-term SMASimple Moving AverageThe plain arithmetic mean of the last N closing prices. Reacts slower than an EMA of the same length because every bar in the window has equal weight.Click for full definition → pair already aligned bearish. |
| What it means | A textbook short setup. Buyers tried, were rejected at supplySupply and Demand ZoneA horizontal band drawn at a recent swing extreme where buyers (demand) or sellers (supply) last took control. Treated as likely support or resistance until price closes through it.Click for full definition →, and the close-through bar fired all three filters at once. The "Strong" qualifier means the short-term smoothing was already turning over before the cross — momentum was leaning the right way going in. |
| What to do | Bias short. Wait for the first pullbackPullback (Retracement)A short, counter-trend move within an established trend — buyers (or sellers) momentarily losing ground before the trend resumes. Often the lowest-risk place to enter the trend.Click for full definition → toward the broken SupertrendSupertrendA trailing line set above or below price using an ATR multiple. When close crosses it, the line flips to the opposite side and signals a regime change.Click for full definition → line or the underside of the supply zoneSupply and Demand ZoneA horizontal band drawn at a recent swing extreme where buyers (demand) or sellers (supply) last took control. Treated as likely support or resistance until price closes through it.Click for full definition → for entry. Stops belong above the rejected swing highSwing High and Swing LowThe most recent confirmed pivot in either direction. Swing highs cap rallies until broken; swing lows support pullbacks until broken.Click for full definition →. The next demand zoneSupply and Demand ZoneA horizontal band drawn at a recent swing extreme where buyers (demand) or sellers (supply) last took control. Treated as likely support or resistance until price closes through it.Click for full definition → below is a logical first profit target. |
5. Trade Walkthrough
| Symbol | ETHUSDT |
|---|---|
| Timeframe | 4H |
| Venue | Binance |
| Window | 10 Mar to 22 Mar 2026 |
| Pattern | C — Strong Sell after a failed rally |
A clean example of the indicator's filtering in action. ETH spent the first half of March grinding higher inside a wide range, but every rally into the 3,840–3,900 band met sellers and faded. On 15 Mar the trigger crossed down through SupertrendSupertrendA trailing line set above or below price using an ATR multiple. When close crosses it, the line flips to the opposite side and signals a regime change.Click for full definition → at the same bar that price closed back below SMASimple Moving AverageThe plain arithmetic mean of the last N closing prices. Reacts slower than an EMA of the same length because every bar in the window has equal weight.Click for full definition → 13 — a Strong Sell callout printed, and ETH fell roughly 11 % into the next demand zoneSupply and Demand ZoneA horizontal band drawn at a recent swing extreme where buyers (demand) or sellers (supply) last took control. Treated as likely support or resistance until price closes through it.Click for full definition → over the following four days. The numbered markers ①–④ on the chart map to the four phases below.
The sequence
| # | When | ETH price | Indicator state | What it tells you |
|---|---|---|---|---|
| ① | 10 Mar to 14 Mar | 3,720 to 3,900 grind | cyan bars, no callouts | Range regime. Multiple SupertrendSupertrendA trailing line set above or below price using an ATR multiple. When close crosses it, the line flips to the opposite side and signals a regime change.Click for full definition → crosses got rejected by SMASimple Moving AverageThe plain arithmetic mean of the last N closing prices. Reacts slower than an EMA of the same length because every bar in the window has equal weight.Click for full definition → 13 — no signal printed. |
| ② | 15 Mar | ~3,840 close | Strong Sell prints | Trigger fires, regime gate confirms, short SMASimple Moving AverageThe plain arithmetic mean of the last N closing prices. Reacts slower than an EMA of the same length because every bar in the window has equal weight.Click for full definition → pair already bearish. The high-conviction alert. |
| ③ | 16 Mar | ~3,780 retrace | red bars, label still in view | First pullbackPullback (Retracement)A short, counter-trend move within an established trend — buyers (or sellers) momentarily losing ground before the trend resumes. Often the lowest-risk place to enter the trend.Click for full definition → into the broken SupertrendSupertrendA trailing line set above or below price using an ATR multiple. When close crosses it, the line flips to the opposite side and signals a regime change.Click for full definition → line. The real entry. |
| ④ | 19 Mar | ~3,420 low | red bars tagging demand zoneSupply and Demand ZoneA horizontal band drawn at a recent swing extreme where buyers (demand) or sellers (supply) last took control. Treated as likely support or resistance until price closes through it.Click for full definition → | Move tags the next demandSupply and Demand ZoneA horizontal band drawn at a recent swing extreme where buyers (demand) or sellers (supply) last took control. Treated as likely support or resistance until price closes through it.Click for full definition → box and stalls. Cue to trim or exit. |
The trade in one card
| What you skipped | The earlier red bars at 3,750 with no callout, and the chase short on the cross bar itself at 3,840. The first had no signal; the second offered no clean stop. |
| What you took | PullbackPullback (Retracement)A short, counter-trend move within an established trend — buyers (or sellers) momentarily losing ground before the trend resumes. Often the lowest-risk place to enter the trend.Click for full definition → short into the broken SupertrendSupertrendA trailing line set above or below price using an ATR multiple. When close crosses it, the line flips to the opposite side and signals a regime change.Click for full definition → line at ~3,780 the bar after the Strong Sell, with the callout still on screen. |
| Where you exited | Price tags the demand zoneSupply and Demand ZoneA horizontal band drawn at a recent swing extreme where buyers (demand) or sellers (supply) last took control. Treated as likely support or resistance until price closes through it.Click for full definition → near 3,420 and the bars start flipping cyan as the trigger reverses. |
| Move captured | ~ +9.5 % in roughly four days. |
Lesson
The Strong Sell callout gives you the alert. The first pullbackPullback (Retracement)A short, counter-trend move within an established trend — buyers (or sellers) momentarily losing ground before the trend resumes. Often the lowest-risk place to enter the trend.Click for full definition → into the broken SupertrendSupertrendA trailing line set above or below price using an ATR multiple. When close crosses it, the line flips to the opposite side and signals a regime change.Click for full definition → line, with the callout still recent and the demand zoneSupply and Demand ZoneA horizontal band drawn at a recent swing extreme where buyers (demand) or sellers (supply) last took control. Treated as likely support or resistance until price closes through it.Click for full definition → untagged, gives you the trade. The bars flipping back to cyan at the demand zoneSupply and Demand ZoneA horizontal band drawn at a recent swing extreme where buyers (demand) or sellers (supply) last took control. Treated as likely support or resistance until price closes through it.Click for full definition → tells you when to step out.
6. Common Pitfalls
- Treating Buy and Strong Buy as different setups. They aren't. The wording difference is just a tie-breaker on the very-short SMASimple Moving AverageThe plain arithmetic mean of the last N closing prices. Reacts slower than an EMA of the same length because every bar in the window has equal weight.Click for full definition → pair — both passed the trigger and the regime gate. If you only trade Strong labels you'll miss perfectly valid entries where the short SMAs were a single bar slow to align.
- Acting on the bar-color flip alone. The candles change colour every time price crosses SupertrendSupertrendA trailing line set above or below price using an ATR multiple. When close crosses it, the line flips to the opposite side and signals a regime change.Click for full definition →, including on bars where the regime gate rejected the signal. The colour change is a visual hint about the trigger line, not a tradable event. Wait for the callout.
- Chasing the cross bar. The bar that prints the callout is usually the worst place to enter — the move has already extended away from any logical stop. The pullbackPullback (Retracement)A short, counter-trend move within an established trend — buyers (or sellers) momentarily losing ground before the trend resumes. Often the lowest-risk place to enter the trend.Click for full definition → after the cross, into the broken SupertrendSupertrendA trailing line set above or below price using an ATR multiple. When close crosses it, the line flips to the opposite side and signals a regime change.Click for full definition → or the nearest opposite zone, is what gives you defined risk.
- Ignoring the supplySupply and Demand ZoneA horizontal band drawn at a recent swing extreme where buyers (demand) or sellers (supply) last took control. Treated as likely support or resistance until price closes through it.Click for full definition →/demandSupply and Demand ZoneA horizontal band drawn at a recent swing extreme where buyers (demand) or sellers (supply) last took control. Treated as likely support or resistance until price closes through it.Click for full definition → zones on signal bars. A Strong Buy that fires while a heavy supply zoneSupply and Demand ZoneA horizontal band drawn at a recent swing extreme where buyers (demand) or sellers (supply) last took control. Treated as likely support or resistance until price closes through it.Click for full definition → sits a few percent overhead is materially weaker than one that fires into open space. The zones tell you how much room the trade has before it hits resistance — read them together with the callout.
- Cranking sensitivity too low to get more signals. Lowering sensitivity tightens the SupertrendSupertrendA trailing line set above or below price using an ATR multiple. When close crosses it, the line flips to the opposite side and signals a regime change.Click for full definition → line and produces more triggers, but most of the new ones get rejected by the SMASimple Moving AverageThe plain arithmetic mean of the last N closing prices. Reacts slower than an EMA of the same length because every bar in the window has equal weight.Click for full definition → 13 gate anyway — and the survivors are noisier. The defaults were chosen so the average bar's volatility comfortably clears the noise floor; nudge the value cautiously and only on a per-instrument basis.