

StructureMarket StructureThe pattern of swing highs and lows price prints as it moves. Healthy uptrends print higher highs and higher lows; healthy downtrends print the mirror.Click for full definition → PRO
Auto-maps the higher-highs and higher-lows of the trend, draws a line the moment one of them breaks, and labels the break BOSBreak of StructureA close past the most recent swing high or low in the same direction as the prevailing trend. Signals trend continuation.Click for full definition → or CHoCHChange of CharacterA close past the most recent swing point in the opposite direction from the prior break. The first warning that the trend may be turning.Click for full definition → so you can tell continuation from reversal at a glance.
1. What This Indicator Watches For
Every trader has done the same exercise. You open a chart, squint, and start drawing little dots on the swing highsSwing High and Swing LowThe most recent confirmed pivot in either direction. Swing highs cap rallies until broken; swing lows support pullbacks until broken.Click for full definition → and swing lowsSwing High and Swing LowThe most recent confirmed pivot in either direction. Swing highs cap rallies until broken; swing lows support pullbacks until broken.Click for full definition →, trying to figure out whether you're looking at an uptrend, a downtrend, or something that just turned. The dots are easy. The hard part is the rule for what counts as "the trend changed" versus "the trend just took a breath" — and that rule is exactly what most retail traders draw inconsistently from one chart to the next.
Smart-money traders formalised this years ago with two ideas. Market structureMarket StructureThe pattern of swing highs and lows price prints as it moves. Healthy uptrends print higher highs and higher lows; healthy downtrends print the mirror.Click for full definition → is just the staircase of swing pointsPivot High / Pivot LowA bar that is higher (or lower) than a defined number of bars on both sides. Confirmed only after the right-hand bars print without breaking it.Click for full definition → price prints as it moves: a healthy uptrend prints higher highs and higher lows; a healthy downtrend prints lower lows and lower highs. Break of StructureBreak of StructureA close past the most recent swing high or low in the same direction as the prevailing trend. Signals trend continuation.Click for full definition → (BOSBreak of StructureA close past the most recent swing high or low in the same direction as the prevailing trend. Signals trend continuation.Click for full definition →) means price punches through the most recent swing in the direction of the existing trend — the staircase keeps going. Change of CharacterChange of CharacterA close past the most recent swing point in the opposite direction from the prior break. The first warning that the trend may be turning.Click for full definition → (CHoCHChange of CharacterA close past the most recent swing point in the opposite direction from the prior break. The first warning that the trend may be turning.Click for full definition →) means price breaks the opposite side instead — the first crack in the current trend's foundation.
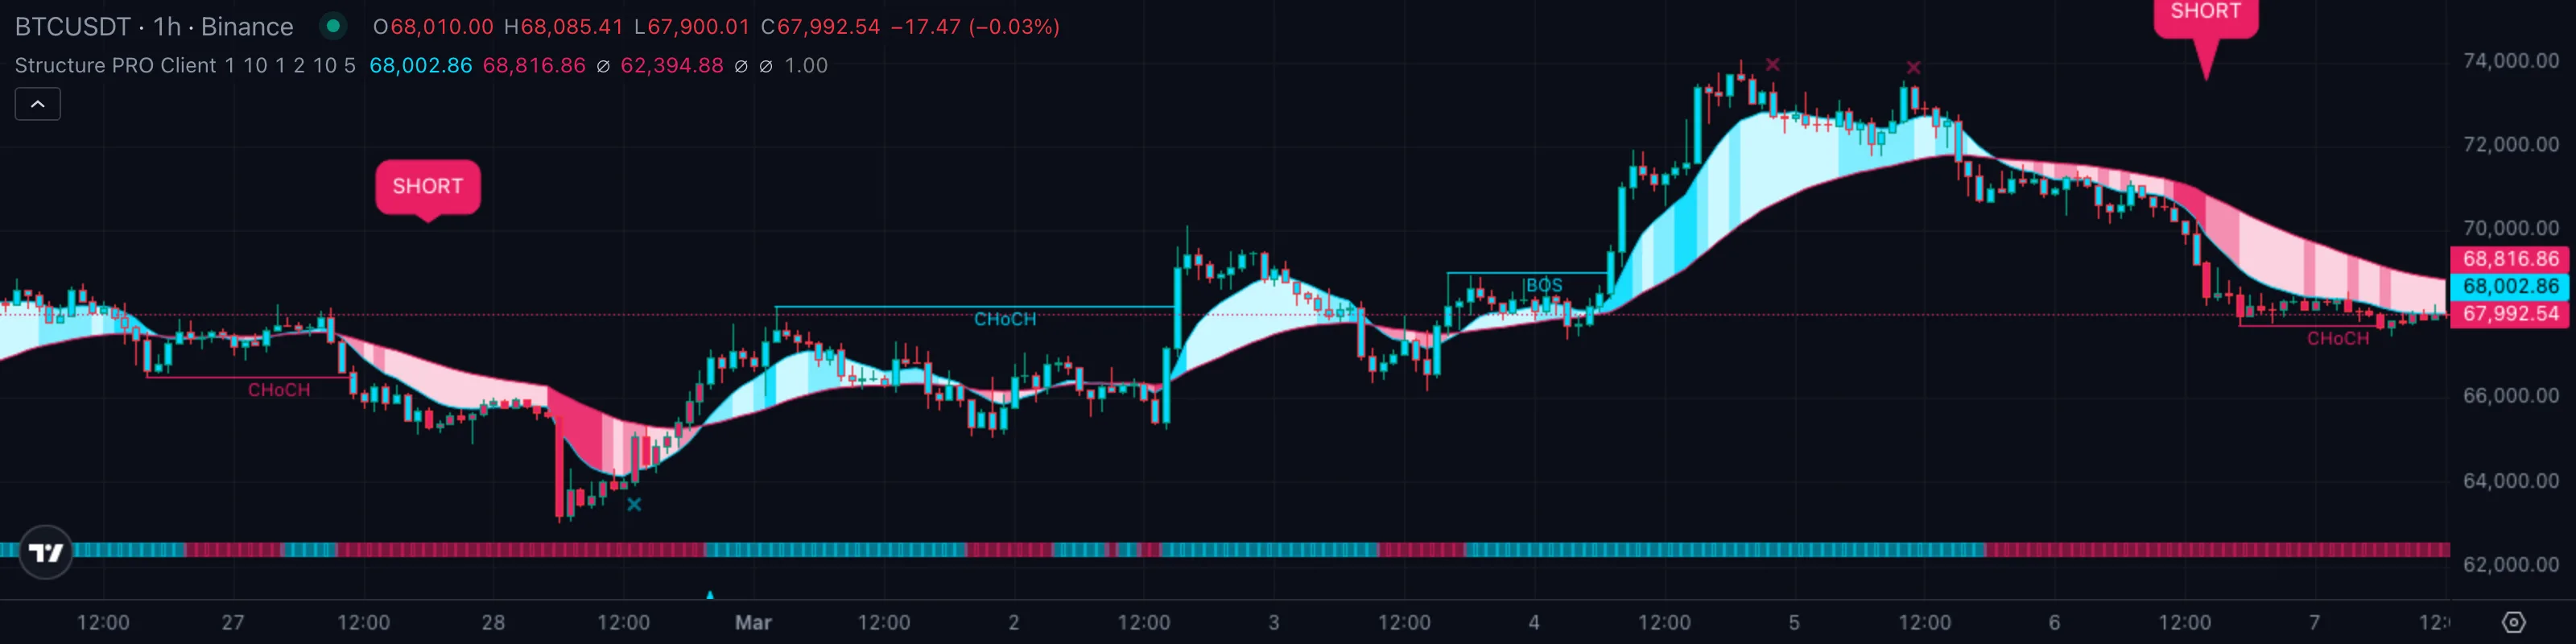
StructureMarket StructureThe pattern of swing highs and lows price prints as it moves. Healthy uptrends print higher highs and higher lows; healthy downtrends print the mirror.Click for full definition → PRO does this exercise for you, in real time, on every bar. It tracks the most recent swing highSwing High and Swing LowThe most recent confirmed pivot in either direction. Swing highs cap rallies until broken; swing lows support pullbacks until broken.Click for full definition → and swing lowSwing High and Swing LowThe most recent confirmed pivot in either direction. Swing highs cap rallies until broken; swing lows support pullbacks until broken.Click for full definition →, draws a horizontal line at the moment either gets broken, and writes BOSBreak of StructureA close past the most recent swing high or low in the same direction as the prevailing trend. Signals trend continuation.Click for full definition → or CHoCHChange of CharacterA close past the most recent swing point in the opposite direction from the prior break. The first warning that the trend may be turning.Click for full definition → on the line so you don't have to remember which side broke last. You stop drawing dots and start trading the breaks.
2. How It Works Under the Hood
Three engines run on the same chart and you read them as a stack.
- Swing pointPivot High / Pivot LowA bar that is higher (or lower) than a defined number of bars on both sides. Confirmed only after the right-hand bars print without breaking it.Click for full definition → detector. Every bar gets checked against its neighbours. If a bar's high is higher than the ten bars on each side of it, that bar is a swing highSwing High and Swing LowThe most recent confirmed pivot in either direction. Swing highs cap rallies until broken; swing lows support pullbacks until broken.Click for full definition →. Same logic for swing lowsSwing High and Swing LowThe most recent confirmed pivot in either direction. Swing highs cap rallies until broken; swing lows support pullbacks until broken.Click for full definition →. The default look-back of ten bars on each side is wide enough to ignore single-bar wiggles but narrow enough that you get a fresh structureMarket StructureThe pattern of swing highs and lows price prints as it moves. Healthy uptrends print higher highs and higher lows; healthy downtrends print the mirror.Click for full definition → point every couple of days on a 4H chart.
- Break detector. Once a swing pointPivot High / Pivot LowA bar that is higher (or lower) than a defined number of bars on both sides. Confirmed only after the right-hand bars print without breaking it.Click for full definition → exists, the indicator watches every following bar's close. If price closes above the most recent swing highSwing High and Swing LowThe most recent confirmed pivot in either direction. Swing highs cap rallies until broken; swing lows support pullbacks until broken.Click for full definition →, the high broke. If price closes below the most recent swing lowSwing High and Swing LowThe most recent confirmed pivot in either direction. Swing highs cap rallies until broken; swing lows support pullbacks until broken.Click for full definition →, the low broke. (You can switch the trigger to wicks instead of closes if you want earlier signals — closes are the default and they filter out a lot of fake-outs.)
- BOSBreak of StructureA close past the most recent swing high or low in the same direction as the prevailing trend. Signals trend continuation.Click for full definition → vs CHoCHChange of CharacterA close past the most recent swing point in the opposite direction from the prior break. The first warning that the trend may be turning.Click for full definition → labeller. The indicator remembers which side broke last. If this break is in the same direction as the previous one, it's a Break of StructureBreak of StructureA close past the most recent swing high or low in the same direction as the prevailing trend. Signals trend continuation.Click for full definition → — the trend is continuing. If this break is in the opposite direction, it's a Change of CharacterChange of CharacterA close past the most recent swing point in the opposite direction from the prior break. The first warning that the trend may be turning.Click for full definition → — the first sign that the trend may be turning.
How the label picks BOSBreak of StructureA close past the most recent swing high or low in the same direction as the prevailing trend. Signals trend continuation.Click for full definition → or CHoCHChange of CharacterA close past the most recent swing point in the opposite direction from the prior break. The first warning that the trend may be turning.Click for full definition →. Every break asks the same two questions.
- Which side just broke — the swing highSwing High and Swing LowThe most recent confirmed pivot in either direction. Swing highs cap rallies until broken; swing lows support pullbacks until broken.Click for full definition → above price, or the swing lowSwing High and Swing LowThe most recent confirmed pivot in either direction. Swing highs cap rallies until broken; swing lows support pullbacks until broken.Click for full definition → below it? That tells you the direction of the break.
- Which side broke the time before this one? Same direction means continuation. Opposite direction means transition.
| What you're seeing | Label | Plain English |
|---|---|---|
| Bull break, last break also bull | 🟢 BOSBreak of StructureA close past the most recent swing high or low in the same direction as the prevailing trend. Signals trend continuation.Click for full definition → | Uptrend keeps stepping higher |
| Bull break, last break was bear | 🟢 CHoCHChange of CharacterA close past the most recent swing point in the opposite direction from the prior break. The first warning that the trend may be turning.Click for full definition → | Downtrend may be ending, watch for a new uptrend |
| Bear break, last break also bear | 🔴 BOSBreak of StructureA close past the most recent swing high or low in the same direction as the prevailing trend. Signals trend continuation.Click for full definition → | Downtrend keeps stepping lower |
| Bear break, last break was bull | 🔴 CHoCHChange of CharacterA close past the most recent swing point in the opposite direction from the prior break. The first warning that the trend may be turning.Click for full definition → | Uptrend may be ending, watch for a new downtrend |
| No break yet, price still inside the last swing range | 🟡 Stand by | StructureMarket StructureThe pattern of swing highs and lows price prints as it moves. Healthy uptrends print higher highs and higher lows; healthy downtrends print the mirror.Click for full definition → intact, no signal |
The whole point of the BOSBreak of StructureA close past the most recent swing high or low in the same direction as the prevailing trend. Signals trend continuation.Click for full definition →/CHoCHChange of CharacterA close past the most recent swing point in the opposite direction from the prior break. The first warning that the trend may be turning.Click for full definition → split is that a chart with three BOSBreak of StructureA close past the most recent swing high or low in the same direction as the prevailing trend. Signals trend continuation.Click for full definition → in a row tells a very different story from a chart with one BOSBreak of StructureA close past the most recent swing high or low in the same direction as the prevailing trend. Signals trend continuation.Click for full definition → followed by a CHoCHChange of CharacterA close past the most recent swing point in the opposite direction from the prior break. The first warning that the trend may be turning.Click for full definition → — even though both involve "two breaks." StructureMarket StructureThe pattern of swing highs and lows price prints as it moves. Healthy uptrends print higher highs and higher lows; healthy downtrends print the mirror.Click for full definition → PRO encodes that history for you so the chart stops looking like a stream of identical lines.
3. What You See on the Chart
| Element | Looks like | Means |
|---|---|---|
| Coloured bars | Bars repainted cyan or pink | Trend direction from the trailing-stop engine. Cyan when the trend reads up, pink when it reads down. |
| Vortex Cloud | A pastel band drawn between two slow moving averages | Background regime. Cyan band means the slow trend is up, pink means down. Darker shade means high-volume conviction. |
| BOSBreak of StructureA close past the most recent swing high or low in the same direction as the prevailing trend. Signals trend continuation.Click for full definition → line | A short horizontal line ending at the breakout bar, labelled "BOSBreak of StructureA close past the most recent swing high or low in the same direction as the prevailing trend. Signals trend continuation.Click for full definition →" | Price closed past the previous swing highSwing High and Swing LowThe most recent confirmed pivot in either direction. Swing highs cap rallies until broken; swing lows support pullbacks until broken.Click for full definition → or low in the same direction as the last break. Trend is continuing. |
| CHoCHChange of CharacterA close past the most recent swing point in the opposite direction from the prior break. The first warning that the trend may be turning.Click for full definition → line | Same horizontal line, labelled "CHoCHChange of CharacterA close past the most recent swing point in the opposite direction from the prior break. The first warning that the trend may be turning.Click for full definition →" | Price broke the opposite side from the last break. Trend may be turning. |
| LONG / SHORT callout | A coloured pill below or above a bar | A separate trailing-stop trigger fired on this bar. Use as a confirmation of a fresh CHoCHChange of CharacterA close past the most recent swing point in the opposite direction from the prior break. The first warning that the trend may be turning.Click for full definition →, not a stand-alone entry. |
| Bottom ribbon dots | Cyan or pink squares pinned below the chart | Long-cycle bias from a fast vs slow EMAExponential Moving AverageA moving average that weights recent bars more heavily than old ones, so it reacts faster to fresh price action than a simple average of the same length.Click for full definition → cross. Cyan dots favour longs, pink dots favour shorts. |
| Top / bottom xcross | A small × above or below a bar | Wavetrend rejection at an overbought or oversold extreme. Tells you not to chase. |
The structureMarket StructureThe pattern of swing highs and lows price prints as it moves. Healthy uptrends print higher highs and higher lows; healthy downtrends print the mirror.Click for full definition → lines are the headline. Everything else is context for filtering them.
4. Reading It in 3 Patterns
Pattern A — Uptrend HH and HL stack
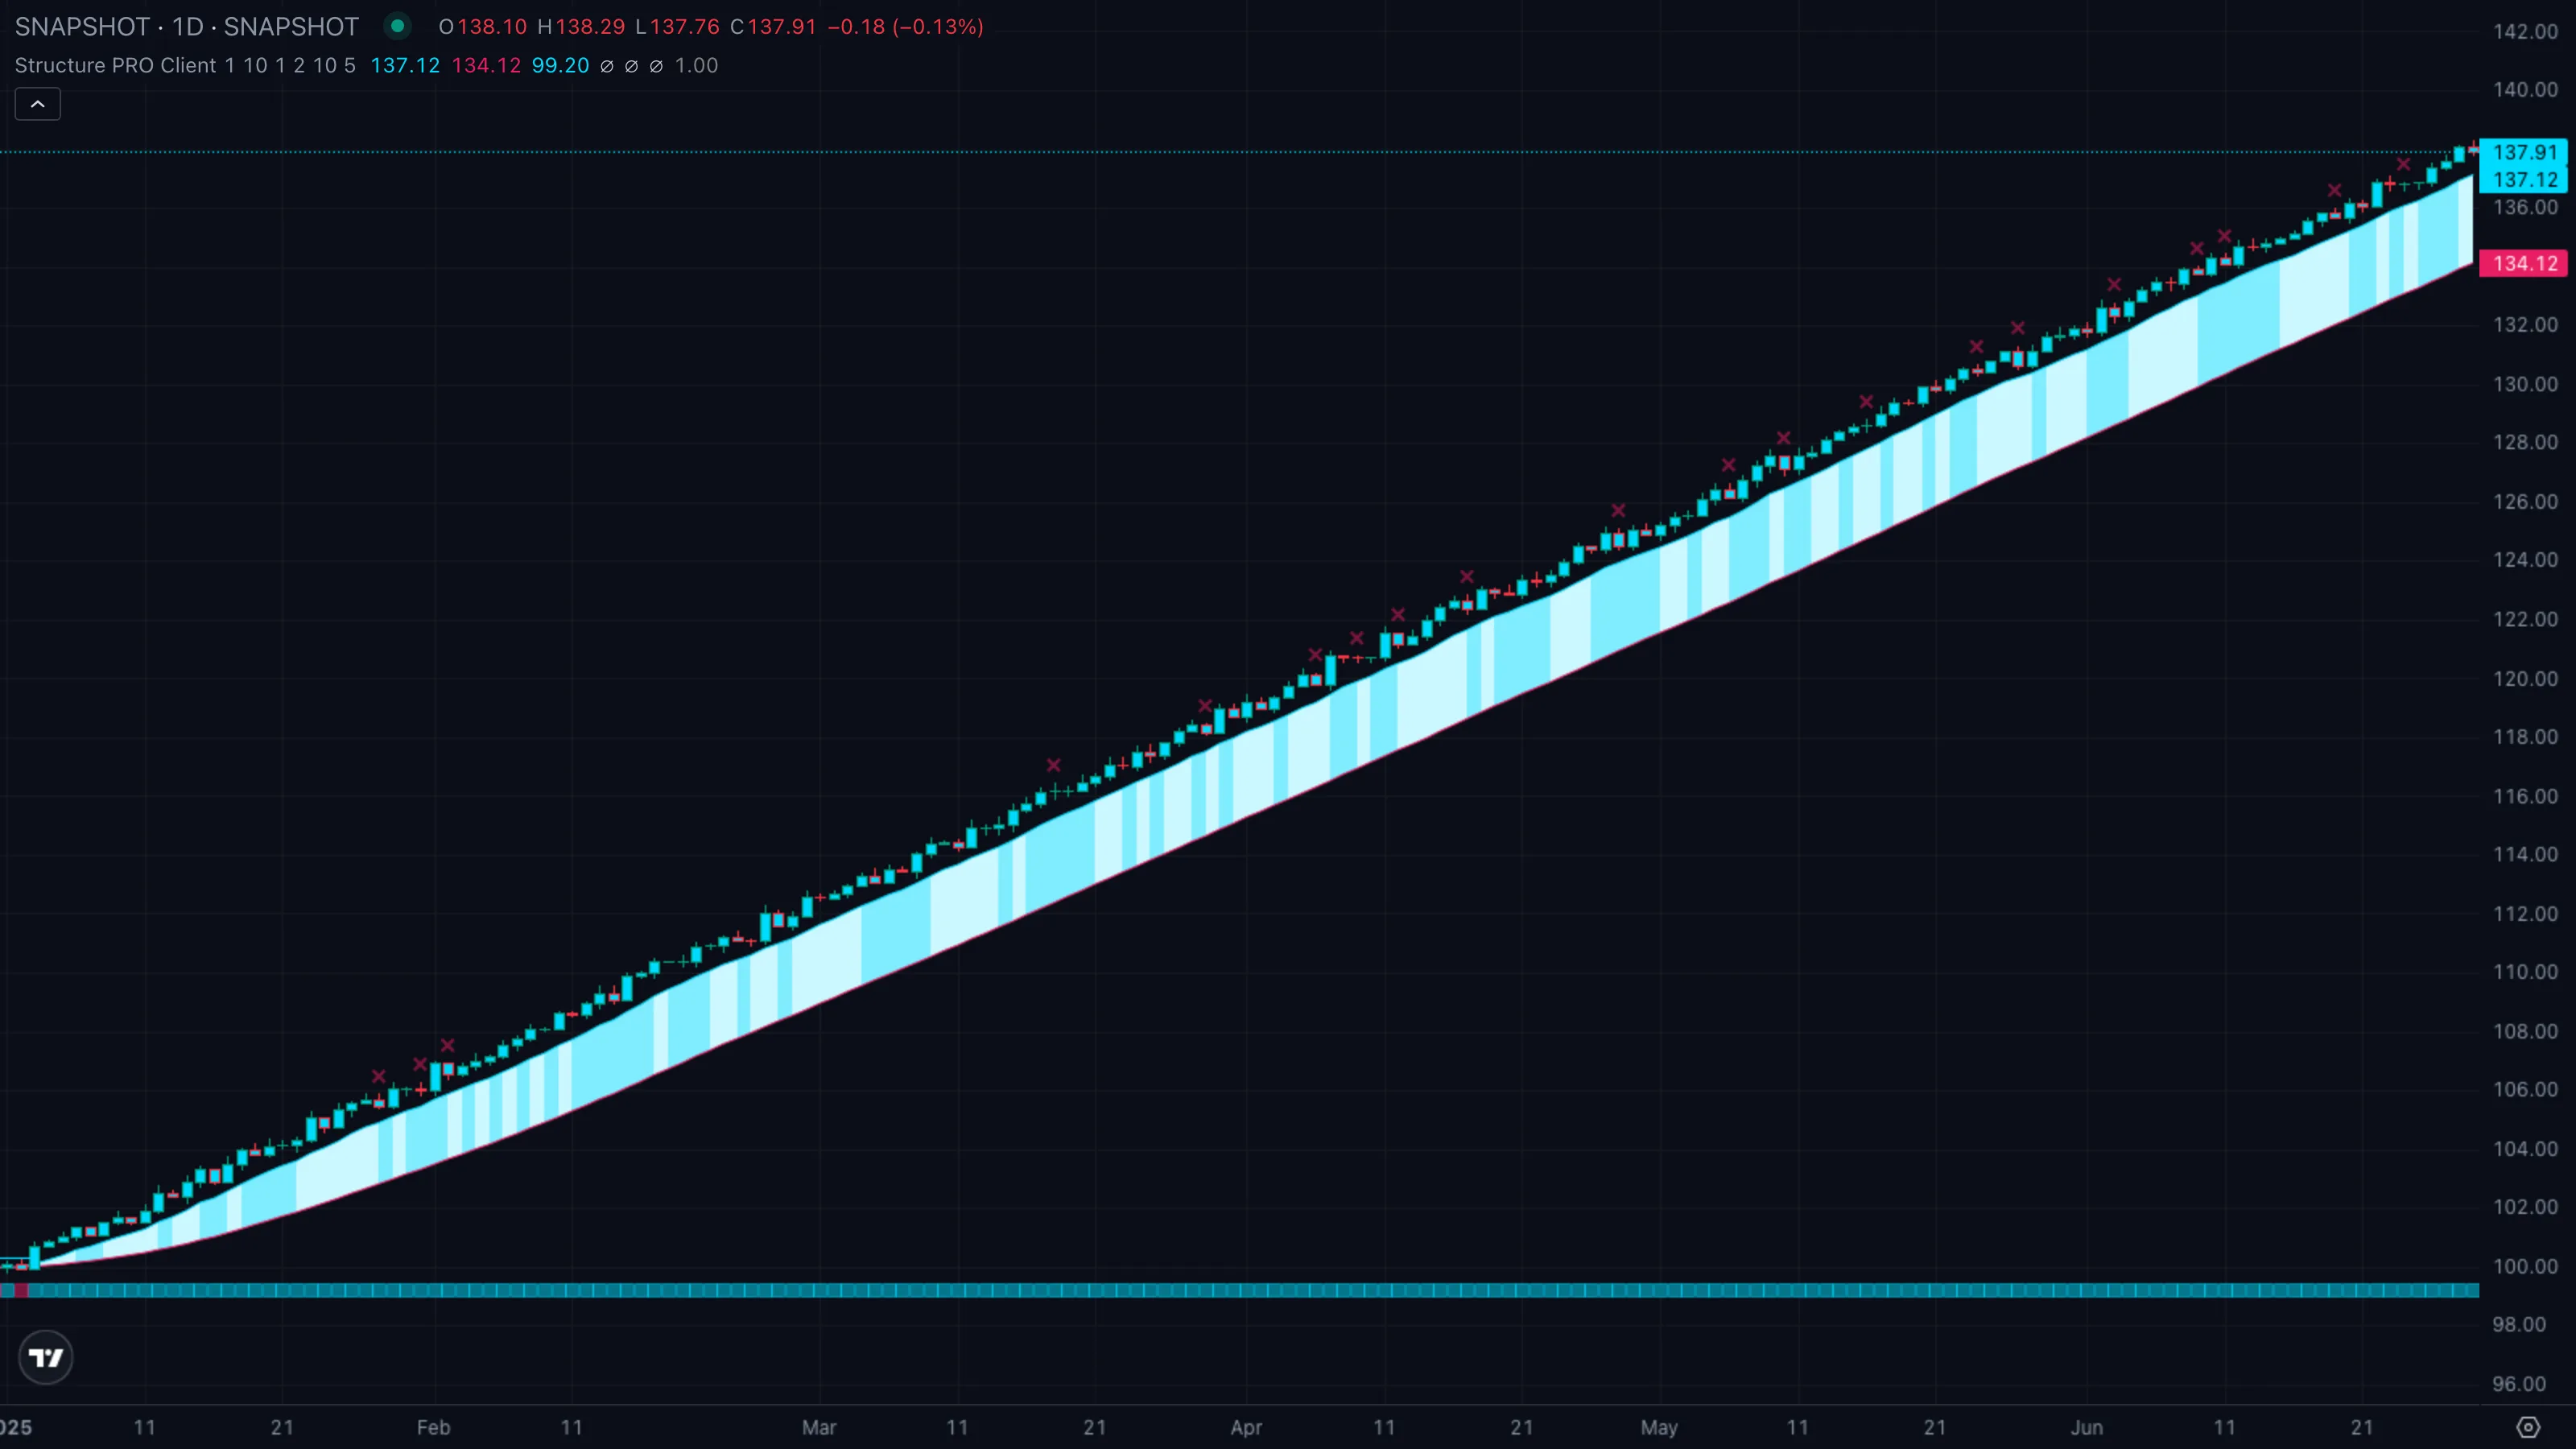
| What you see | ① A bull BOSBreak of StructureA close past the most recent swing high or low in the same direction as the prevailing trend. Signals trend continuation.Click for full definition → line breaks the prior swing highSwing High and Swing LowThe most recent confirmed pivot in either direction. Swing highs cap rallies until broken; swing lows support pullbacks until broken.Click for full definition → ② price pulls back, prints a higher low above the previous swing lowSwing High and Swing LowThe most recent confirmed pivot in either direction. Swing highs cap rallies until broken; swing lows support pullbacks until broken.Click for full definition → ③ another bull BOSBreak of StructureA close past the most recent swing high or low in the same direction as the prevailing trend. Signals trend continuation.Click for full definition → confirms the staircase is intact. |
| What it means | Textbook uptrend. Each new high is higher than the last, each pullbackPullback (Retracement)A short, counter-trend move within an established trend — buyers (or sellers) momentarily losing ground before the trend resumes. Often the lowest-risk place to enter the trend.Click for full definition → bottoms above the previous pullbackPullback (Retracement)A short, counter-trend move within an established trend — buyers (or sellers) momentarily losing ground before the trend resumes. Often the lowest-risk place to enter the trend.Click for full definition →. Buyers are in control and the trend is adding structureMarket StructureThe pattern of swing highs and lows price prints as it moves. Healthy uptrends print higher highs and higher lows; healthy downtrends print the mirror.Click for full definition →, not breaking it. |
| What to do | Bias long. The lowest-risk entry is the pullbackPullback (Retracement)A short, counter-trend move within an established trend — buyers (or sellers) momentarily losing ground before the trend resumes. Often the lowest-risk place to enter the trend.Click for full definition → into the higher low after a fresh BOSBreak of StructureA close past the most recent swing high or low in the same direction as the prevailing trend. Signals trend continuation.Click for full definition → — defined invalidation just under the prior swing lowSwing High and Swing LowThe most recent confirmed pivot in either direction. Swing highs cap rallies until broken; swing lows support pullbacks until broken.Click for full definition →, plenty of room to the next BOSBreak of StructureA close past the most recent swing high or low in the same direction as the prevailing trend. Signals trend continuation.Click for full definition → target above. |
Pattern B — BOSBreak of StructureA close past the most recent swing high or low in the same direction as the prevailing trend. Signals trend continuation.Click for full definition → confirms the reversal
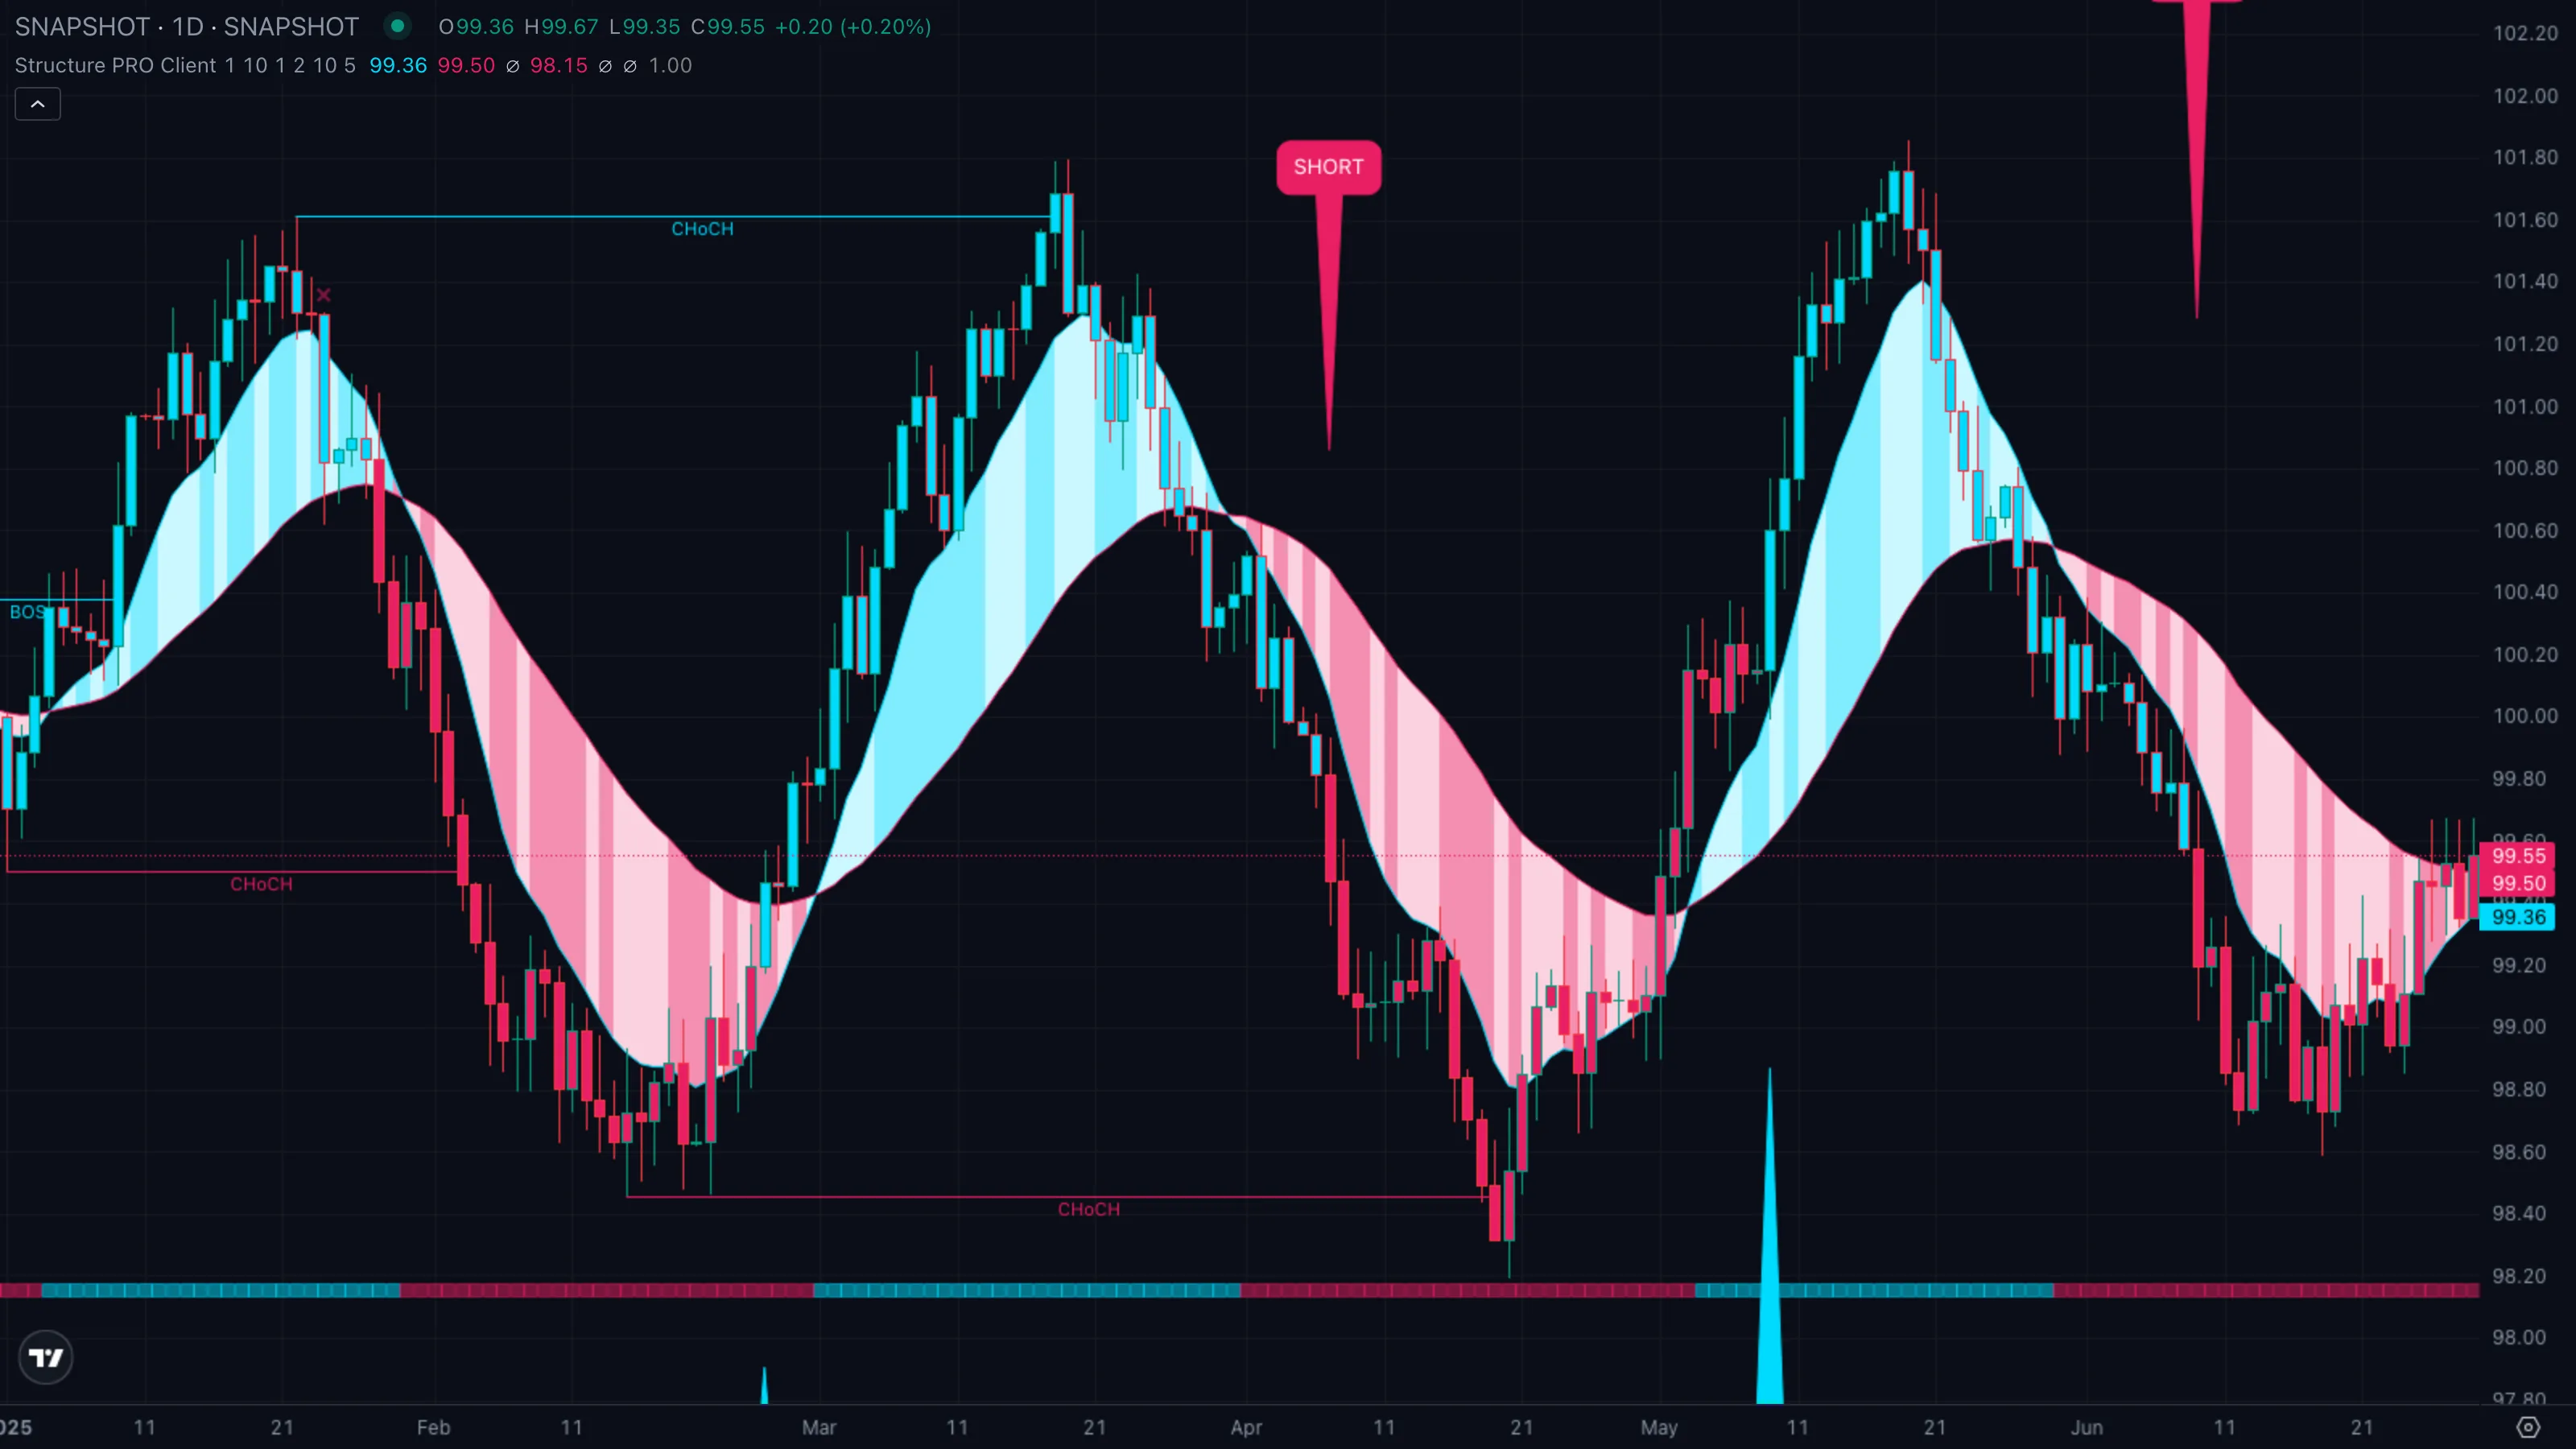
| What you see | ① Price was making lower lows, then ② a CHoCHChange of CharacterA close past the most recent swing point in the opposite direction from the prior break. The first warning that the trend may be turning.Click for full definition → line marks the first close above the prior swing highSwing High and Swing LowThe most recent confirmed pivot in either direction. Swing highs cap rallies until broken; swing lows support pullbacks until broken.Click for full definition → ③ a pullbackPullback (Retracement)A short, counter-trend move within an established trend — buyers (or sellers) momentarily losing ground before the trend resumes. Often the lowest-risk place to enter the trend.Click for full definition → prints a higher low and ④ a fresh BOSBreak of StructureA close past the most recent swing high or low in the same direction as the prevailing trend. Signals trend continuation.Click for full definition → in the new direction confirms the trend has actually flipped. |
| What it means | The CHoCHChange of CharacterA close past the most recent swing point in the opposite direction from the prior break. The first warning that the trend may be turning.Click for full definition → was the warning. The follow-up BOSBreak of StructureA close past the most recent swing high or low in the same direction as the prevailing trend. Signals trend continuation.Click for full definition → is the confirmation. Until you get the second break in the same direction, all you have is a single counter-trend candle that could fail. The BOSBreak of StructureA close past the most recent swing high or low in the same direction as the prevailing trend. Signals trend continuation.Click for full definition → is the moment the chart commits to the new regime. |
| What to do | Wait for the BOSBreak of StructureA close past the most recent swing high or low in the same direction as the prevailing trend. Signals trend continuation.Click for full definition →, then enter on the next pullbackPullback (Retracement)A short, counter-trend move within an established trend — buyers (or sellers) momentarily losing ground before the trend resumes. Often the lowest-risk place to enter the trend.Click for full definition →. Skipping the CHoCHChange of CharacterA close past the most recent swing point in the opposite direction from the prior break. The first warning that the trend may be turning.Click for full definition →-only entry filters out 70-30 trades; waiting for BOSBreak of StructureA close past the most recent swing high or low in the same direction as the prevailing trend. Signals trend continuation.Click for full definition → turns it into an 80-20 setup at the cost of a few ticks of price. |
Pattern C — CHoCHChange of CharacterA close past the most recent swing point in the opposite direction from the prior break. The first warning that the trend may be turning.Click for full definition → warns of a trend change
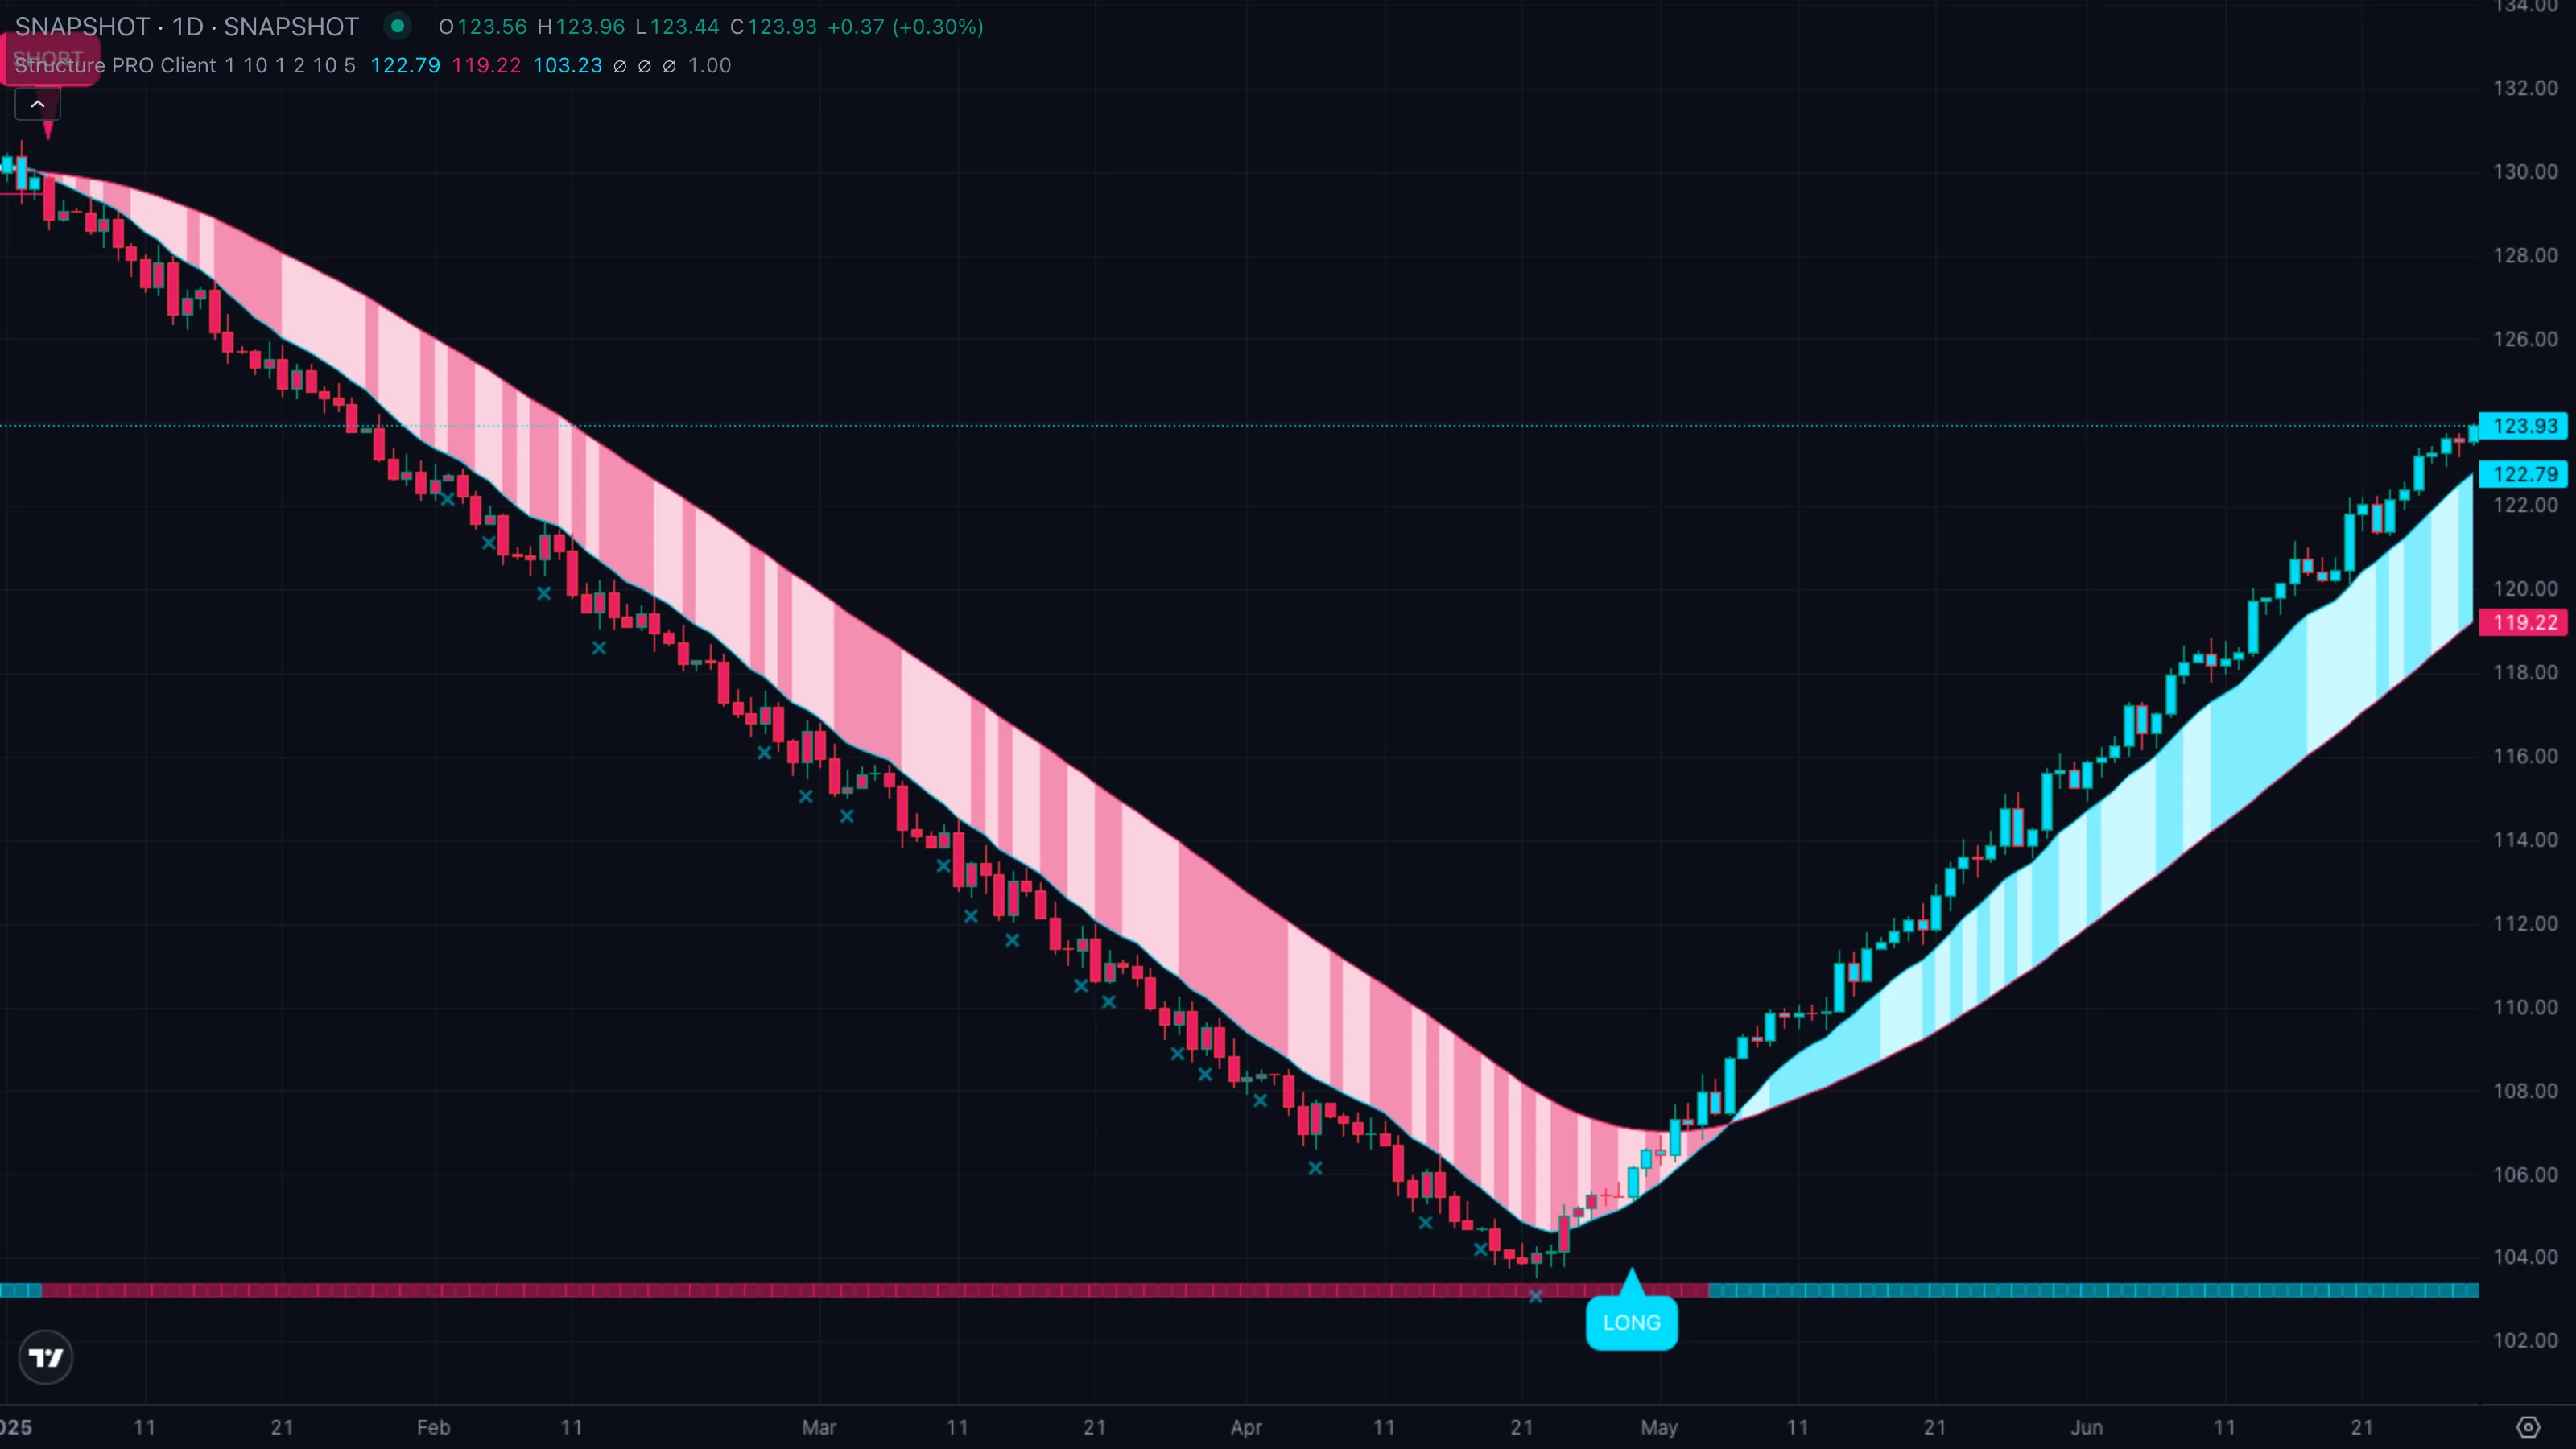
| What you see | ① A clean run of bull BOSBreak of StructureA close past the most recent swing high or low in the same direction as the prevailing trend. Signals trend continuation.Click for full definition → lines as price climbs ② price stalls and rolls over ③ a CHoCHChange of CharacterA close past the most recent swing point in the opposite direction from the prior break. The first warning that the trend may be turning.Click for full definition → line prints as the most recent swing lowSwing High and Swing LowThe most recent confirmed pivot in either direction. Swing highs cap rallies until broken; swing lows support pullbacks until broken.Click for full definition → gives way ④ the Vortex Cloud underneath fades from cyan toward pink. |
| What it means | The first cracks. The uptrend's staircase has broken its lowest step for the first time in many bars. It does not yet mean the trend is over — what it does mean is that the lowest-risk longs are gone and any new long here is fighting fresh evidence. |
| What to do | If you're already long, this is your exit cue, not a flip-to-short cue. Tighten stops, take profit, or go flat. Do not short the CHoCHChange of CharacterA close past the most recent swing point in the opposite direction from the prior break. The first warning that the trend may be turning.Click for full definition → bar itself — wait for the follow-up BOSBreak of StructureA close past the most recent swing high or low in the same direction as the prevailing trend. Signals trend continuation.Click for full definition → in Pattern B. Many CHoCHChange of CharacterA close past the most recent swing point in the opposite direction from the prior break. The first warning that the trend may be turning.Click for full definition → events are followed by one more push back into the old trend before reversing for real. |
5. Trade Walkthrough
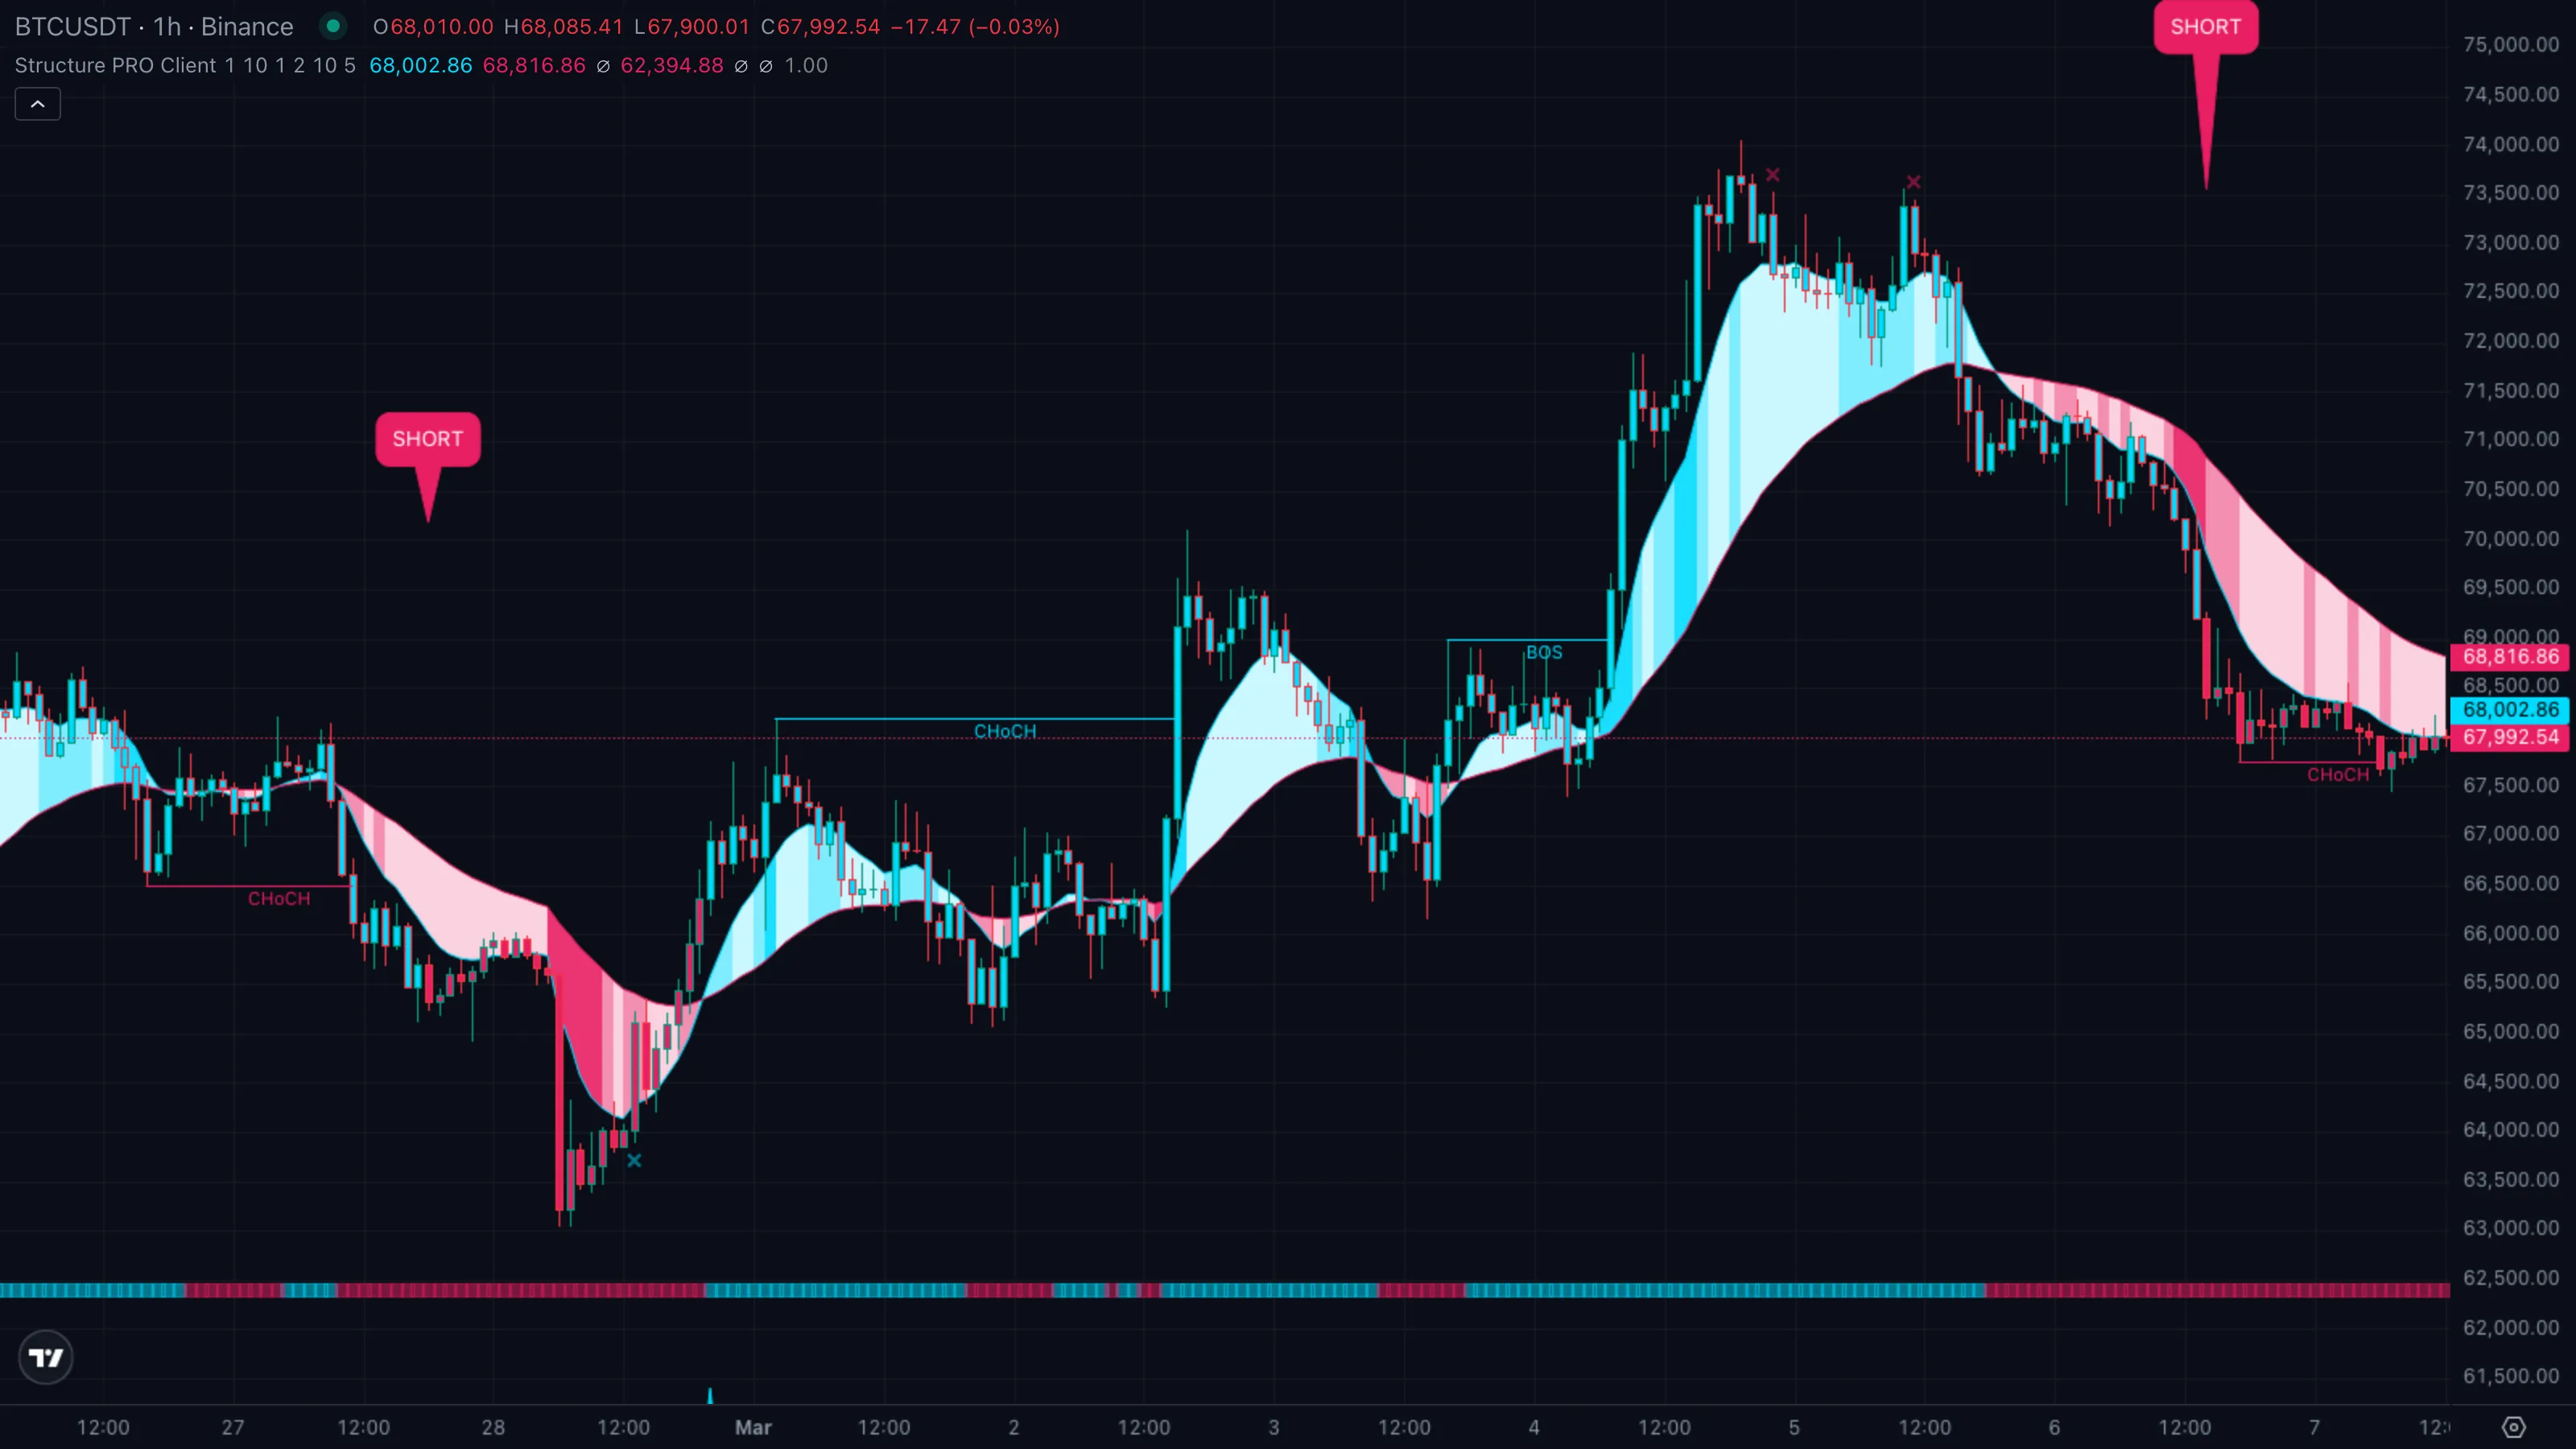
| Symbol | BTCUSDT |
|---|---|
| Timeframe | 4H |
| Venue | Binance |
| Window | 10 Mar to 22 Mar 2026 |
| Pattern | B — BOSBreak of StructureA close past the most recent swing high or low in the same direction as the prevailing trend. Signals trend continuation.Click for full definition → confirms the reversal |
A clean Pattern B on Bitcoin's 4H chart. Price spent the first half of March printing lower highs and lower lows, ran out of sellers near 60,000, and then walked the textbook two-step into a fresh uptrend. The numbered markers ①-④ on the chart map to the four phases below.
The sequence
| # | When | BTC price | Indicator state | What it tells you |
|---|---|---|---|---|
| ① | 10 to 14 Mar | 65,000 down to 60,400 | bear BOSBreak of StructureA close past the most recent swing high or low in the same direction as the prevailing trend. Signals trend continuation.Click for full definition → prints, bars pink | Downtrend intact. Each lower low gets a fresh BOSBreak of StructureA close past the most recent swing high or low in the same direction as the prevailing trend. Signals trend continuation.Click for full definition → line as price keeps stepping down. Stand aside or stay short with trailing stops. |
| ② | 16 Mar | ~62,800 close | CHoCHChange of CharacterA close past the most recent swing point in the opposite direction from the prior break. The first warning that the trend may be turning.Click for full definition → line prints | Price closes above the most recent swing highSwing High and Swing LowThe most recent confirmed pivot in either direction. Swing highs cap rallies until broken; swing lows support pullbacks until broken.Click for full definition → for the first time in twelve bars. The first break in the opposite direction. Warning, not entry. |
| ③ | 18 Mar | ~61,900 low | bull BOSBreak of StructureA close past the most recent swing high or low in the same direction as the prevailing trend. Signals trend continuation.Click for full definition → prints | PullbackPullback (Retracement)A short, counter-trend move within an established trend — buyers (or sellers) momentarily losing ground before the trend resumes. Often the lowest-risk place to enter the trend.Click for full definition → holds above the CHoCHChange of CharacterA close past the most recent swing point in the opposite direction from the prior break. The first warning that the trend may be turning.Click for full definition → level, then price closes through the swing highSwing High and Swing LowThe most recent confirmed pivot in either direction. Swing highs cap rallies until broken; swing lows support pullbacks until broken.Click for full definition → formed during the pullbackPullback (Retracement)A short, counter-trend move within an established trend — buyers (or sellers) momentarily losing ground before the trend resumes. Often the lowest-risk place to enter the trend.Click for full definition →. The real entry. Bars flip cyan, Vortex Cloud turns light cyan. |
| ④ | 21 Mar | ~67,400 high | top xcross prints, dots fade | A small red × prints above the bar as wavetrend hits overbought. The move is tiring. Cue to take profit before the next CHoCHChange of CharacterA close past the most recent swing point in the opposite direction from the prior break. The first warning that the trend may be turning.Click for full definition → in the opposite direction. |
The trade in one card
| What you skipped | Shorting the CHoCHChange of CharacterA close past the most recent swing point in the opposite direction from the prior break. The first warning that the trend may be turning.Click for full definition → bar at 62,800 because "the trend just changed." It hadn't. The single break could easily have failed back into the downtrend. |
| What you took | Long on the higher-low pullbackPullback (Retracement)A short, counter-trend move within an established trend — buyers (or sellers) momentarily losing ground before the trend resumes. Often the lowest-risk place to enter the trend.Click for full definition → at 61,900, sized off the BOSBreak of StructureA close past the most recent swing high or low in the same direction as the prevailing trend. Signals trend continuation.Click for full definition → line above as your confirmation, stop just under the swing lowSwing High and Swing LowThe most recent confirmed pivot in either direction. Swing highs cap rallies until broken; swing lows support pullbacks until broken.Click for full definition → that formed at 60,400. |
| Where you exited | When the top xcross printed near 67,400 and the bull BOSBreak of StructureA close past the most recent swing high or low in the same direction as the prevailing trend. Signals trend continuation.Click for full definition → lines stopped extending. StructureMarket StructureThe pattern of swing highs and lows price prints as it moves. Healthy uptrends print higher highs and higher lows; healthy downtrends print the mirror.Click for full definition → was still intact but momentum was out of fuel. |
| Move captured | ~ +8.9 % in roughly three days. |
Lesson
The CHoCHChange of CharacterA close past the most recent swing point in the opposite direction from the prior break. The first warning that the trend may be turning.Click for full definition → gives you the alert. The first BOSBreak of StructureA close past the most recent swing high or low in the same direction as the prevailing trend. Signals trend continuation.Click for full definition → in the new direction gives you the trade. The top or bottom xcross at an overbought or oversold extreme tells you when to step out.
6. Common Pitfalls
- Trading every CHoCHChange of CharacterA close past the most recent swing point in the opposite direction from the prior break. The first warning that the trend may be turning.Click for full definition →. A CHoCHChange of CharacterA close past the most recent swing point in the opposite direction from the prior break. The first warning that the trend may be turning.Click for full definition → on its own is the weakest signal StructureMarket StructureThe pattern of swing highs and lows price prints as it moves. Healthy uptrends print higher highs and higher lows; healthy downtrends print the mirror.Click for full definition → PRO prints. It marks one break in a new direction, which fails roughly half the time on liquid pairs. Always wait for the follow-up BOSBreak of StructureA close past the most recent swing high or low in the same direction as the prevailing trend. Signals trend continuation.Click for full definition → before treating it as a real reversal.
- Confusing BOSBreak of StructureA close past the most recent swing high or low in the same direction as the prevailing trend. Signals trend continuation.Click for full definition → with a breakout. A BOSBreak of StructureA close past the most recent swing high or low in the same direction as the prevailing trend. Signals trend continuation.Click for full definition → is structureMarket StructureThe pattern of swing highs and lows price prints as it moves. Healthy uptrends print higher highs and higher lows; healthy downtrends print the mirror.Click for full definition → breaking inside an existing trend. A breakout is price escaping a range. StructureMarket StructureThe pattern of swing highs and lows price prints as it moves. Healthy uptrends print higher highs and higher lows; healthy downtrends print the mirror.Click for full definition → PRO does not draw range boundaries — if the chart has been chopping sideways for fifty bars, the BOSBreak of StructureA close past the most recent swing high or low in the same direction as the prevailing trend. Signals trend continuation.Click for full definition → labels are essentially noise. Use the Vortex Cloud as a regime filter; if both moving averages are tangled and the cloud is washed-out, ignore the structureMarket StructureThe pattern of swing highs and lows price prints as it moves. Healthy uptrends print higher highs and higher lows; healthy downtrends print the mirror.Click for full definition → lines until a real trend prints.
- Trying to read structureMarket StructureThe pattern of swing highs and lows price prints as it moves. Healthy uptrends print higher highs and higher lows; healthy downtrends print the mirror.Click for full definition → on a 1-minute chart. The default swing length of 10 bars means a swing pointPivot High / Pivot LowA bar that is higher (or lower) than a defined number of bars on both sides. Confirmed only after the right-hand bars print without breaking it.Click for full definition → needs ten clean bars on each side. On a 1m chart in a quiet session, you'll get a swing every two minutes and the BOSBreak of StructureA close past the most recent swing high or low in the same direction as the prevailing trend. Signals trend continuation.Click for full definition →/CHoCHChange of CharacterA close past the most recent swing point in the opposite direction from the prior break. The first warning that the trend may be turning.Click for full definition → labels will fire constantly. Stick to 1H or 4H for swing trading; 15m for intraday execution.
- Reading the LONG / SHORT callouts as primary signals. They come from a separate trailing-stop engine and they fire more often than the structureMarket StructureThe pattern of swing highs and lows price prints as it moves. Healthy uptrends print higher highs and higher lows; healthy downtrends print the mirror.Click for full definition → breaks do. Treat them as confirmation of a CHoCHChange of CharacterA close past the most recent swing point in the opposite direction from the prior break. The first warning that the trend may be turning.Click for full definition → or BOSBreak of StructureA close past the most recent swing high or low in the same direction as the prevailing trend. Signals trend continuation.Click for full definition → that has already printed, not as standalone entries — otherwise you'll be fighting the structureMarket StructureThe pattern of swing highs and lows price prints as it moves. Healthy uptrends print higher highs and higher lows; healthy downtrends print the mirror.Click for full definition → half the time.
- Forgetting that swing pointsPivot High / Pivot LowA bar that is higher (or lower) than a defined number of bars on both sides. Confirmed only after the right-hand bars print without breaking it.Click for full definition → are confirmed late. A swing highSwing High and Swing LowThe most recent confirmed pivot in either direction. Swing highs cap rallies until broken; swing lows support pullbacks until broken.Click for full definition → is only known to be a swing highSwing High and Swing LowThe most recent confirmed pivot in either direction. Swing highs cap rallies until broken; swing lows support pullbacks until broken.Click for full definition → after ten more bars print. That means the BOSBreak of StructureA close past the most recent swing high or low in the same direction as the prevailing trend. Signals trend continuation.Click for full definition → line connects back to a level that was confirmed several bars ago, not to "the highest bar you can see." If your eye says "but the real swing highSwing High and Swing LowThe most recent confirmed pivot in either direction. Swing highs cap rallies until broken; swing lows support pullbacks until broken.Click for full definition → is over there," it usually means a higher swing hasn't been confirmed yet — be patient.